Upgrade to Pro — share decks privately, control downloads, hide ads and more …

Structuring Your (Data Science/Analysis) Projects

Daniel Chen
November 08, 2018

Structuring Your (Data Science/Analysis) Projects

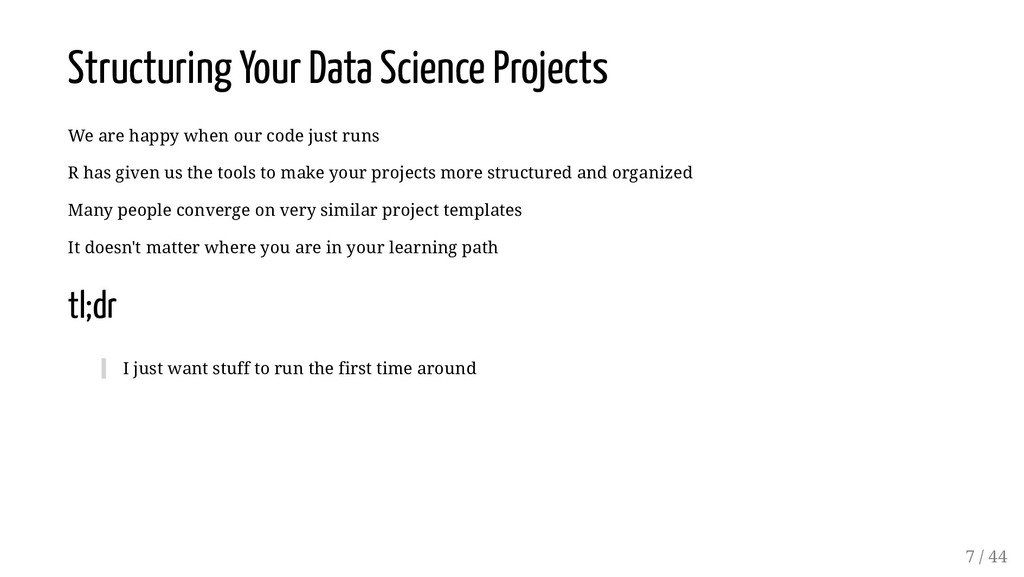
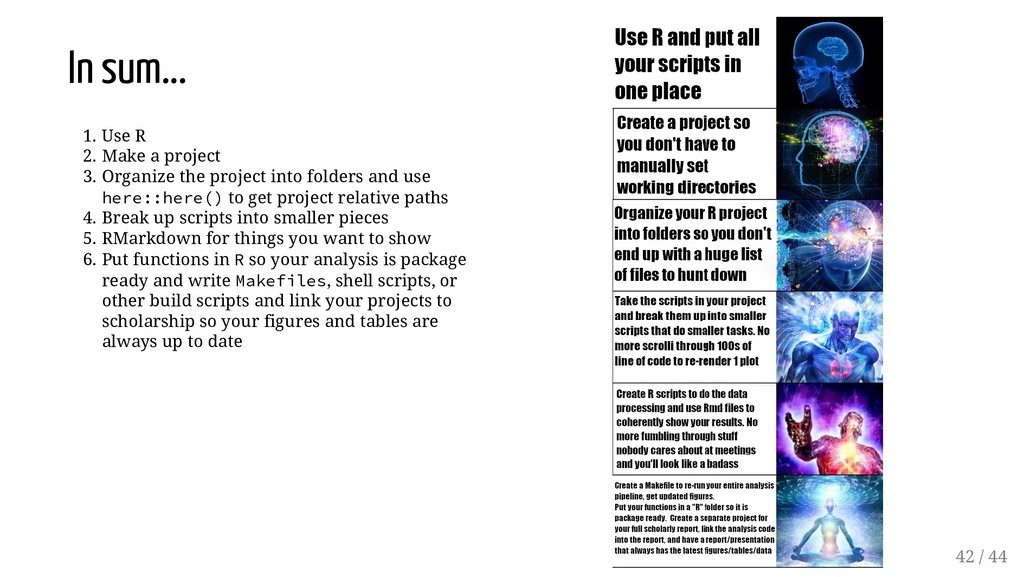
When we start programming we are happy when our code just runs. As we get more experienced, we begin to add more structure to our projects. We start off by dumping all our files into a folder, then we might create subfolders to help organize our work. We might even structure our projects so we can share our work easily with potential collaborators. As our projects grow, we might need to reuse bits and pieces in other projects, and finally consolidate our work into some written report. R has given us the tools to make your projects more structured and organized. And as we start to become more familiar with these tools, you realize that many people converge on very similar project templates. They all aim to make projects clearer, shareable, and simply "work". It doesn't matter where you are in your learning path, you can always benefit from adding a little more structure to your data science projects.

Daniel Chen

November 08, 2018
Tweet

More Decks by Daniel Chen

Other Decks in Technology

Transcript

  1. PhD Student: Virginia Tech Data Enginner: University of Virginia Instructor:

    DataCamp, The Carpentries Data Scientist: Lander Analytics Member: Meetup (DataCommunity DC) Event Photographer SCUBA Diver (Cavern, Divemaster) Snowboarder Author: I'm Daniel 3 / 44
  2. What do these talks have in common? How I do

    my work. What I teach my students (and you)! Working together with multiple people. Being confident that things are "correct". 6 / 44
  3. Structuring Your Data Science Projects We are happy when our

    code just runs R has given us the tools to make your projects more structured and organized Many people converge on very similar project templates It doesn't matter where you are in your learning path tl;dr I just want stuff to run the first time around 7 / 44
  4. Tidy Data Paper -- Billboard Dataset Tidy data paper Billboard

    dataset Github repository has "original" and "cleaned" data 8 / 44
  5. Clean Data (Original) library(stringr) library(plyr) rm(list = ls()) setwd('~/git/hub/rstatsdc_2018-structure/01-just_starting_out/') raw

    <- read.csv("billboard.csv") raw <- raw[, c("year", "artist.inverted", "track", "time", "date.entered", "x1st.week", "x2nd.week", "x3rd.week", "x4th.week", "x5th.week", "x6th.week", "x7th.week", "x8t "x76th.week")] names(raw)[2] <- "artist" raw$artist <- iconv(raw$artist, "MAC", "ASCII//translit") raw$track <- stringr::str_replace(raw$track, " \\(.*?\\)", "") names(raw)[-(1:5)] <- str_c("wk", 1:76) raw <- plyr::arrange(raw, year, artist, track) long_name <- nchar(raw$track) > 20 raw$track[long_name] <- paste0(substr(raw$track[long_name], 0, 20), "...") 10 / 44
  6. Clean Data ## year artist track time date.entered wk1 wk2

    wk3 ## 1 2000 2 Pac Baby Don't Cry 4:22 2000-02-26 87 82 72 ## 2 2000 2Ge+her The Hardest Part Of ... 3:15 2000-09-02 91 87 92 ## 3 2000 3 Doors Down Kryptonite 3:53 2000-04-08 81 70 68 ## 4 2000 3 Doors Down Loser 4:24 2000-10-21 76 76 72 ## 5 2000 504 Boyz Wobble Wobble 3:35 2000-04-15 57 34 25 ## 6 2000 98? Give Me Just One Nig... 3:24 2000-08-19 51 39 34 ## wk4 wk5 wk6 wk7 wk8 wk9 wk10 wk11 wk12 wk13 wk14 wk15 wk16 wk17 wk18 ## 1 77 87 94 99 NA NA NA NA NA NA NA NA NA NA NA ## 2 NA NA NA NA NA NA NA NA NA NA NA NA NA NA NA ## 3 67 66 57 54 53 51 51 51 51 47 44 38 28 22 18 ## 4 69 67 65 55 59 62 61 61 59 61 66 72 76 75 67 ## 5 17 17 31 36 49 53 57 64 70 75 76 78 85 92 96 ## 6 26 26 19 2 2 3 6 7 22 29 36 47 67 66 84 ## wk19 wk20 wk21 wk22 wk23 wk24 wk25 wk26 wk27 wk28 wk29 wk30 wk31 wk32 ## 1 NA NA NA NA NA NA NA NA NA NA NA NA NA NA ## 2 NA NA NA NA NA NA NA NA NA NA NA NA NA NA ## 3 18 14 12 7 6 6 6 5 5 4 4 4 4 3 ## 4 73 70 NA NA NA NA NA NA NA NA NA NA NA NA ## 5 NA NA NA NA NA NA NA NA NA NA NA NA NA NA ## 6 93 94 NA NA NA NA NA NA NA NA NA NA NA NA ## wk33 wk34 wk35 wk36 wk37 wk38 wk39 wk40 wk41 wk42 wk43 wk44 wk45 wk46 11 / 44
  7. Clean Data (Tidyverse) library(readr) library(dplyr) library(stringr) rm(list = ls()) setwd('~/git/hub/rstatsdc_2018-structure/01-just_starting_out/')

    (raw <- readr::read_csv('billboard.csv') %>% dplyr::select(year, artist.inverted, track, time, date.entered, x1st.week:x76th.week) %>% dplyr::rename(artist = artist.inverted) %>% dplyr::mutate(artist = iconv(artist, "MAC", "ASCII//translit")) %>% dplyr::mutate(track = stringr::str_replace(track, " \\(.*?\\)", "")) %>% dplyr::arrange(year, artist, track) %>% dplyr::mutate(track = dplyr::case_when( nchar(track) > 20 ~ stringr::str_c(stringr::str_sub(track, 0, 20), "..."), TRUE ~ track )) ) (names(raw)[-(1:5)] <- str_c("wk", 1:76)) # changed the order here 12 / 44
  8. Clean Data ## # A tibble: 317 x 81 ##

    year artist track time date.entered wk1 wk2 wk3 wk4 wk5 ## <int> <chr> <chr> <tim> <date> <int> <int> <int> <int> <int> ## 1 2000 2 Pac Baby… 04:22 2000-02-26 87 82 72 77 87 ## 2 2000 2Ge+h… The … 03:15 2000-09-02 91 87 92 NA NA ## 3 2000 3 Doo… Kryp… 03:53 2000-04-08 81 70 68 67 66 ## 4 2000 3 Doo… Loser 04:24 2000-10-21 76 76 72 69 67 ## 5 2000 504 B… Wobb… 03:35 2000-04-15 57 34 25 17 17 ## 6 2000 98? Give… 03:24 2000-08-19 51 39 34 26 26 ## 7 2000 A*Tee… Danc… 03:44 2000-07-08 97 97 96 95 100 ## 8 2000 Aaliy… I Do… 04:15 2000-01-29 84 62 51 41 38 ## 9 2000 Aaliy… Try … 04:03 2000-03-18 59 53 38 28 21 ## 10 2000 Adams… Open… 05:30 2000-08-26 76 76 74 69 68 ## # ... with 307 more rows, and 71 more variables: wk6 <int>, wk7 <int>, ## # wk8 <int>, wk9 <int>, wk10 <int>, wk11 <int>, wk12 <int>, wk13 <int>, ## # wk14 <int>, wk15 <int>, wk16 <int>, wk17 <int>, wk18 <int>, ## # wk19 <int>, wk20 <int>, wk21 <int>, wk22 <int>, wk23 <int>, ## # wk24 <int>, wk25 <int>, wk26 <int>, wk27 <int>, wk28 <int>, ## # wk29 <int>, wk30 <int>, wk31 <int>, wk32 <int>, wk33 <int>, ## # wk34 <int>, wk35 <int>, wk36 <int>, wk37 <int>, wk38 <int>, ## # wk39 <int>, wk40 <int>, wk41 <int>, wk42 <int>, wk43 <int>, ## # wk44 <int>, wk45 <int>, wk46 <int>, wk47 <int>, wk48 <int>, 13 / 44
  9. Do you want your computer set on re...? ... because

    that's how you get your computer set on fire. 15 / 44
  10. What's wrong with setwd()? You are assuming a folder structure

    Your collaborator might not have the same structure Your other computer might not have the same structure You want to move files and folders around and now... you guessed it, don't have the same structure! You end up having a different line in your code for every possible location and commenting it in and out Annoying for yourself, others, and Version control systems 16 / 44
  11. Make a Project diff -r 01-just_starting_out 02-projects | grep "Only

    in 02-projects" ## Only in 02-projects: 02-projects.Rproj ## Only in 02-projects: .Rproj.user 17 / 44
  12. RStudio projects assume everyone is using RStudio TRUE ## [1]

    TRUE but... Emacs ESS allows you to pick the working directory cd in linux changes the working directory Run code from working directory 18 / 44
  13. What's wrong with rm(list = ls())? It doesn't detatch libraries

    You might end up using a function without an explicit library call in your script What do I do instead? 1. RStudio: Session > Restart R (Ctrl + Shift + F10) 2. Terminal: Rscript myscript.R 19 / 44
  14. But basically... 1. Data (e.g., data) 1. orginal folder from

    your original (read-only) data 2. processed folder that your scripts create If you want you can break down processed to intermediate and/or final Do whatever feels right Create symbolic links (i.e., shortcuts) as needed if you are using a version control system. 2. Code (e.g., src, analysis) Same thing as the data folder: create subfolders as necessary 3. Output (e.g., output, plots, results)1 1. Things your script outputs that is not a dataset 2. git does not track empty folders, so put in a README.md or .gitkeep file 4. Functions (e.g., R) 5. README files Make sub-folders as needed, everything is in a project and/or has a fixed working directory. [1] Can get weird in git with image conflicts. But works great on shared drives/dropbox! 25 / 44
  15. Can we do better? Of course. How long is my

    script? wc 01-just_starting_out/analysis.R ## 171 682 6348 01-just_starting_out/analysis.R What does my script do? 1. Loads 2. Cleans 3. Tidy 4. Normalize 5. EDA 6. Model 27 / 44
  16. 1. Loads 2. Cleans 3. Tidy 4. Normalize 5. EDA

    6. Model 1. 01-load.R 2. 02-01-clean.R 3. 02-02-tidy.R 4. 02-03-normalize.R 5. 03-eda.R 6. 04-model.R Split it up into separate scripts ... in a subfolder Be sensible, a 2 line script is probably not worth it, but a 2000 line script is unwieldy. 28 / 44
  17. What else? Rachael Tatman (from Kaggle) @rctatman R-Ladies organizer (Seattle

    chapter) Data scientist at Kaggle RLadies DC Meetup: Put together a data science portfolio http://www.rctatman.com/files/Tatman_2018_DataSciencePortfolios_DC.pdf 30 / 44
  18. 1. Loads 2. Cleans 3. Tidy 4. Normalize 5. EDA

    6. Model 1. 01-load.R 2. 02-01-clean.R 3. 02-02-tidy.R 4. 02-03-normalize.R 5. 03-eda.Rmd 6. 04-model.Rmd Knitr 33 / 44
  19. But... Sometimes working with knitr in RStudio projects get weird

    because of working directories [1] I don't work in RStudio Fix this with the here package It's based off rprojroot In here::here(): Is a file named .here present? Is this an RStudio Project? Literally, can I find a file named something like foo.Rproj? Is this an R package? Does it have a DESCRIPTION file? Is this a remake project? Does it have a file named remake.yml? Is this a projectile project? Does it have a file named .projectile? Is this a checkout from a version control system? Does it have a directory named .git or .svn? - Currently, only Git and Subversion are supported. [1] Also loses file tab completion within Rmd document. Worth? 34 / 44
  20. Functions Not shown in this example But... 1. Put them

    in an R folder for easy reference and sourceing. 2. Get's the analysis project ready to turn into an R package 36 / 44
  21. What about scholarship/formal reports (LaTeX)? 1. Sibbling project 1. Child

    project (git submodules?) Symbolic links (i.e., shortcuts) could work too ln -s ~/git/hub/rstatsdc_2018-structure/06-make . \begin{figure}[H] \centering \includegraphics[width=.7\linewidth]{../06-make/output/billboard_rank_plots/avg_rank_by_week_ \end{figure} \begin{figure}[H] \centering \includegraphics[width=.7\linewidth]{./06-make/output/billboard_rank_plots/avg_rank_by_week_a \end{figure} 37 / 44
  22. knitr button puts output in the source le location The

    output document is put in the analysis folder. I want it in the output folder! Solution use rmarkdown::render() # not executed during build rmarkdown::render(here::here('./analysis/billboard_eda/03-eda.Rmd'), output_dir = './output/billboard_reports') 38 / 44
  23. Too many commands to run! 1. Shell Script 2. Make

    3. RStudio > Build (?) 39 / 44
  24. Make le BILLBOARD=./analysis/billboard_eda/ all : commands ## commands : show

    all commands. commands : @grep -E '^##' Makefile | sed -e 's/## //g' ## billboard_eda : re-generate billboard eda analsyis billboard_eda : Rscript ${BILLBOARD}/01* Rscript ${BILLBOARD}/02-01* Rscript ${BILLBOARD}/02-02* Rscript ${BILLBOARD}/02-03* Rscript -e "rmarkdown::render(here::here('./analysis/billboard_eda/03-eda.Rmd'), output_dir = Rscript -e "rmarkdown::render(here::here('./analysis/billboard_eda/04-model.Rmd'), output_dir ## clean : clean up junk files. clean : find data/processed/ -type f -name '*.csv' | xargs rm find analysis/ type f -name '*.html' | xargs rm 40 / 44
  25. In sum... 1. Use R 2. Make a project 3.

    Organize the project into folders and use here::here() to get project relative paths 4. Break up scripts into smaller pieces 5. RMarkdown for things you want to show 6. Put functions in R so your analysis is package ready and write Makefiles, shell scripts, or other build scripts and link your projects to scholarship so your figures and tables are always up to date 42 / 44
  26. (More) Resources slide template: xaringan (remark.js) Jenny Bryan - Stop

    working directory insanity Jenny Bryan - Naming things John Myles White - ProjectTemplate John Blischak - workflowr: organized + reproducible + shareable data science in R rr-init Compuational Project Cookie Cutter 43 / 44