Upgrade to Pro — share decks privately, control downloads, hide ads and more …

Monitoring Postgres at Scale | PostgresConf US 2018 | Lukas Fittl

Monitoring Postgres at Scale | PostgresConf US 2018 | Lukas Fittl

Your PostgreSQL database is one of the most important pieces of your architecture - yet the level of introspection available in Postgres is often hard to work with. Its easy to get very detailed information, but what should you really watch out for, send reports on and alert on?

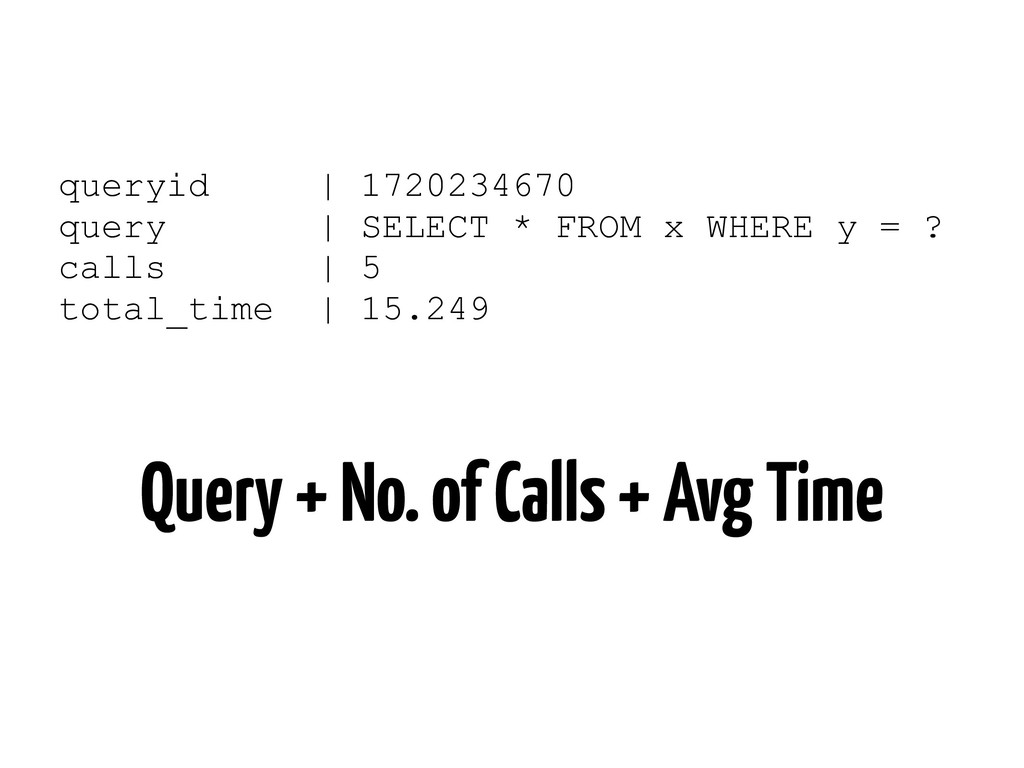
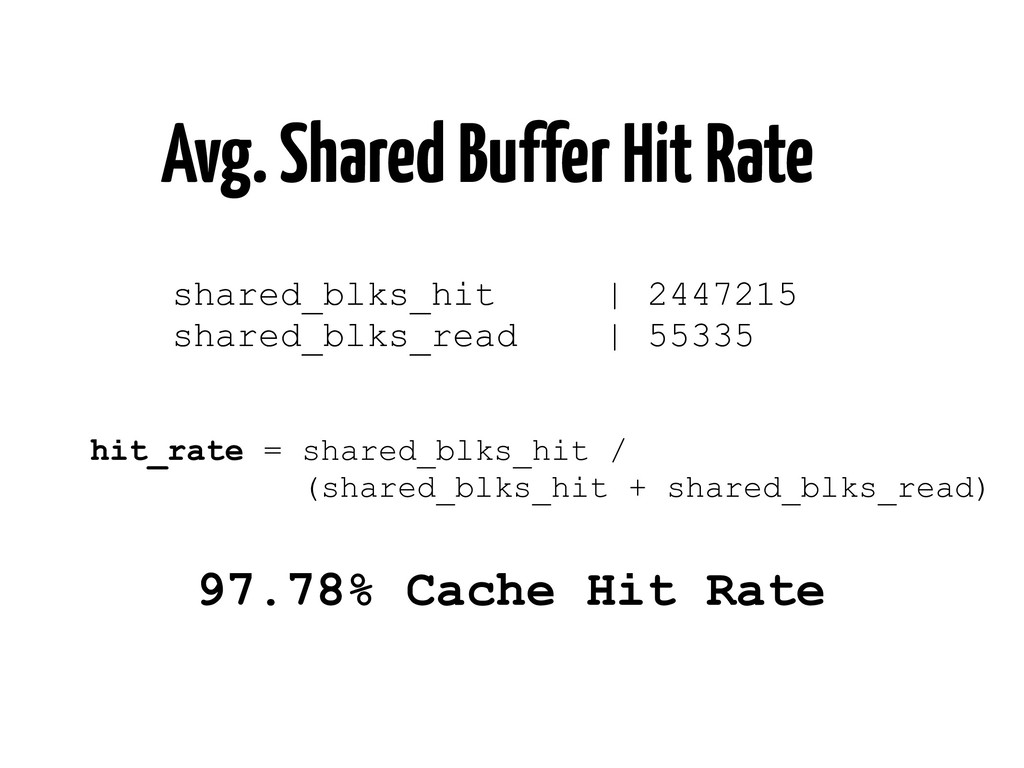
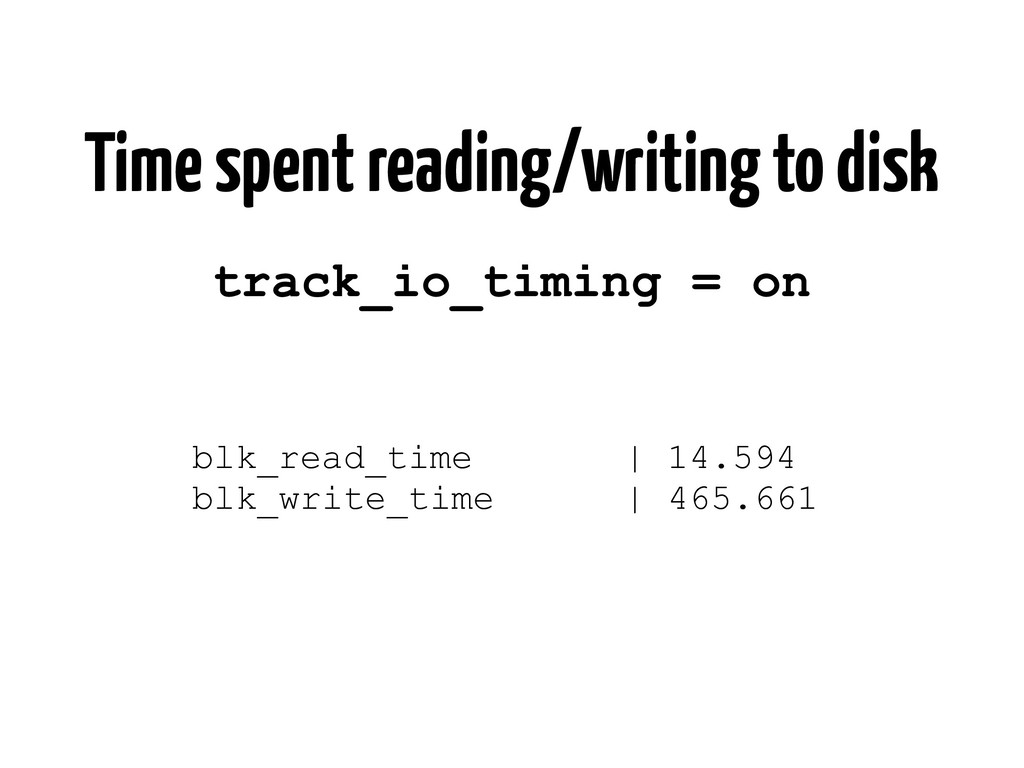
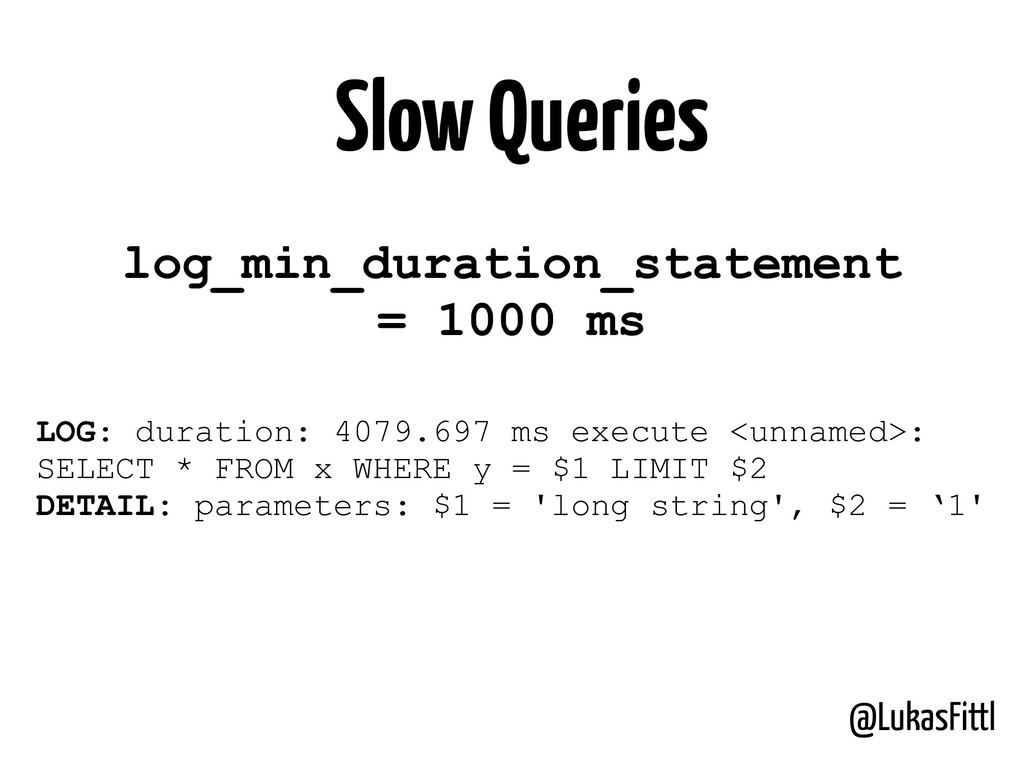
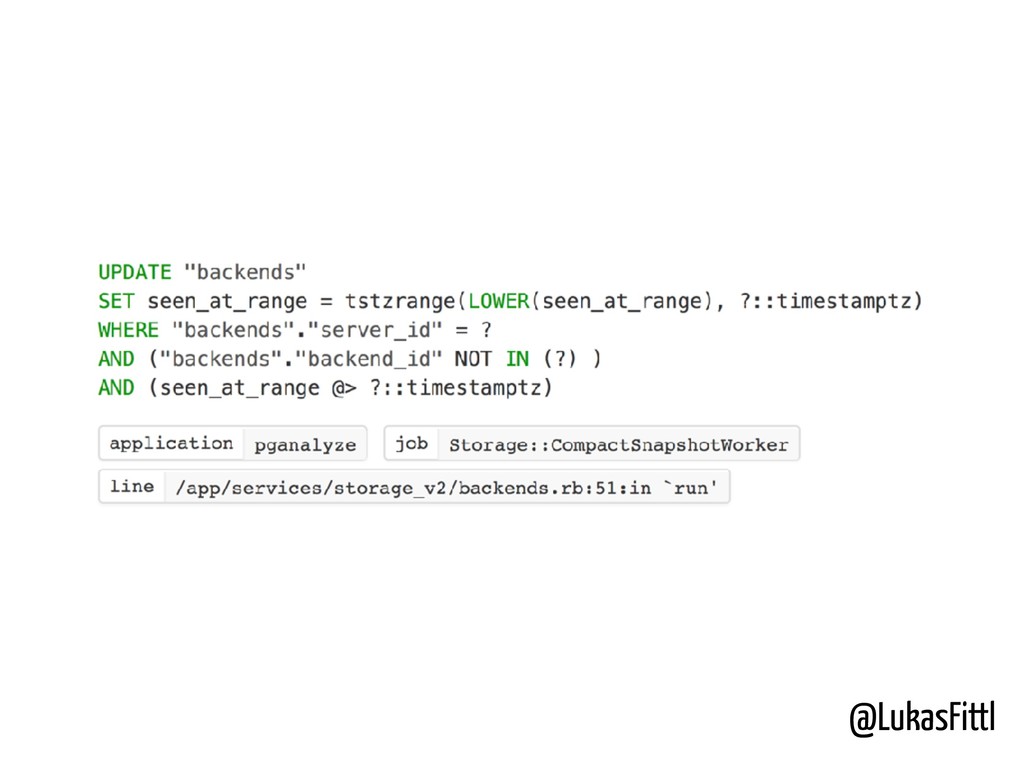
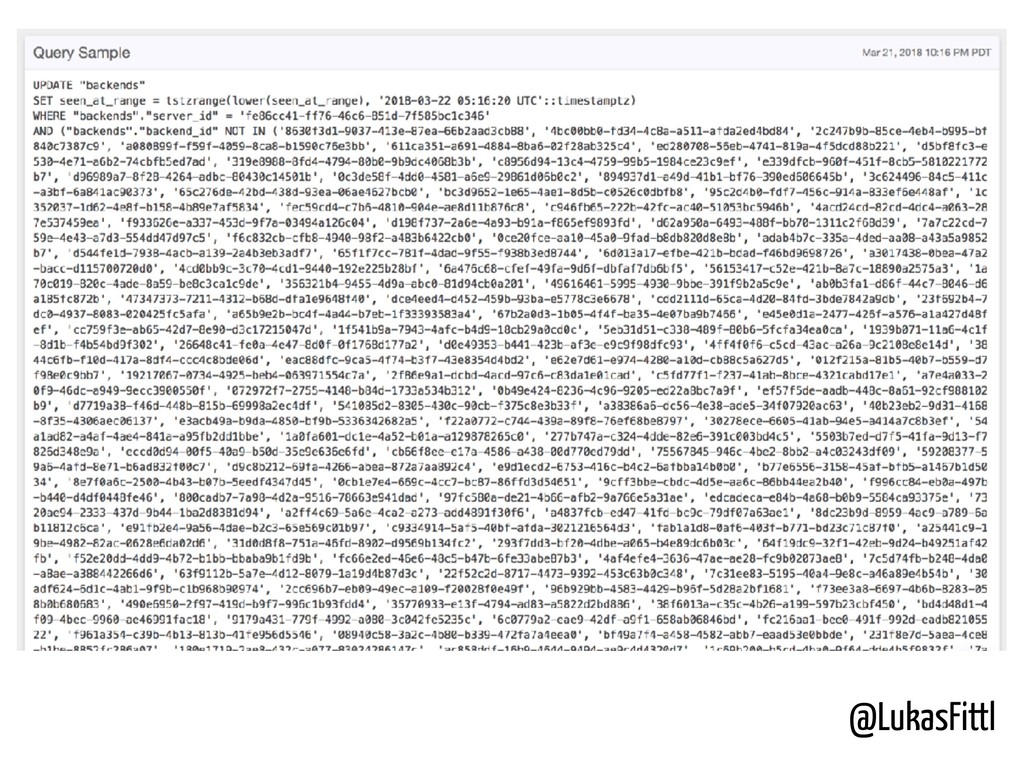
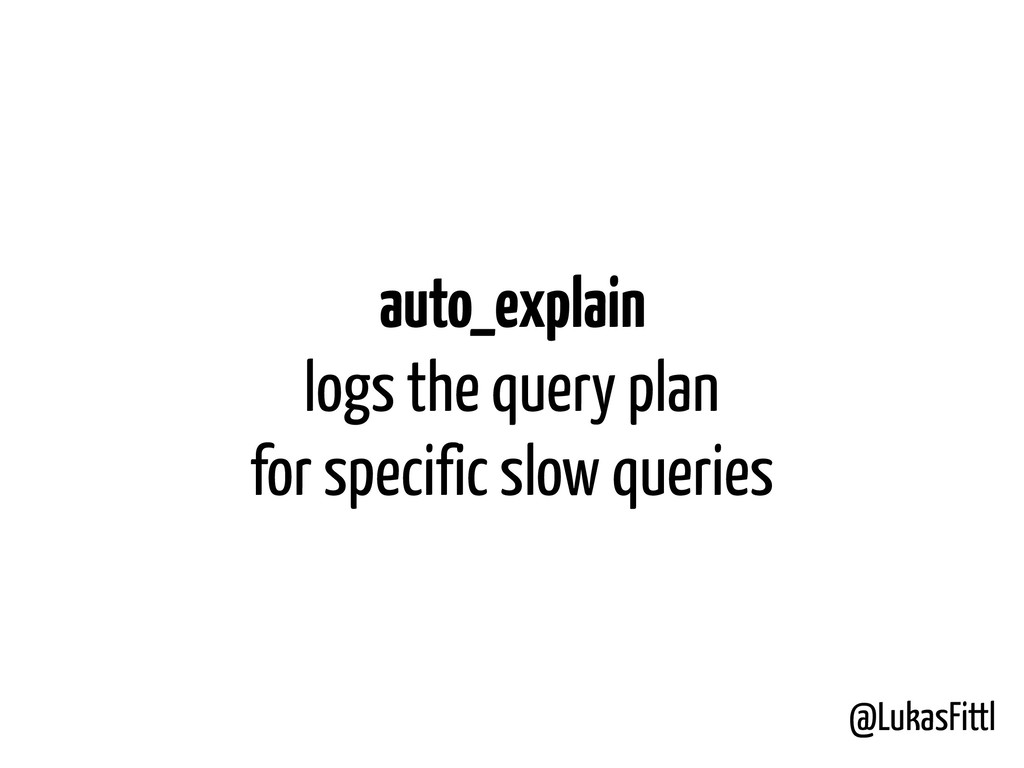
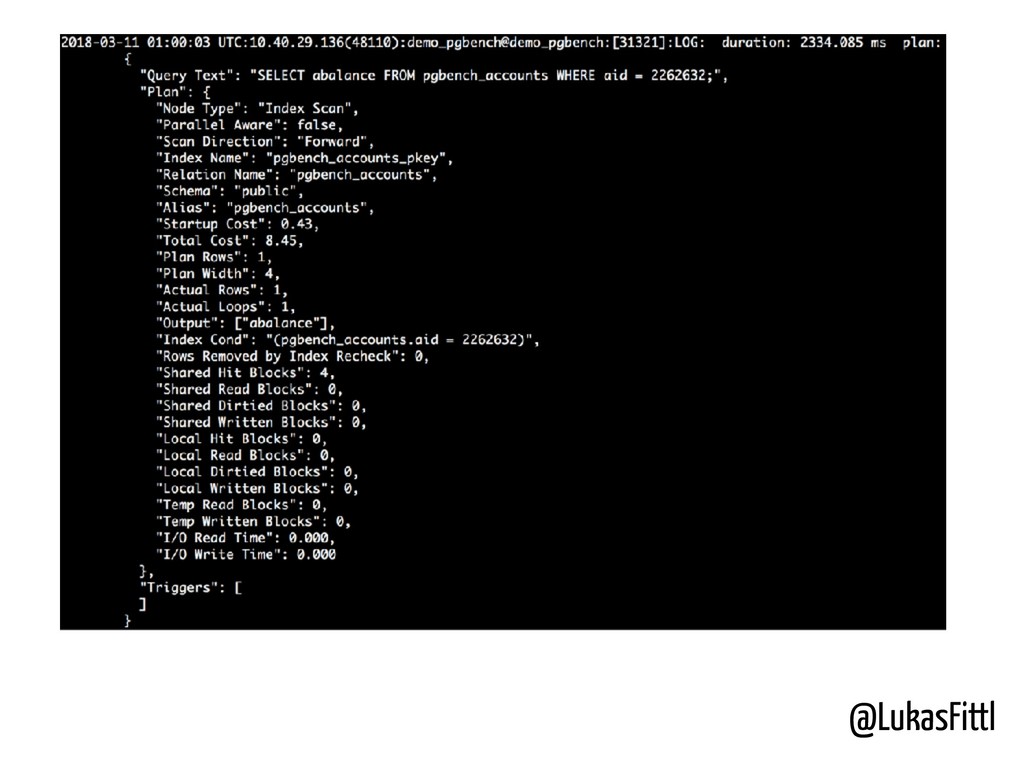
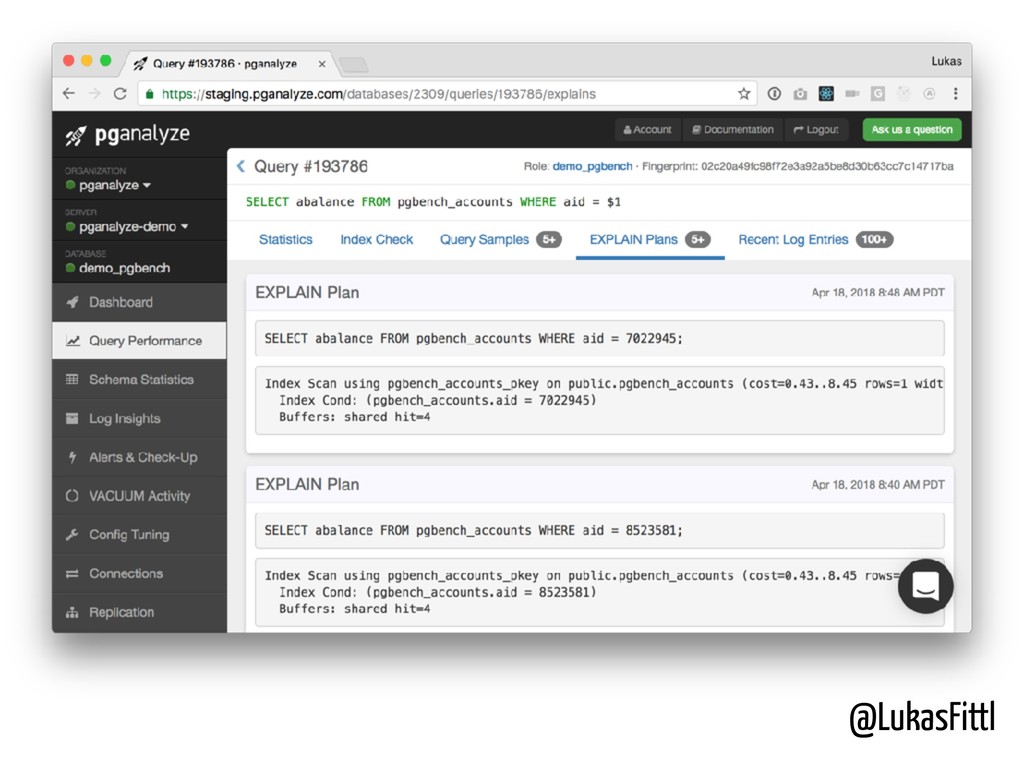
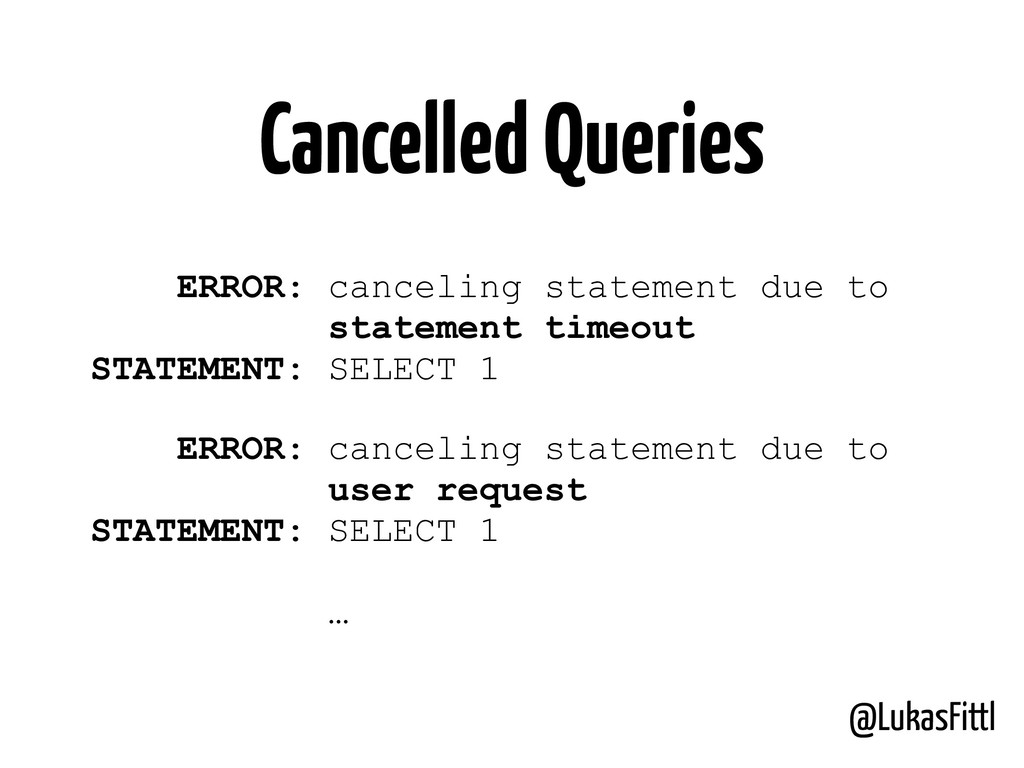
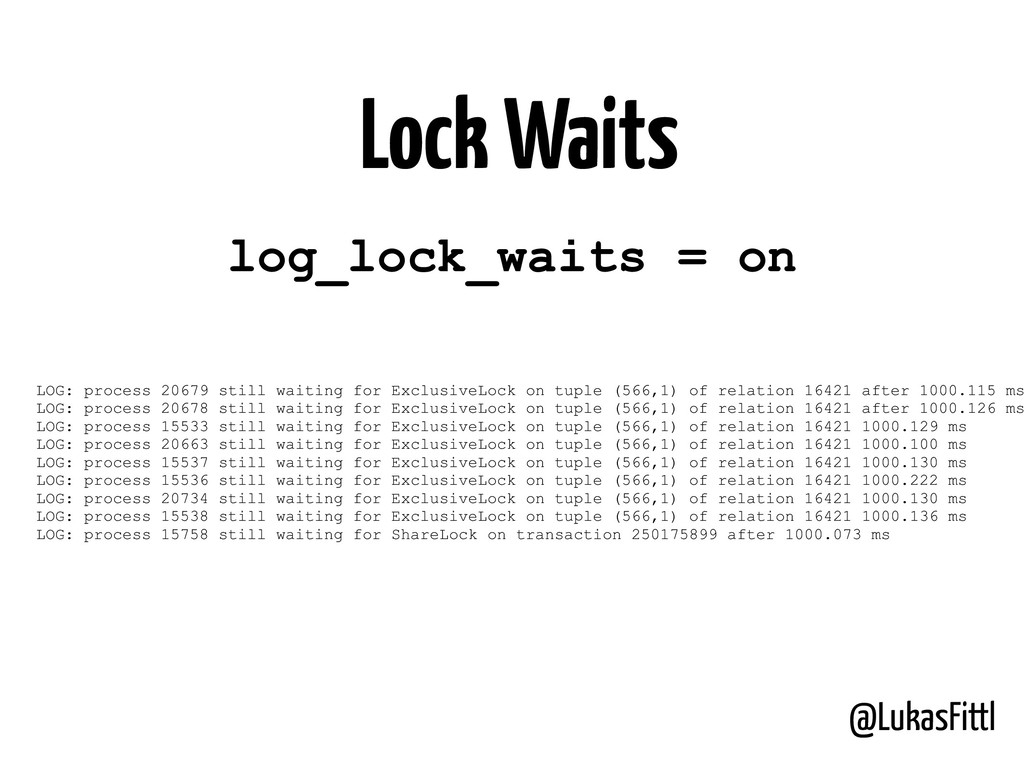
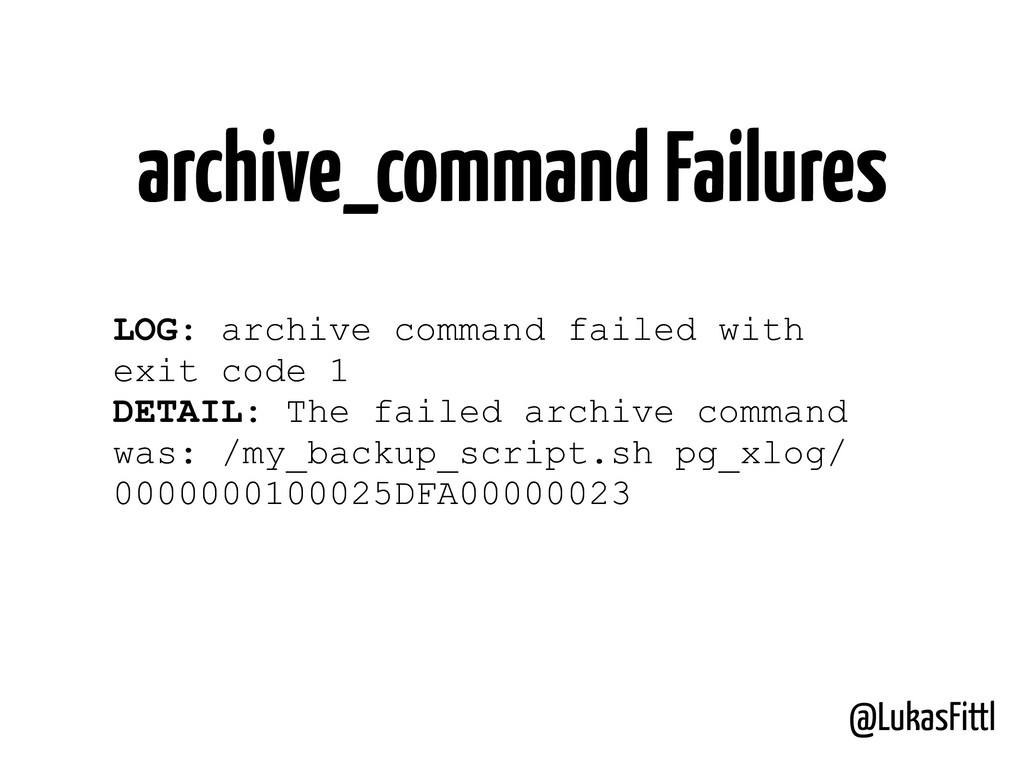
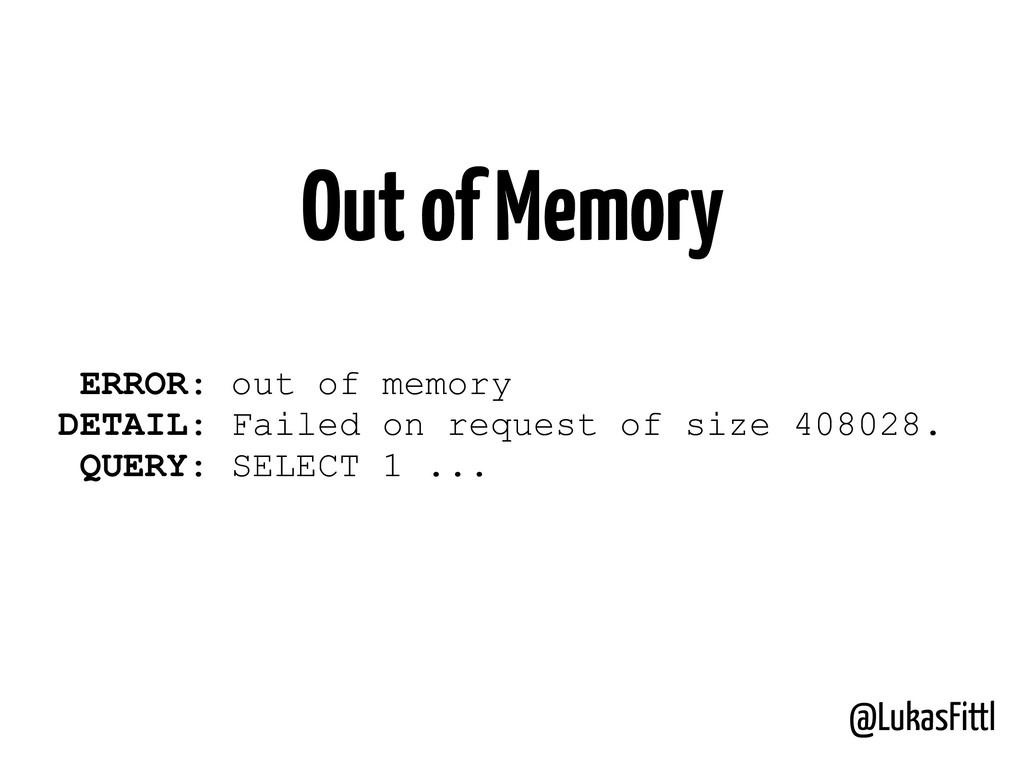
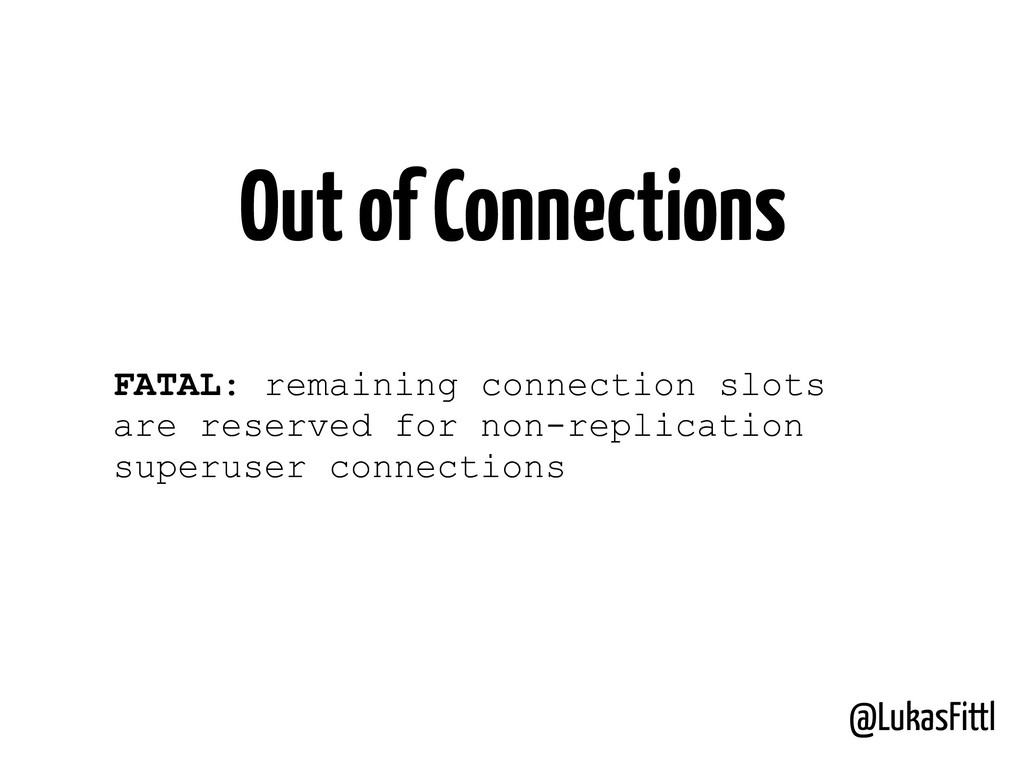
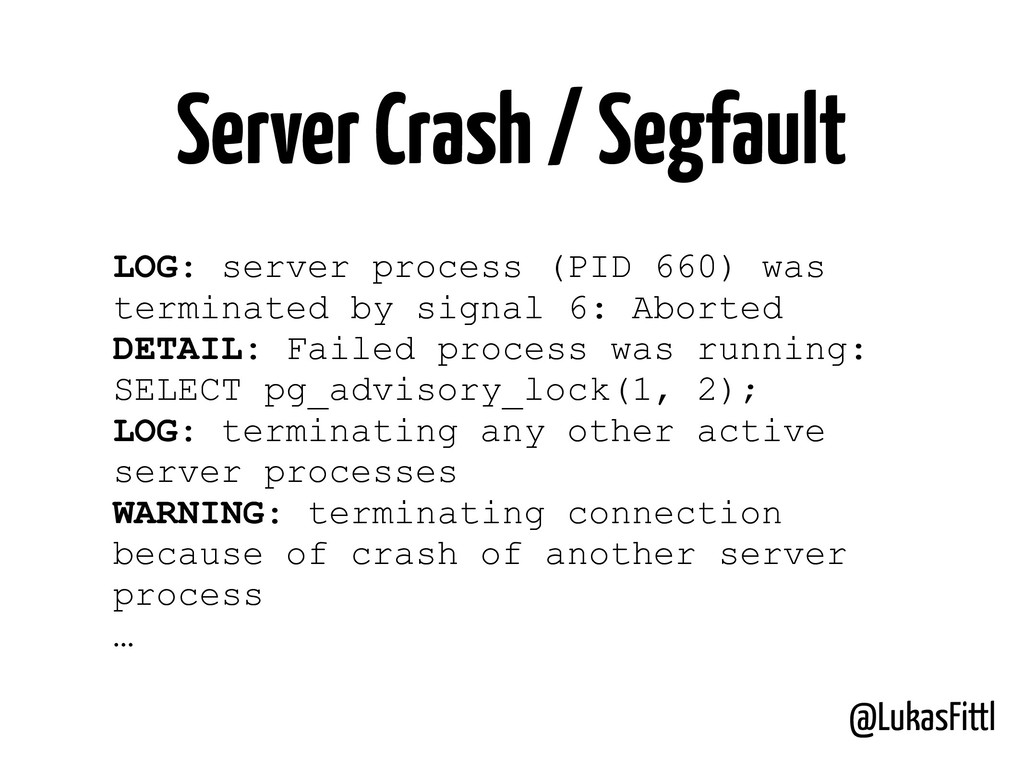
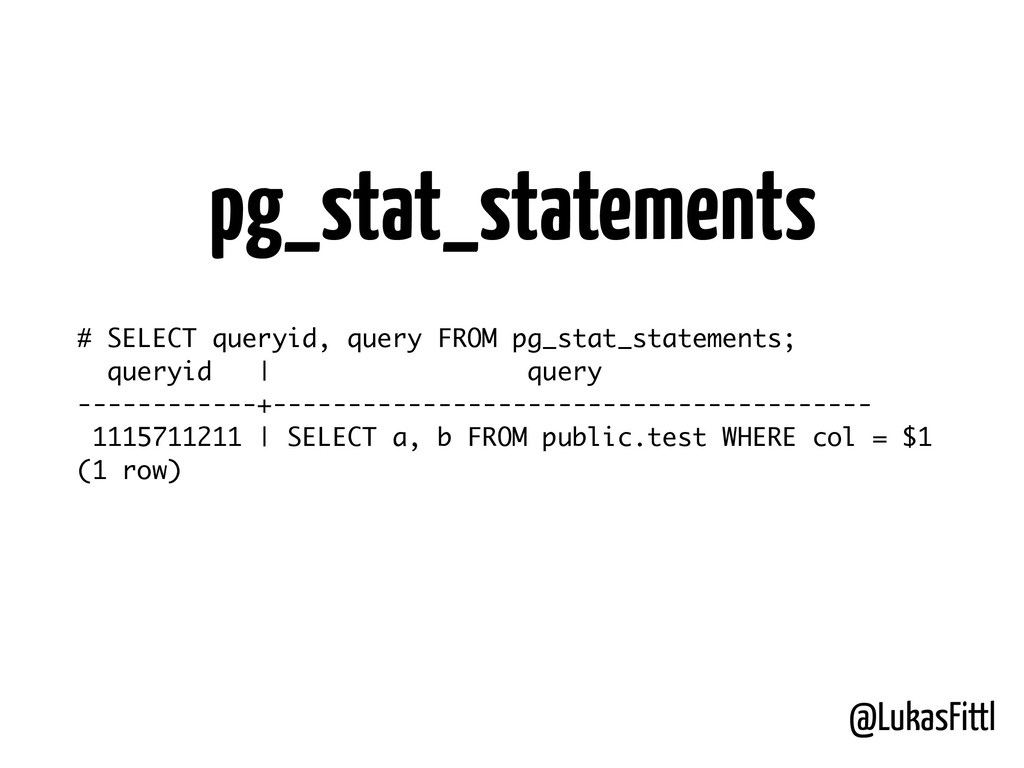
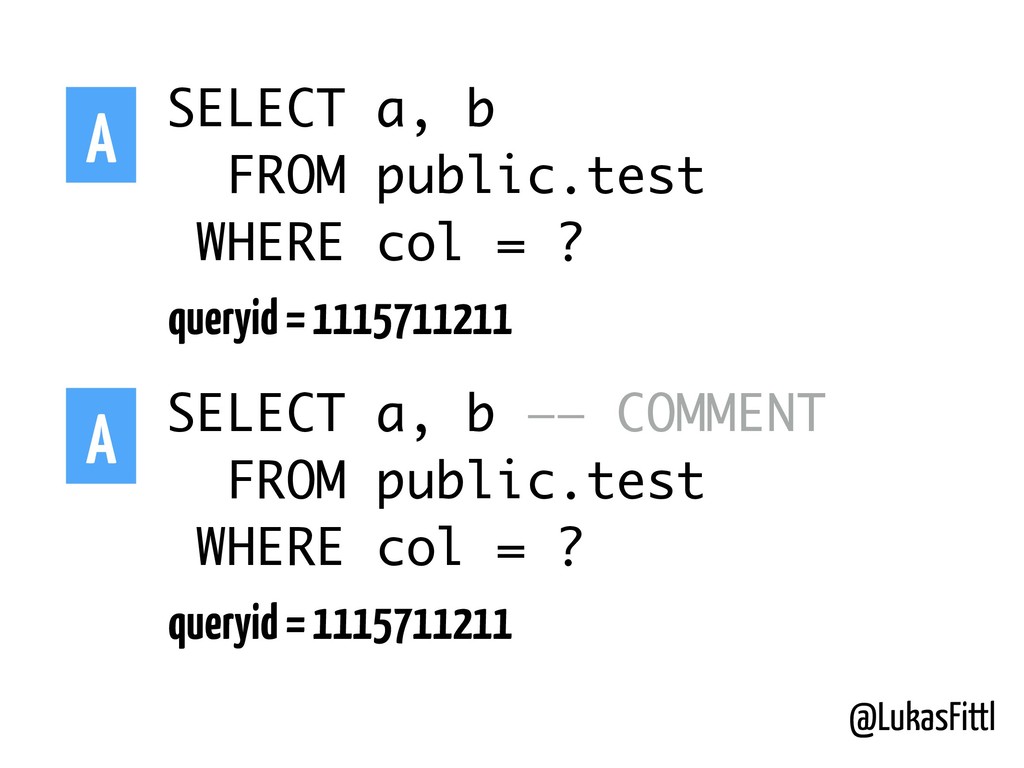
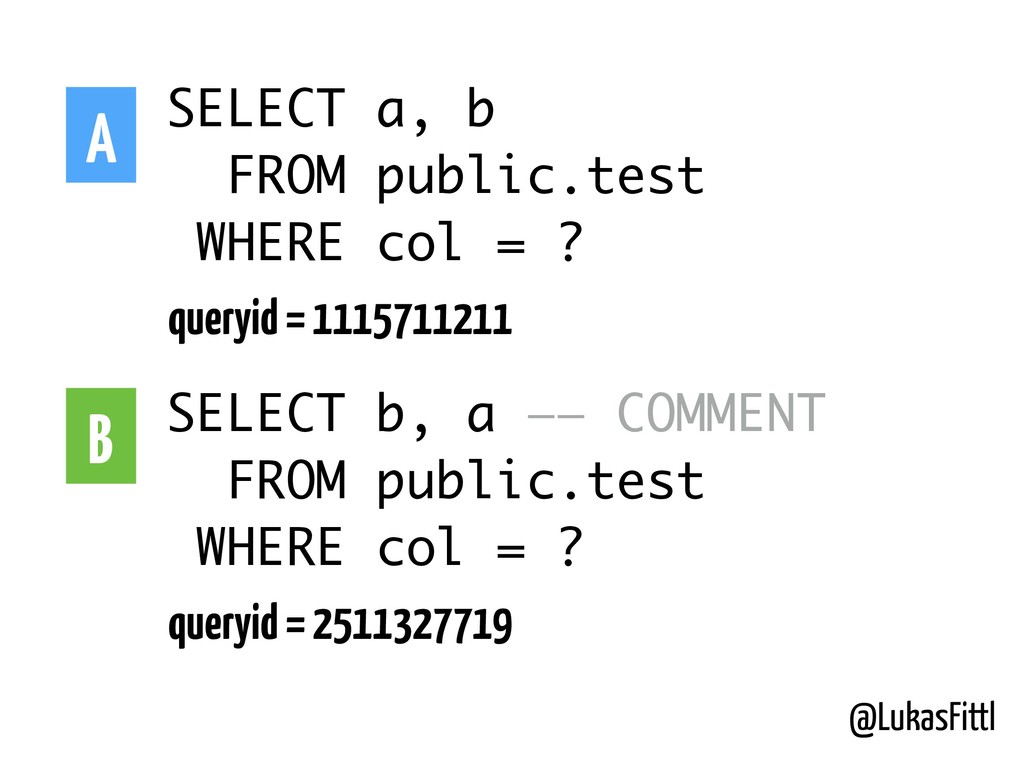
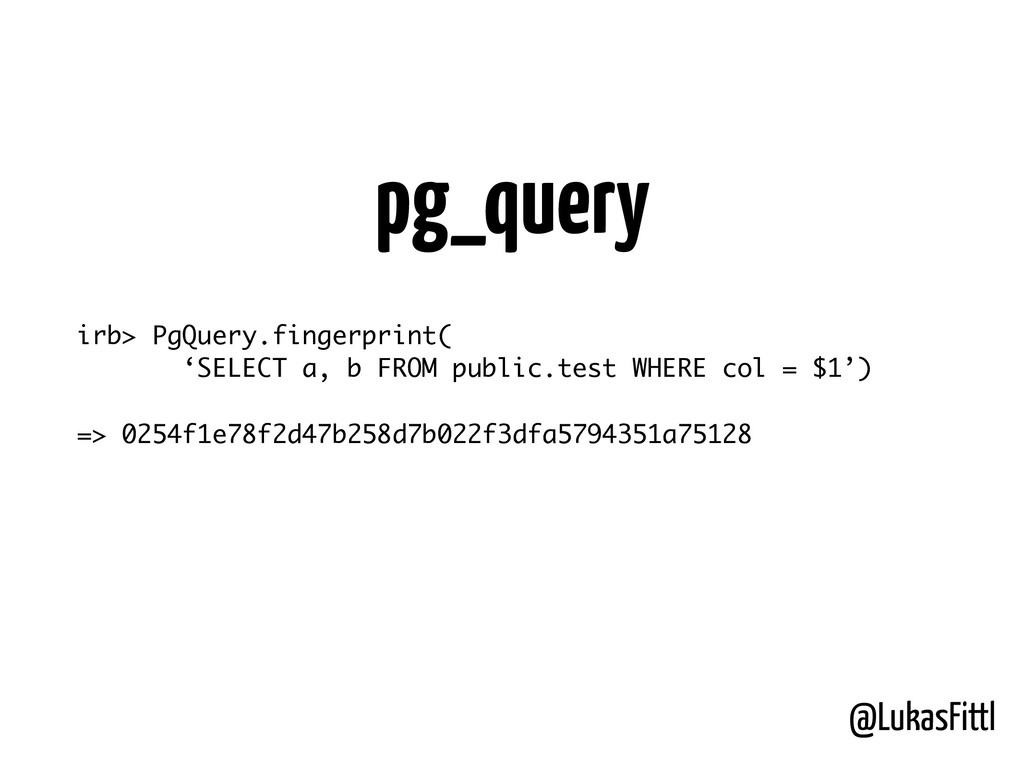
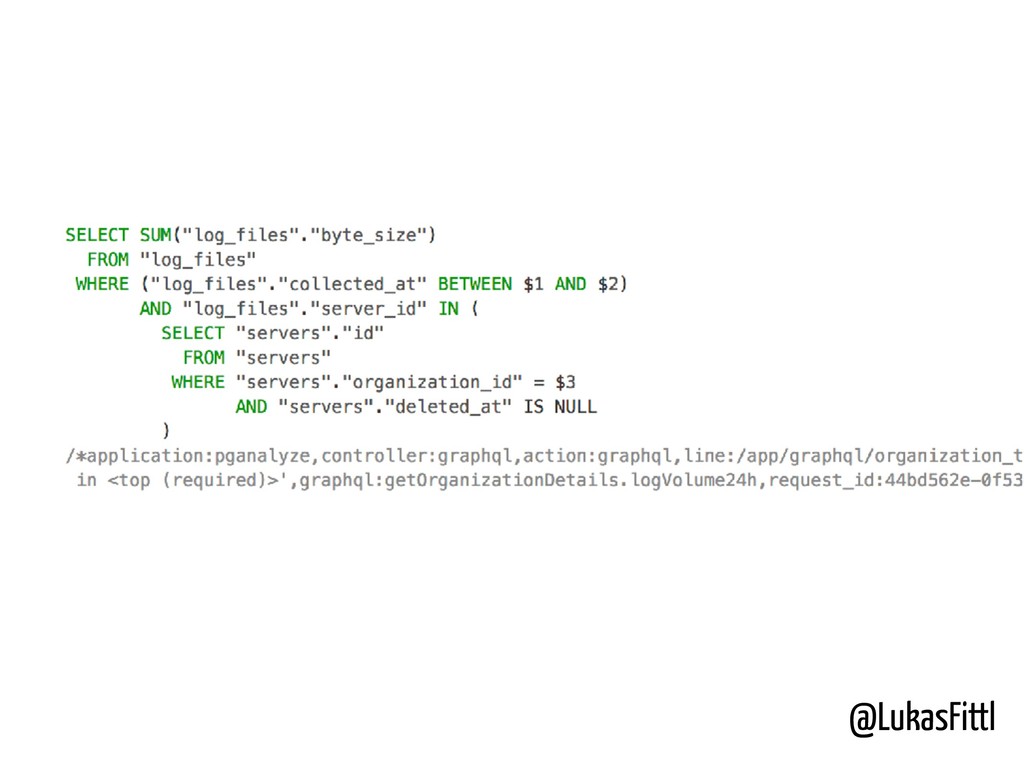
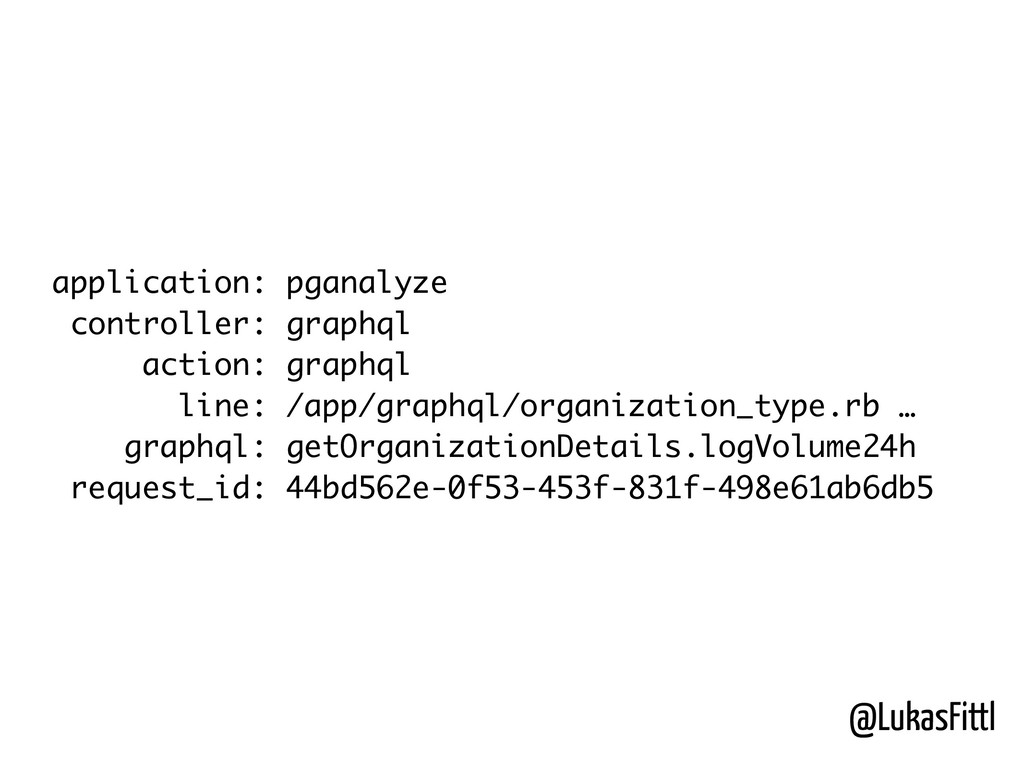
In this talk we'll discuss how query performance statistics can be made accessible to application developers, critical entries one should monitor in the PostgreSQL log files, how to collect EXPLAIN plans at scale, how to watch over autovacuum and VACUUM operations, and how to flag issues based on schema statistics.

We'll also talk a bit about monitoring multi-server setups, first going into high availability and read standbys, logical replication, and then reviewing how monitoring looks like for sharded databases like Citus.

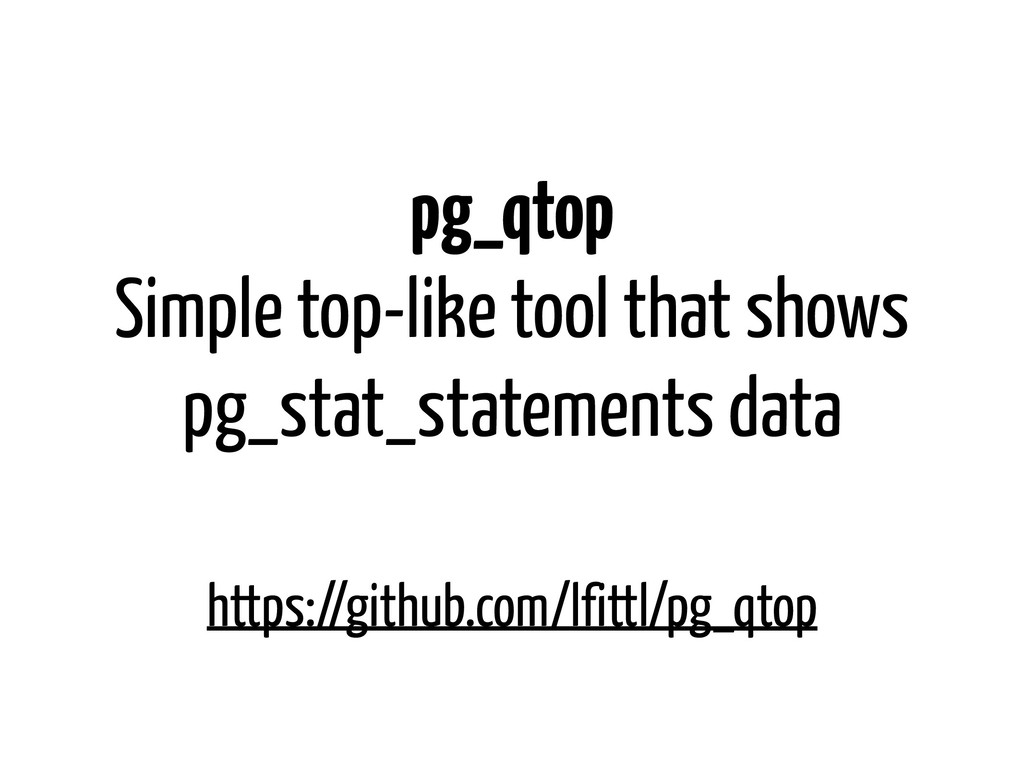
The talk will primarily describe free/open-source tools and statistics views readily available from within Postgres.

Citus Data

April 18, 2018
Tweet

More Decks by Citus Data

Other Decks in Technology

Transcript

  1. @LukasFittl Statistics That Matter Two Tables To Remember Breaking Down

    High-Level Statistics Log Events Worth Knowing Fingerprinting & Tracing Queries
  2. @LukasFittl Statistics That Matter Two Tables To Remember Breaking Down

    High-Level Statistics Log Events Worth Knowing Fingerprinting & Tracing Queries
  3. @LukasFittl Statistics Are Often Counters * except when reset /

    overrun Counts only go up*,
 calculate diffs!
  4. @LukasFittl pg_stat_user_tables relname: name of the table seq_scan: # of

    sequential scans idx_scan: # of index scans n_tup_(ins/del/upd): # of rows modified n_live_tup: live rows n_dead_tup: dead rows last_(auto)vacuum: last VACUUM last_(auto)analyze: last ANALYZE …
  5. @LukasFittl SELECT relname, n_live_tup, seq_scan + idx_scan, 100 * idx_scan

    / (seq_scan + idx_scan) FROM pg_stat_user_tables ORDER BY n_live_tup DESC Index Hit Rate Target: >= 95% on large, active tables
  6. @LukasFittl pg_statio_user_tables relname: name of the table heap_blks_read: blocks from

    disk / OS cache heap_blks_hit: blocks from buffer cache idx_blks_read: index blks from disk idx_blks_hit: index blks from buffer cache …
  7. @LukasFittl pg_stat_activity pid: process ID backend_type: “client backend” vs internal

    processes state: idle/active/idle in transaction state_change: time of state change query: current/last running query backend_start: process start time xact_start: TX start time query_start: query start time wait_event: what backend is waiting for (e.g. Lock, I/O, etc) …
  8. @LukasFittl Longest Running Query SELECT now() - query_start, query FROM

    pg_stat_activity
 WHERE state = ‘active’ ORDER BY 1 LIMIT 1
  9. 1. Install postgresql contrib package (if not installed) 2. Enable

    in postgresql.conf
 shared_preload_libraries = ‘pg_stat_statements’ 3. Restart your database 4. Create the extension
 CREATE EXTENSION pg_stat_statements; pg_stat_statements
  10. SELECT * FROM pg_stat_statements; userid | 10 dbid | 1397527

    query | SELECT * FROM x WHERE calls | 5 total_time | 15.249 rows | 0 shared_blks_hit | 451 shared_blks_read | 41 shared_blks_dirtied | 26 shared_blks_written | 0 local_blks_hit | 0 pg_stat_statements
  11. queryid | 1720234670 query | SELECT * FROM x WHERE

    y = ? calls | 5 total_time | 15.249 Query + No. of Calls + Avg Time
  12. shared_blks_hit | 2447215 shared_blks_read | 55335 Avg. Shared Buffer Hit

    Rate hit_rate = shared_blks_hit / (shared_blks_hit + shared_blks_read) 97.78% Cache Hit Rate
  13. AVG | QUERY -------------------------------------------------------------------------------- 10.7ms | SELECT oid, typname, typelem,

    typdelim, typinput FROM pg_type 3.0ms | SET time zone 'UTC' 0.4ms | SELECT a.attname, format_type(a.atttypid, a.atttypmod), pg_get_expr(d.adbin, d.adrelid), a.attnotnull, a.atttypid, a.atttypmod FROM pg_attribute a LEFT JOIN pg_attrdef d ON a.attrelid = d.adrelid AND a.attnum = d.adnum WHERE a.attrelid = ?::regclass AND a.attnum > ? AND NOT a.attisdropped ORDER BY a.attnum 0.2ms | SELECT pg_stat_statements_reset() 0.1ms | SELECT query, calls, total_time FROM pg_stat_statements 0.1ms | SELECT attr.attname FROM pg_attribute attr INNER JOIN pg_constraint cons ON attr.attrelid = cons.conrelid AND attr.attnum = cons.conkey[?] WHERE cons.contype = ? AND cons.conrelid = ?: :regclass 0.0ms | SELECT COUNT(*) FROM pg_class c LEFT JOIN pg_namespace n ON n.oid = c.relnamespace WHERE c.relkind in (?,?) AND c.relname = ? AND n.nspname = ANY (current_schemas(?)) 0.0ms | SELECT * FROM posts JOIN users ON (posts.author_id = users.id) WHERE users.login = ?; 0.0ms | SET client_min_messages TO 'panic' 0.0ms | set client_encoding to 'UTF8' 0.0ms | SHOW client_min_messages 0.0ms | SELECT * FROM ad_reels WHERE id = ?; 0.0ms | SELECT * FROM posts WHERE guid = ?; 0.0ms | SELECT ? 0.0ms | SET client_min_messages TO 'warning' 0.0ms | SET standard_conforming_strings = on 0.0ms | SELECT "posts".* FROM "posts" ORDER BY "posts"."id" DESC LIMIT ? 0.0ms | SHOW TIME ZONE pg_qtop -d testdb
  14. AVG | QUERY -------------------------------------------------------------------------------- 0.0ms | SELECT * FROM posts

    JOIN users ON (posts.author_id = users.id) WHERE users.login = ?; 0.0ms | SELECT * FROM posts WHERE guid = ?; 0.0ms | SELECT "posts".* FROM "posts" ORDER BY "posts"."id" DESC LIMIT ? pg_qtop -d testdb -t posts
  15. AVG | CALLS | HIT RATE | QUERY -------------------------------------------------------------------------------- 0.1ms

    | 1 | 100.0 | SELECT * FROM users; 0.1ms | 1 | - | SELECT * FROM databases; 0.0ms | 1 | - | SELECT * FROM invoices; 0.0ms | 1 | - | SELECT * FROM query_snapshots; pg_qtop -d testdb -s select
  16. @LukasFittl Lock Statistics pg_locks pid: process ID (JOIN to pg_stat_activity.pid!)

    locktype: type of object being locked mode: locking type (e.g. AccessExclusive) granted: Lock Granted vs Being Waited For …
  17. @LukasFittl Checkpoint Statistics pg_stat_bgwriter checkpoints_timed: # of scheduled checkpoints checkpoints_req:

    # of requested checkpoints 1. Time Between Checkpoints 2. % of Timed Checkpoints
  18. @LukasFittl autovacuum => SELECT pid, query FROM pg_stat_activity WHERE query

    LIKE 'autovacuum: %'; 10469 | autovacuum: VACUUM ANALYZE public.schema_columns 12848 | autovacuum: VACUUM public.replication_follower_stats 28626 | autovacuum: VACUUM public.schema_index_stats | (to prevent wraparound) (3 rows) pg_stat_activity
  19. @LukasFittl autovacuum pg_stat_progress_vacuum relid: OID of the table phase: current

    VACUUM phase heap_blks_total: Heap Blocks Total heap_blks_scanned: Heap Blocks Scanned heap_blks_vacuumed: Heap Blocks Vacuumed …
  20. @LukasFittl pg_stat_replication client_addr: ip address of the follower backend_start: replication

    start time state: replication state (ideally = streaming) replay_location: WAL location
  21. @LukasFittl Statistics That Matter Two Tables To Remember Breaking Down

    High-Level Statistics Log Events Worth Knowing Fingerprinting & Tracing Queries
  22. @LukasFittl pg_stat_activity - Number & State of Connections - Oldest

    Query Still Running - Oldest Transaction Still Open - Blocked Queries
  23. @LukasFittl pg_stat_database - Transactions Per Second - Data Read Per

    Second - Rows Updated/etc Per Second - Deadlocks Per Second - …
  24. @LukasFittl Statistics That Matter Two Tables To Remember Breaking Down

    High-Level Statistics Log Events Worth Knowing Fingerprinting & Tracing Queries
  25. @LukasFittl Statistics That Matter Two Tables To Remember Breaking Down

    High-Level Statistics Log Events Worth Knowing Fingerprinting & Tracing Queries
  26. @LukasFittl LOG: duration: 4079.697 ms execute <unnamed>: SELECT * FROM

    x WHERE y = $1 LIMIT $2 DETAIL: parameters: $1 = 'long string', $2 = ‘1' Slow Queries log_min_duration_statement = 1000 ms
  27. @LukasFittl Cancelled Queries ERROR: canceling statement due to statement timeout

    STATEMENT: SELECT 1 ERROR: canceling statement due to
 user request STATEMENT: SELECT 1 …
  28. @LukasFittl log_lock_waits = on LOG: process 20679 still waiting for

    ExclusiveLock on tuple (566,1) of relation 16421 after 1000.115 ms LOG: process 20678 still waiting for ExclusiveLock on tuple (566,1) of relation 16421 after 1000.126 ms LOG: process 15533 still waiting for ExclusiveLock on tuple (566,1) of relation 16421 1000.129 ms LOG: process 20663 still waiting for ExclusiveLock on tuple (566,1) of relation 16421 1000.100 ms LOG: process 15537 still waiting for ExclusiveLock on tuple (566,1) of relation 16421 1000.130 ms LOG: process 15536 still waiting for ExclusiveLock on tuple (566,1) of relation 16421 1000.222 ms LOG: process 20734 still waiting for ExclusiveLock on tuple (566,1) of relation 16421 1000.130 ms LOG: process 15538 still waiting for ExclusiveLock on tuple (566,1) of relation 16421 1000.136 ms LOG: process 15758 still waiting for ShareLock on transaction 250175899 after 1000.073 ms Lock Waits
  29. @LukasFittl archive_command Failures LOG: archive command failed with exit code

    1 DETAIL: The failed archive command was: /my_backup_script.sh pg_xlog/ 0000000100025DFA00000023
  30. @LukasFittl Out of Memory ERROR: out of memory DETAIL: Failed

    on request of size 408028. QUERY: SELECT 1 ...
  31. @LukasFittl Server Crash / Segfault LOG: server process (PID 660)

    was terminated by signal 6: Aborted DETAIL: Failed process was running: SELECT pg_advisory_lock(1, 2); LOG: terminating any other active server processes WARNING: terminating connection because of crash of another server process …
  32. @LukasFittl TXID Wraparound WARNING: database “mydb" must be vacuumed within

    938860 transactions HINT: To avoid a database shutdown, execute a full- database VACUUM in “mydb".
  33. @LukasFittl TXID Wraparound ERROR: database is not accepting commands to

    avoid wraparound data loss in database “mydb” HINT: Stop the postmaster and use a standalone backend to vacuum that database. You might also need to commit or roll back old prepared transactions.
  34. @LukasFittl Statistics That Matter Two Tables To Remember Breaking Down

    High-Level Statistics Log Events Worth Knowing Fingerprinting & Tracing Queries
  35. @LukasFittl SELECT a, b FROM public.test WHERE col = ‘value’

    SELECT a, b FROM public.test WHERE col = ‘other_value’ A B
  36. @LukasFittl SELECT a, b FROM public.test WHERE col = ?

    SELECT a, b FROM public.test WHERE col = ? A A
  37. @LukasFittl SELECT a, b FROM public.test WHERE col = ?

    SELECT a, b —— COMMENT FROM public.test WHERE col = ? A B
  38. @LukasFittl # SELECT queryid, query FROM pg_stat_statements; queryid | query

    ------------+---------------------------------------- 1115711211 | SELECT a, b FROM public.test WHERE col = $1 (1 row) pg_stat_statements
  39. @LukasFittl SELECT a, b FROM public.test WHERE col = ?

    SELECT a, b —— COMMENT FROM public.test WHERE col = ? A queryid = 1115711211 queryid = 1115711211 A
  40. @LukasFittl SELECT a, b FROM public.test WHERE col = ?

    SELECT b, a —— COMMENT FROM public.test WHERE col = ? A queryid = 1115711211 queryid = 2511327719 B
  41. @LukasFittl irb> PgQuery.fingerprint( ‘SELECT a, b FROM public.test WHERE col

    = $1’) => 0254f1e78f2d47b258d7b022f3dfa5794351a75128 pg_query
  42. @LukasFittl SELECT a, b FROM public.test WHERE col = ?

    SELECT b, a /* COMMENT */ FROM public.test WHERE col = ? A fingerprint = 0254f1e78f2d47b258d7b022f3dfa5794351a75128 fingerprint = 0254f1e78f2d47b258d7b022f3dfa5794351a75128 A
  43. @LukasFittl PgQuery.fingerprint - Based on Postgres Parsetree - Table names,

    not OIDs - Identical across servers
 & Postgres versions https://github.com/lfittl/libpg_query/wiki/Fingerprinting
  44. @LukasFittl application: pganalyze controller: graphql action: graphql line: /app/graphql/organization_type.rb …

    graphql: getOrganizationDetails.logVolume24h request_id: 44bd562e-0f53-453f-831f-498e61ab6db5
  45. @LukasFittl 3 Take-Aways 1. Collect Historic Metrics 2. Focus on

    Drill-Down To Query Level 3. Annotate Your Queries With Their Origin