Upgrade to Pro — share decks privately, control downloads, hide ads and more …

Q4 2025 Earnings release

Avatar for CMB.TECH CMB.TECH PRO
February 26, 2026

Q4 2025 Earnings release

Conference call to discuss the Q4 results.

Avatar for CMB.TECH

CMB.TECH PRO

February 26, 2026
Tweet

More Decks by CMB.TECH

Other Decks in Business

Transcript

  1. © 2026 – CMB.TECH Public presentation : do not replicate

    or distribute without the prior written permission of CMB.TECH Forward-looking statements Matters discussed in this presentation may constitute forward-looking statements under U.S. federal securities laws, including the Private Securities Litigation Reform Act of 1995. Forward-looking statements reflect the Company’s current views with respect to future events and financial performance and may include statements concerning plans, objectives, goals, strategies, future events or performance, and underlying assumptions and other statements, which are other than statements of historical facts. All statements, other than statements of historical facts, that address activities, events or developments that the Company expects, projects, believes or anticipates will or may occur in the future, including, without limitation, the delivery of vessels, the outlook for tanker shipping rates, general industry conditions future operating results of the Company’s vessels, capital expenditures, expansion and growth opportunities, bank borrowings, financing activities and other such matters, are forward-looking statements. Although the Company believes that its expectations stated in this presentation are based on reasonable assumptions, actual results may differ from those projected in the forward-looking statements. Important factors that, in our view, could cause actual results to differ materially from those discussed in the forward-looking statements include the failure of counterparties to fully perform their obligations to us, the strength of the world economies and currencies, general market conditions, including changes in tanker vessel charter hire rates and vessel values, changes in demand for tankers, changes in our vessel operating expenses, including dry-docking, crewing and insurance costs, or actions taken by regulatory authorities, ability of customers of our pools to perform their obligations under charter contracts on a timely basis, potential liability from future litigation, domestic and international political conditions, potential disruption of shipping routes due to accidents and political events or acts by terrorists. We undertake no obligation to publicly update or revise any forward- looking statement contained in this presentation, whether as a result of new information, future events or otherwise, except as required by law. In light of the risks, uncertainties and assumptions, the forward-looking events discussed in this presentation might not occur, and our actual results could differ materially from those anticipated in these forward-looking statements.
  2. 3 I. Q4 2025 financials & highlights II. Market update

    III. Conclusion and Q&A © 2026 – CMB.TECH Public presentation : do not replicate or distribute without the prior written permission of CMB.TECH Earnings conference call Q4 2025 CONTENT TOPICS
  3. © 2026 – CMB.TECH Public presentation : do not replicate

    or distribute without the prior written permission of CMB.TECH EIGHT VLCCS SOLD AT STELLAR PRICES FINANCIALS & HIGHLIGHTS
  4. © 2026 – CMB.TECH Public presentation : do not replicate

    or distribute without the prior written permission of CMB.TECH FLEET FINANCE LISTING 201 + 36 Modern Eco Vessels (1) $ 3.1 bn. Contract backlog (USD) (2) $ 10.7 bn. Fair Market Value(4) ~ 50% Through-out the cycle leverage target 152 55 30 5.9 Average age (excl. CTVs 10.4y) ~ $ 4.2 bn. Market Cap (3) $ 1.5 bn. CAPEX commitments (5) THE DIVERSIFIED AND FUTURE-PROOF MARITIME GROUP DRY BULK CRUDE TANKERS CONTAINER CHEMICAL OFFSHORE ENERGY OTHER 103 (+12) 22 (+5) 4 (+1) 8 (+8) 61 (+9) 3 (+1) 6.8 years Avg. age 6,329 FMV $ millions 7.7 years Avg. age 2,383 FMV $ millions 1.8 year Avg. age 412 FMV $ millions <1 year Avg. age 823 FMV $ millions <1 CSOV 10.4 CTV years avg. age 723 FMV $ millions <4.7 years Avg. age 16 FMV $ millions NH3 Notes: (1) Fleet on water + newbuilding orders as of 26/02/2026. (2) Contract backlog as of 31/12/2025 including subsequent acquisitions, fully owned vessels, and 100% of our JV owned 210,000 dwt Newcastlemax bulk carriers and Windcat FRS & TSM. The contract backlog excludes charterers’ extension options and purchase/cancellation options (if applicable). (3) Calculated based on the closing price of 25/02/2026, with 290,169,769 shares outstanding. (4) Brokerage quotes for January 2026 obtained from seven third-party broker companies (5) CAPEX on 31/01/2026 A leading diversified maritime group
  5. NET INCOME Q4 2025 financials EBITDA Q2 2025 Q3 2025

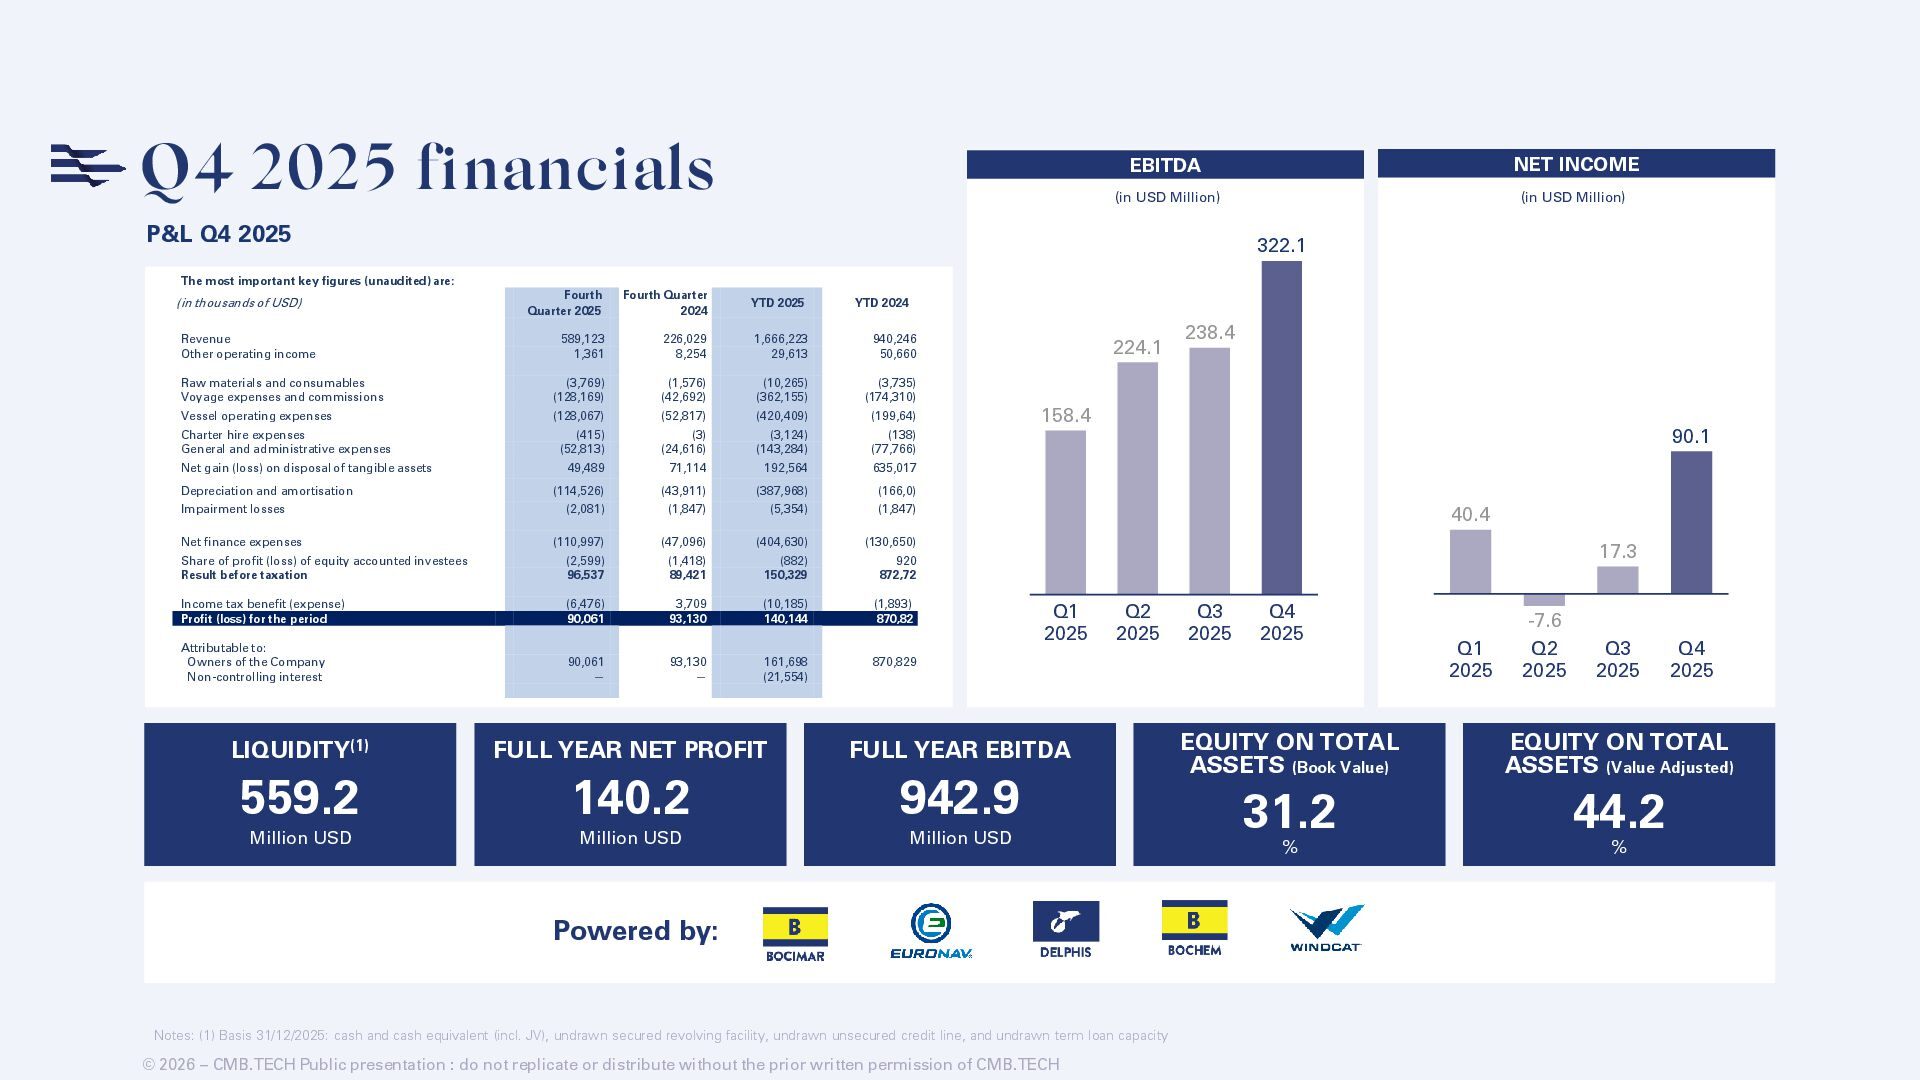
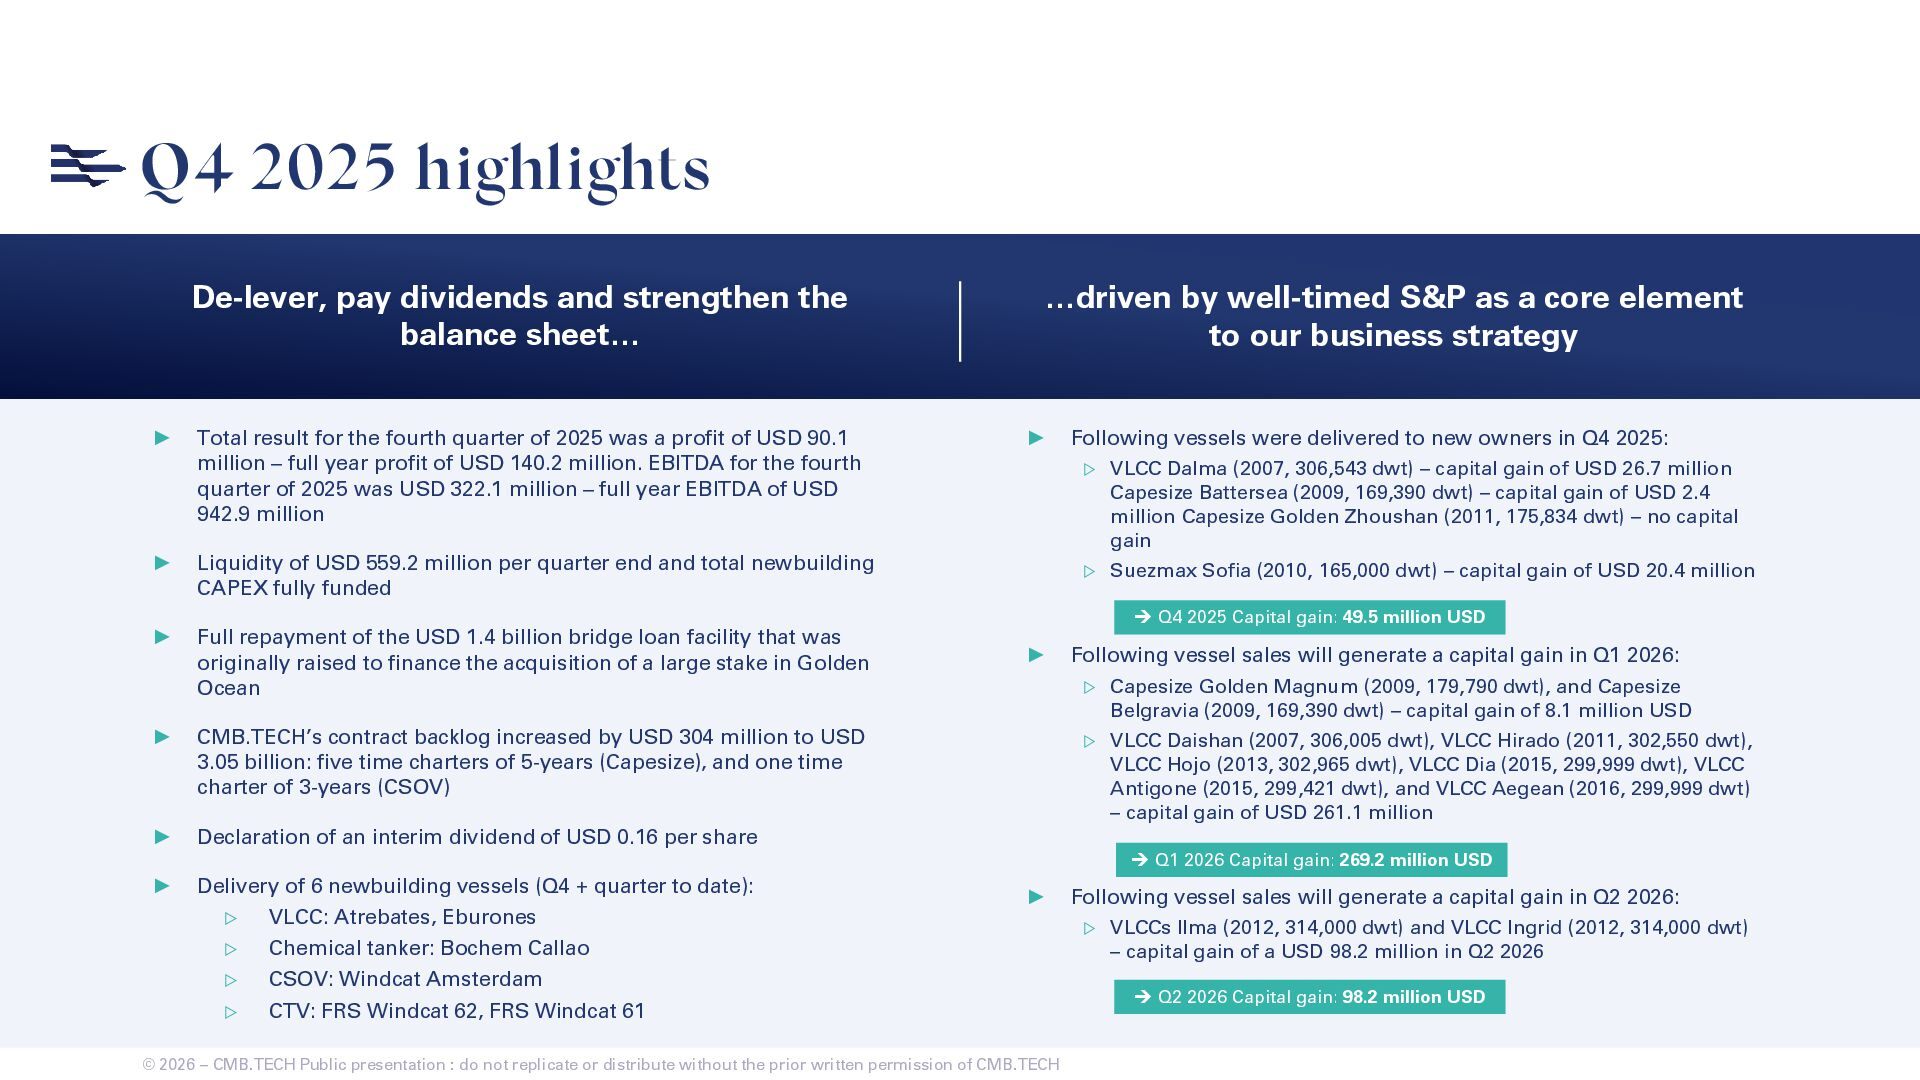
    Q4 2025 Q1 2025 224.1 238.4 322.1 158.4 Q2 2025 Q3 2025 Q4 2025 Q1 2025 -7.6 17.3 90.1 40.4 (in USD Million) (in USD Million) LIQUIDITY(1) 559.2 Million USD FULL YEAR NET PROFIT 140.2 Million USD FULL YEAR EBITDA 942.9 Million USD EQUITY ON TOTAL ASSETS (Book Value) 31.2 % © 2026 – CMB.TECH Public presentation : do not replicate or distribute without the prior written permission of CMB.TECH P&L Q4 2025 Powered by: EQUITY ON TOTAL ASSETS (Value Adjusted) 44.2 % The most important key figures (unaudited) are: (in thousands of USD) Fourth Quarter 2025 Fourth Quarter 2024 YTD 2025 YTD 2024 Revenue 589,123 226,029 1,666,223 940,246 Other operating income 1,361 8,254 29,613 50,660 Raw materials and consumables (3,769) (1,576) (10,265) (3,735) Voyage expenses and commissions (128,169) (42,692) (362,155) (174,310) Vessel operating expenses (128,067) (52,817) (420,409) (199,64) Charter hire expenses (415) (3) (3,124) (138) General and administrative expenses (52,813) (24,616) (143,284) (77,766) Net gain (loss) on disposal of tangible assets 49,489 71,114 192,564 635,017 Depreciation and amortisation (114,526) (43,911) (387,968) (166,0) Impairment losses (2,081) (1,847) (5,354) (1,847) Net finance expenses (110,997) (47,096) (404,630) (130,650) Share of profit (loss) of equity accounted investees (2,599) (1,418) (882) 920 Result before taxation 96,537 89,421 150,329 872,72 Income tax benefit (expense) (6,476) 3,709 (10,185) (1,893) Profit (loss) for the period 90,061 93,130 140,144 870,82 Attributable to: Owners of the Company 90,061 93,130 161,698 870,829 Non-controlling interest — — (21,554) Notes: (1) Basis 31/12/2025: cash and cash equivalent (incl. JV), undrawn secured revolving facility, undrawn unsecured credit line, and undrawn term loan capacity
  6. 7 Q4 2025 highlights Lorem ipsum dolor sit amet, consectetur

    adipiscing elit. Mauris mattis libero id felis rhoncus mattis. Orci varius natoque. © 2026 – CMB.TECH Public presentation : do not replicate or distribute without the prior written permission of CMB.TECH De-lever, pay dividends and strengthen the balance sheet… …driven by well-timed S&P as a core element to our business strategy ➔ Q4 2025 Capital gain: 49.5 million USD ➔ Q1 2026 Capital gain: 269.2 million USD ➔ Q2 2026 Capital gain: 98.2 million USD ► Total result for the fourth quarter of 2025 was a profit of USD 90.1 million – full year profit of USD 140.2 million. EBITDA for the fourth quarter of 2025 was USD 322.1 million – full year EBITDA of USD 942.9 million ► Liquidity of USD 559.2 million per quarter end and total newbuilding CAPEX fully funded ► Full repayment of the USD 1.4 billion bridge loan facility that was originally raised to finance the acquisition of a large stake in Golden Ocean ► CMB.TECH’s contract backlog increased by USD 304 million to USD 3.05 billion: five time charters of 5-years (Capesize), and one time charter of 3-years (CSOV) ► Declaration of an interim dividend of USD 0.16 per share ► Delivery of 6 newbuilding vessels (Q4 + quarter to date): ▷ VLCC: Atrebates, Eburones ▷ Chemical tanker: Bochem Callao ▷ CSOV: Windcat Amsterdam ▷ CTV: FRS Windcat 62, FRS Windcat 61 ► Following vessels were delivered to new owners in Q4 2025: ▷ VLCC Dalma (2007, 306,543 dwt) – capital gain of USD 26.7 million Capesize Battersea (2009, 169,390 dwt) – capital gain of USD 2.4 million Capesize Golden Zhoushan (2011, 175,834 dwt) – no capital gain ▷ Suezmax Sofia (2010, 165,000 dwt) – capital gain of USD 20.4 million ► Following vessel sales will generate a capital gain in Q1 2026: ▷ Capesize Golden Magnum (2009, 179,790 dwt), and Capesize Belgravia (2009, 169,390 dwt) – capital gain of 8.1 million USD ▷ VLCC Daishan (2007, 306,005 dwt), VLCC Hirado (2011, 302,550 dwt), VLCC Hojo (2013, 302,965 dwt), VLCC Dia (2015, 299,999 dwt), VLCC Antigone (2015, 299,421 dwt), and VLCC Aegean (2016, 299,999 dwt) – capital gain of USD 261.1 million ► Following vessel sales will generate a capital gain in Q2 2026: ▷ VLCCs Ilma (2012, 314,000 dwt) and VLCC Ingrid (2012, 314,000 dwt) – capital gain of a USD 98.2 million in Q2 2026
  7. © 2026 – CMB.TECH Public presentation : do not replicate

    or distribute without the prior written permission of CMB.TECH ASSUMPTIONS: Estimation of available days basis fleet on 26/02/2026, basis current time charter contracts and new building delivery schedule as per 26/02/2026. Spot days and Time Charter (TC) days provide the total available days (excluding all confirmed 2026 vessel sales) - aligned with newbuilding delivery schedules. Excluded is the other category: CTV’s, 5,000 DWT coasters, ferry, tugboat, MPHUV. Source: Clarksons SIN, Company Information. Largest spot exposure to Dry-Bulk (& Crude Tankers) 38,531 9,017 1,522 3,012 1,175 Time Charter 82.2% Spot 17.8% 2026 53,257 DAYS 2027 58,869 DAYS 2028 60,323 DAYS 2026 SPOT VERSUS TIME CHARTER 2026 TOTAL AVAILABLE DAYS WHY THE LARGE SPOT EXPOSURE IN DRY BULK AND CRUDE TANKERS? 50 0 10 15 20 25 30 35 40 45 % OB/F Q4 2024 Q1 2025 Q2 2025 Q3 2025 Q4 2025 Q1 2026 LNG Containership Product Tanker Chemical Tanker LPG Panamax VLCC Capesize Suezmax 82.8% Dry-Bulk 13.6% Tanker 3.6% Other 82.8% of total spot exposure is dry-bulk (36,261 days) = 43,794 days! TC Spot
  8. © 2026 – CMB.TECH Public presentation : do not replicate

    or distribute without the prior written permission of CMB.TECH Strategic CAPEX program fueling future earnings Q1 2026 Q2 2026 Q3 2026 Q4 2026 Q1 2027 Q2 2027 Q3 2027 Q4 2027 Q1 2028 Q2 2028 Q3 2028 Q4 2028 Q1 2029 Q2 2029 168 272 182 279 222 36 66 11 48 49 39 34 43 37 Bocimar Euronav Delphis Bochem Windcat 2 X SUEZMAX 3 X VLCC 10 X NEWCASTLEMAX 2 X 5.000 DWT COASTERS 1 X 1400 TEU 6 X 25K DWT CHEMICAL 2 X 17K DWT BITUMEN 5 X CSOV (XL) 4 X CTV CAPEX PROGRAM (1) Committed financing 1.27 Billion USD Unfunded CAPEX 216 Million USD 2026: 154 m$ 2027: 54 m$ 2028: 7 m$ Outstanding CAPEX 1.49 Billion USD Remaining capex expected to be fully funded through vessel sales(2) and cash flow from operations ASSUMPTIONS: (1) As per 02/02/2026. (2) MoA in place for multiple vessels. UPDATE 31/01/2026 Million USD
  9. © 2026 – CMB.TECH Public presentation : do not replicate

    or distribute without the prior written permission of CMB.TECH ASSUMPTIONS: Estimated cash break-even – based on FY 2026 combined available days (confirmed vessel sales have been removed), Time Charter agreements as per contract backlog February 2026, Excluding other category (CTV, Tugboat & Ferries), Forecasted scenario based on management assumptions and market reports, Excluding NB CAPEX commitments, and Excluding vessel sales. SPOT RATES IN USD/DAY: 2026 estimated free cash flow CMBT VLCC Spot Suezmax Spot Nuke Spot Cape Spot Kamsar/ Panamax Spot Estimated rates FY26 65,000 45,000 33,465 26,350 14,750 +10% 71,500 49,500 36,811 28,985 16,225 +20% 78,000 54,000 40,157 31,620 17,700 ESTIMATED FCF % PER DIVISION FY2026 50 100 150 200 250 300 350 400 450 500 550 600 650 700 750 0 VLCC Suezmax Nuke Cape Kamsarmax Chemical Container CSOV Total FCF 53.6 Million USD 70.1 120.3 140.0 159.8 95.9 142.8 189.6 113.6 146.1 178.5 22.6 35.0 47.5 6.5 8.1 9.7 16.6 16.6 16.6 23.4 27.7 32.0 452.5 578.2 703.9 61.9 Today FY 2026 10% 20% Tanker 51.3% 38.4% 10.3% Other Dry-Bulk
  10. DRY BULK TANKERS CONTAINER CHEMICAL OFFSHORE ENERGY Demand side ▸

    Tonne-mile iron ore: +2.0% in 2026 +2.7% in 2027 ▸ Tonne-mile bauxite: + 2.4 % in 2026 ▸ Tonne-mile crude oil: +0.6% in 2026 +1.4% in 2027 ▸ World oil demand (IEA): +700 kb/d in 2026 +700 kb/d in 2027 ▸ TEU-mile: -0.6% in 2026 -6.0% in 2027 ▸ Tonne-mile chemicals: +0.8% in 2026 +0.9% in 2027 ▸ Global GDP growth adjusted for tariffs effect: +3.0% in 2025 +3.1% in 2026 ▸ Over the next two years (2026-2027), an average of 19GW of capacity per year is scheduled to be completed ▸ Increased demand from the oil and gas side of the industry is noticeable Supply side ▸ OB/F far below historic averages for Capesize 12.4% ▸ Capesize 2026 fleet growth 2.3% versus Capesize trade growth of 3.2% ▸ 36% Capes > 15 years ▸ OB/F VLCC 18.8%, Suezmax 22.1% ▸ 2026 crude fleet growth of 2.8% versus crude tanker dwt demand growth of 0.9% ▸ 18% of the VLCC & 20% Suezmax fleet > 20 years ▸ The boxship fleet will grow by 4.3% in 2026, and 6.3% in 2027 ▸ Historically high OB/F: 34.0% in January (average over all sizes) ▸ Red Sea rerouting (~12%) ▸ OB/F ratio at 18.8% ▸ 26.0% > 20 years ▸ Product tanker tonnage as swing factor ▸ CTV fleet stands at 731 units versus an orderbook of 101 units (OB/F 13.8%) ▸ CSOV fleet stands at 71 units versus an orderbook of 50 units (OB/F 70.4%) Supply / Demand balance 2026 POSITIVE POSITIVE CAUTIOUS CAUTIOUS POSITIVE Commercial exposure on the water Spot: 87 (+ 9NB) Time Charter: 16 (+3NB) Spot: 12 (+3NB) Time Charter: 10 (+2NB) Spot: 0 Time Charter: 4 (+1NB) Spot: 2 Time Charter: 6 (+8NB) CTV Spot: 4 (+4NB) CTV Time Charter: 55 CSOV Spot: 0 (+4NB) CSOV Short TC: 2 (+1NB) Market fundamentals remain intact © 2026 – CMB.TECH Public presentation : do not replicate or distribute without the prior written permission of CMB.TECH Source: Clarksons SIN, IMF, AXS Marine, Morgan Stanley, BRS, Bloomberg Intelligence
  11. © 2026 – CMB.TECH Public presentation : do not replicate

    or distribute without the prior written permission of CMB.TECH ▸36 Newcastlemaxes on the water (average age of 3.2y) with another 10 Newcastlemaxes to be delivered by Q1 2027 ▸Q4 2025 TCE actuals at 34,886 USD/day, outperforming 5TC BCI by 7,455 USD/day net of commissions ▸Q1 2026 TCE quarter to date rates at 30,673 USD/day (80% fixed) ▸ Time Charter: 21,284 USD/day (5 vessels, latest redelivery 30/04) Source: Own data representation based on Clarksons Research, Breakwave Advisors, AXS Marine, Bloomberg China steel mill utilisation China steel inventories China iron ore inventories China iron ore imports China coal imports Brazil iron ore exports Australia iron ore exports >90% -32.5% +10.3% +1.8% -9.6% +7.1% +2.0% Dry bulk fleet supply +3.1% DRY BULK SEABORNE TRADE IS STILL GROWING YoY (mid February 2026) P&L break-even 34,886 TCE Q4 ’25 7,039 Q1 ’26 TCE-to-date 30,673 25,499 OPEX +9,387 KEY HIGHLIGHTS Q4 2025 SPOT PERFORMANCE ( $ per vessel per day) Q1 ’26 TCE-to-date 21,271 TCE Q4 ’25 P&L break-even 7,113 OPEX 30,137 26,725 +8,866 P&L break-even 17,337 TCE Q4 ’25 6,307 Q1 ’26 TCE-to-date 13,279 14,146 OPEX +3,191 China soybean imports +6.5% TCE CALCULATIONS: Budget P&L break-even for 2026: includes OPEX, insurance, ship mgt fees, depreciation, interests, special expenses, arrangement fees & pool fees. OPEX as per 2026 budget ▸37 Capesize vessels on the water (average age of 11.2y) ▸Q4 2025 TCE actuals at 30,137 USD/day, outperforming 5TC BCI by 2,706 USD/day net of commissions ▸Q1 2026 TCE quarter to date rates at 26,725 USD/day (72% fixed) ▸CMB.TECH has sold the Golden Magnum (2009, 179,790 dwt) and Belgravia (2009, 169,390 dwt) – Q1 capital gain of 8.1 million USD ▸30 Kamsarmax/Panamax vessels on the water ▸Q4 2025 TCE actuals at 17,337 USD/day, outperforming 5TC BPI- 82 by 2,109 USD/day basis net of commissions ▸Q1 2026 TCE quarter to date rates at 13,279 USD/day (66% fixed) ▸Time Charter: 13,207 USD/day (8 vessels with redelivery Q2/Q3 2026) Dry bulk
  12. © 2026 – CMB.TECH Public presentation : do not replicate

    or distribute without the prior written permission of CMB.TECH Source: Own data representation based on: Clarksons SIN, AXS Marine Capesize entails most favourable OB/F ratio and hence vessel values are supported going forward 42 106 212 98 115 14 59 76 75 75 0 10 20 30 40 50 60 70 80 90 100 100 150 250 300 350 400 50 # Mio USD 200020012002200320042005 68 2006 400 97 2007 200920102011201220132014201520162017201820192020202120222023202420252026 2008 Cape NB ordering Cape NB value 760# 278# 177# 206# ?? CAPESIZE ORDERING CYCLE VERSUS NEW BUILDING VESSEL VALUE NB VERSUS AGE PROFILE Total NB: 484 # OB/F: 15.2 % Total NB: 233 # OB/F: 12.4 % 902 > 15 years 508 > 20 years 587 > 15 years 147 > 20 years CAPE ‘BALANCE’ PANAMAX ‘BALANCE’ ??
  13. Q4/Q1 – Continued strength of iron ore and bauxite further

    supported by opposite seasonal patterns between Atlantic/Pacific and West-Africa © 2026 – CMB.TECH Public presentation : do not replicate or distribute without the prior written permission of CMB.TECH ATLANTIC Source: Own data representation based on: AXS Marine Atlantic/West-Africa/Pacific Iron Monitor and Weather Dashboards, Clarksons WEST-AFRICA PACIFIC -22.3% +18.8% +44.2% 15 days precipitation accumulation (mm) 15 days average loading rate (‘000 tons per day) Feb ‘25 Feb ‘26 Aug ‘25 Feb ‘25 Feb ‘26 Aug ‘25 Feb ‘25 Feb ‘26 Aug ‘25 ▸ Bauxite has become an increasingly important cargo stream for Capesize vessels (roughly 16% of Capesize tonne-mile demand, 91% shipped to China). Strong Q1 volumes offsetting seasonal weakness in iron ore (expected Q1 +3 MMT y-o-y). Counter seasonal support should increase further with the 2026 ramp-up of the Simandou iron ore mine and the expansion of South Buchanan mine in Liberia ▸ Potential seasonal moderation for end Q1 (cfr. Chinese NY and Atlantic/Pacific weather patterns) – albeit dry bulk has started Q1 in good shape, supported by limited weather disruption to Australian iron ore (January 2026 Port Hedland iron ore export at 49.2 MMT, or +7% y-o-y) and broadly strong volumes across cargo types (iron ore, bauxite, grain). Atlantic rains are lower compared to last year, but volumes decreased in Jan and more rains expected end of Feb.
  14. © 2026 – CMB.TECH Public presentation : do not replicate

    or distribute without the prior written permission of CMB.TECH SUPPLY – MILLION DWT & % Favourable Capesize market fundamentals for 2026 driven by increased ton-mile trade and limited newbuilding deliveries Source: Own data representation based on: S&P Global Energy Dry Bulk Freight Rate Forecast Outlook Report, Clarkson SIN. (1) CMBT premium using company estimates based on historic performance (10.2% basis net-net) DEMAND – BN TON-MILES S&P 2026 UTILISATION & RATE FORECAST 91.3% 2025 23,202 91.8% 2026e 23,603 92.0% 88.9% 2027e 2024 90.0% 2023 25,569 26,011 16,735 22,459 20,716 +0.5% Capesize C5TC Fleet utilization CMBT Premium 10,500 11,000 11,500 12,000 12,500 13,000 13,500 14,000 14,500 15,000 15,500 0.0 0.1 0.2 0.3 0.4 0.5 10,000 0.7 0.8 0.9 1.0 0.6 2024 2026e 2025 2023 12,603 13,158 13,550 13,918 +368 (+2.7%) Bn Ton-Miles 2023 2024 2025 2026e Capacity at the start of the year 385.4 394.1 401.1 407.5 Delivery 10.7 7.7 7.7 10.8 Deletion -2 -0.7 -1.3 -1.5 Fleet Supply 394.1 401.1 407.5 416.8 Fleet growth (%) 2.30% 1.80% 1.60% 2.30% ▸ Capesize trade is forecast to grow 3.2% y/y FY26 ▸ Capesize segment is forecast to continue losing coal shipments (-9%, -22MT) to the Panamax segment ▸ Iron ore (+3.2%, +51MMT) and bauxite shipments (+4.3%, +8MMT) would remain key drivers of global Capesize ton-miles demand ▸ Supply is forecast to grow 2.3% y/y FY26 ▸ Attractive OB/F ratio and limited yard capacity ▸ Multi-year high average age of 11.99 years (highest since 1993) ▸ Dry docking congestion due to third special survey (465 Capes in 26/27 = ~2% p.a. ) (1) + = © 2026 – CMB.TECH Public presentation : do not replicate or distribute without the prior written permission of CMB.TECH
  15. © 2026 – CMB.TECH Public presentation : do not replicate

    or distribute without the prior written permission of CMB.TECH Potential market movers to track in 2026 Source: Own data representation based on: S&P Global Energy Dry Bulk Freight Rate Forecast Outlook Report LONG-HAUL SEABORNE IRON ORE TRADE GROWTH (MMT) - EXPORT LONG-HAUL SEABORNE BAUXITE TRADE GROWTH (MMT) - EXPORT 41 416 973 300 28 63 429 980 306 18 95 440 986 310 15 Global Others 1,845 1,796 1,760 Brazil Australia India West Africa +22 (+53.7%) +13 (+3.1%) +7 (+0.7%) +6 (+2.0%) -10 (-35.7%) +36 (+2.0%) 2025 2026e 2027e ▸ Most significant upside is anticipated to shipments from Brazil and West Africa (Simandou). This in turn is expected to support ton-miles and Capesize demand ▸ New long-haul volumes from South Buchanan in West Africa ▸ Substitution of low quality Chinese domestic ore ▸ Slowdown in higher cost producers of iron ore: Iran (3MMT @ CFR 120 $/t), India (13MMT @ CFR 83-119 $/t), Ukraine (13 MMT @ CFR 114$/t), Sierra Leone (7.5 MMT @ CFR 74-106 $/t), Australia (56 MMT @ CFR 79-98$/t) 181 50 16 248 184 51 20 254 187 51 20 257 Global Guinea Others Australia +3 (+1.7%) +1 (+2.0%) +4 (+25.0%) +6 (+2.4%) 2025 2026e 2027e ▸ Bauxite imports into Mainland China forecast to grow y/y supported by domestic stimulus measures and growing automotive exports ▸ Most of the additional tons of bauxite are coming from Guinea contributing majorly to ton-mile demand for the Capesize segment. Albeit,moderation in 2026 (+6MMT, 2.4%) after stellar 2025 (+25% growth (36MMT))
  16. © 2026 – CMB.TECH Public presentation : do not replicate

    or distribute without the prior written permission of CMB.TECH Tankers ▸VLCC trading fleet of 3 VLCCs with 3 x ECO VLCC on order ▸Actual Q4 TCE for VLCC of 74,842 USD/day ▸Actual Q1 2026 quarter-to-date of 74,465 USD/day (78% fixed) ▸Sale of eight VLCCS: Daishan (2007, 306,005 dwt), Hirado (2011, 302,550 dwt), Hojo (2013, 302,965 dwt), Dia (2015, 299,999 dwt), Antigone (2015, 299,421 dwt), Aegean (2016, 299,999 dwt), Ilma (2012, 314,000 dwt) and Ingrid (2012, 314,000 dwt) – Q1 capital gain of 261.1 million USD, and Q2 capital gain of 98.2 million USD Q4 2025 PERFORMANCE ( $ per vessel per day) Source: Own data representation based on: Breakwave Advisors, AXS Marine World Oil Demand 2025 Oil Supply, OPEC Oil Supply, non-OPEC OECD Total Crude Oil Stocks US Crude Oil Exports China Oil Imports Global Crude Oil on Water +1.4% +6.7% +1.2% +4.5% -3.7% +4.6% +18.6% YoY (mid February 2026) Tanker Fleet Supply +2.3% CRUDE OIL DEMAND GROWING BUT SLOWER Q1 ’26 TCE-to-date 25,133 TCE Q4 ’25 P&L break-even 9,232 OPEX 74,842 74,465 +49,709 Q1 ’26 TCE-to-date 24,421 TCE Q4 ’25 P&L break-even 9,491 OPEX 64,543 61,809 +40,122 9,232 Time Charter Q4 ’25 P&L break-even 25,133 45,582 OPEX +20,449 9,491 Time Charter Q4 ’25 P&L break-even 24,421 33,613 OPEX +9,192 Tankers TCE CALCULATIONS: Budget P&L break-even for 2026: includes OPEX, insurance, ship mgt fees, depreciation, interests, special expenses, arrangement fees & pool fees. OPEX as per 2026 budget ▸Suezmax trading fleet of 17 Suezmax vessels on the water with 2 x ECO Suezmax on order ▸Actual Q4 TCE for Suezmax of 64,543 USD/day ▸Actual Q1 2026 quarter-to-date of 61,809 USD/day (87% fixed) KEY HIGHLIGHTS
  17. © 2026 – CMB.TECH Public presentation : do not replicate

    or distribute without the prior written permission of CMB.TECH Source: Own data representation based on: Clarksons SIN, AXS Marine Sustainability of the expanding crude tanker orderbook will depend on demand durability and potential uptick in scrapping 90 110 85 105 0 10 20 30 40 50 60 70 80 90 100 110 20 60 100 140 180 220 260 300 340 Mio USD 2000 2001 2002 2003 2004 2005 96 2006 2007 2008 2009 2010 2011 2012 2013 2014 2015 2016 2017 2018 2019 2020 2021 2022 2023 # 90 2025 2026 52 164 2024 151 85 122 171 65 106 Suezmax (Dwt 120-200k) VLCC (Dwt 200k+) VLCC 10 year 473# 443# 228# 216# ?? CRUDE TANKER ORDERING (VLCCs & SUEZMAX) VERSUS VESSEL VALUE NB VERSUS AGE PROFILE Total NB: 201 # OB/F: 18.8 % Total NB: 165 # OB/F: 22.1 % 160 # > 20 years 142 # > 20 years SUEZMAX ‘BALANCE’ VLCC ‘BALANCE’
  18. © 2026 – CMB.TECH Public presentation : do not replicate

    or distribute without the prior written permission of CMB.TECH Source: Own data representation based on: IEA, OPEC, EIA, Bloomberg, Morgan Stanley Crude Tanker demand durability for the time being still driven by China imports (stock building) AMPLE CRUDE OIL AVAILABLE IN 2026 EIA OPEC 0.87 2.45 4.00 IEA 1.26 2.30 1.38 1.87 0.00 1.23 Oil demand growth (mbpd) Oil Supply growth (mbpd) Implied balance (mbpd) ▸Surplus of 4.0 mbpd ▸Oil prices likely well below $60/bbl ▸Forward curve flips into pronounced contango ▸Surplus of 2.3 mbpd ▸Prices hover around $60/bbl ▸Further downside risk if Chinese stock-building slows/stops ▸No surplus, near-equilibrium ▸Potential price breakout from downtrend later in H2 2026 – except if China starts unwinding stock DEMAND DRIVEN BY CHINA OIL IMPORT ? Chinese strategic stock-building continues --- OPEC+ may need significant cuts to defend $60 Chinese strategic stock-building potentially slows/stops --- OPEC+ may need small cuts to defend $60 Chinese strategic stock-building could be used to control oil price --- No OPEC+ cuts required China building its crude inventories at about 1 mb/d starting in 2Q25 0 50 100 150 200 250 300 2019 2020 2021 2022 2023 2024 2025 Implied by Flows (mln bbl) China’s December 2025 arrivals/imports reached the second highest volume in the dataset since 2016
  19. © 2026 – CMB.TECH Public presentation : do not replicate

    or distribute without the prior written permission of CMB.TECH CHINA CRUDE IMPORTS Source: Own data representation based on: Bloomberg, Goldman Sachs, BRS, Arctic Sanctions remain a theme for crude tankers in 2026 and could become the catalyst for scrapping going forward ▸Russia–Ukraine conflict: No peace deal in sight. Oil output resilience is under pressure, with November production ~500 kbpd below OPEC+ target and exports at their lowest since 2022. Indian imports of Russian crude are reported to be down by as much as 50%, or about 1 mbd – however China is increasing Russian oil import since Jan 2026 ▸Iran unrest: Largest uprising since 2022 amid severe economic stress, risks to oil flows if violence spreads to energy hubs, but a Western-aligned transition could eventually lift sanctions and boost investment. Iran's oil exports have been hovering near the 2 mbd level in (drop to 1.5 mbd in December and early January) ▸Middle East volatility: Red Sea trade routes normalisation – gradual process with December 2025 up 33% y-o-y (still 60% down compared to pre-Red Sea rerouting) ▸Venezuela uncertainty: U.S. raid on Maduro sparks political flux, near-term impact mainly trade-flow shifts, but sanctions relief could unlock 500–600 kbpd within a year and more over 2–5 years with heavy capex (production declined by 1.5mb/d to 0.9mb/d over the last 10 years of Maduro Presidency whilst having 1/5 of global proven oil reserves) GEOPOLITICAL COMPLEXITIES ▸China currently absorbs ~3.6 mbpd of sanctioned barrels ▸China’s appetite for sanctioned barrels remains high in Q1 2026 (cfr. India’s reduction of Russian oil is being replaced by increased import of Russian oil by China) India Crude and Condensate Imports by Origin mb/d mb/d China Crude and Condensate Imports by Origin mb/d mb/d SWING FACTORS
  20. © 2026 – CMB.TECH Public presentation : do not replicate

    or distribute without the prior written permission of CMB.TECH ▸4 x super-eco 6,000 TEU ice class container feeder vessels on the water – all operational under a 10-year time charter contract to CMA CGM ▸1 x 1,400 TEU dual fuel NH3 on order to be delivered in October 2026 (Qingdao Yangfan Shipbuilding) – under 15-year time charter contract ▸Container charter rates remain supported, but cyclical risks are rising. Spot rates are moderating with pre–Lunar New Year demand pushing the SCFI just above 1,250 – significantly below the elevated 2024 average and 5-year average ▸Medium-term outlook softens further as supply growth outpaces demand, and Red Sea re- routing poised to gradually normalise Source: Own data representation based on Clarksons, Jefferies SCFI EVOLUTION 500 1.500 2.500 3.500 4.500 0 SCFI Q1-2020 Q2-2020 Q3-2020 Q4-2020 Q1-2021 Q2-2021 Q3-2021 Q4-2021 Q1-2022 Q3-2022 Q4-2022 Q1-2023 Q2-2023 Q3-2023 Q4-2023 Q1-2024 Q2-2024 Q3-2024 Q4-2024 Q1-2025 Q2-2025 Q3-2025 Q4-2025 Mid Feb Q2-2022 SCFI Comprehensive Container Freight Rate Index 5-year average 6,760 19,842 29,378 OPEX P&L break-even Time Charter Q4 ’25 +9,536 Containers Delphis has no spot exposure TCE CALCULATIONS: Budget P&L break-even for 2026: includes OPEX, insurance, ship mgt fees, depreciation, interests, special expenses, arrangement fees & pool fees. OPEX as per 2026 budget KEY HIGHLIGHTS Q4 2025 PERFORMANCE ( $ per vessel per day)
  21. © 2026 – CMB.TECH Public presentation : do not replicate

    or distribute without the prior written permission of CMB.TECH ▸Trading fleet of 8 chemical tankers on the water ▸Favorable long-term contract exposure: 2 x Pool, 6 x 10-year TC, 6 x 7-year TC ▸Newbuilding orderbook: ▸2 x product tankers (CH₃OH fitted): 2026 ▸4 x chemical tankers (NH3 ready): 2028 and 2 x chemical tankers (NH3 fitted): 2029 5.000 10.000 15.000 20.000 25.000 0 Q2- 2021 Q3- 2021 Q4- 2021 Q1- 2022 Q2- 2022 Q3- 2022 Q4- 2022 Q1- 2023 Q3- 2023 Q4- 2023 Q1- 2024 Q2- 2024 Q3- 2024 Q4- 2024 Q1- 2025 Q2- 2025 Q3- 2025 Q4- 2025 Mid Feb USD/day Q1- 2020 Q2- 2020 Q3- 2020 Q4- 2020 Q1- 2021 Q2- 2023 12,5% -18,3% 1 Year TC 19,999 dwt Stainless Steel 10 year avaerage 7,663 18,164 20,887 17,878 OPEX P&L break-even TCE Q4 ’25 Q1 ’26 TCE-to-date +2,723 7,663 18,164 19,306 OPEX P&L break-even Time Charter Q4 ’25 +1,142 Bochem has only limited spot exposure Source: Own data representation based on Clarksons Pool Time Charter Chemical Q4 2025 PERFORMANCE ( $ per vessel per day) ▸Current spot rates for chemical tankers remain 15–20% below last year’s exceptionally high levels – albeit still ~12.5% above the 5-year historical mean ▸Chemical tanker markets are gradually softening from 2024’s strong levels, with Q4 2025 seaborne trade turning slightly negative as tariff volatility dampened arbitrage and demand growth remained closely tied to global GDP ▸Supply risks rise into 2026, as fleet growth accelerates (OB/F 18.8%) TCE CALCULATIONS: Budget P&L break-even for 2026: includes OPEX, insurance, ship mgt fees, depreciation, interests, special expenses, arrangement fees & pool fees. OPEX as per 2026 budget KEY HIGHLIGHTS
  22. © 2026 – CMB.TECH Public presentation : do not replicate

    or distribute without the prior written permission of CMB.TECH ▸Windcat has 59 CTVs on the water, 4 additional CTVs on order ▸Windcat CTV market operates mainly under short term time charter contracts (3 months up to 5 years) ▸CTV utilisation remained high entering Q4 2025, though normal seasonal ‘winter’ slowdown led to the redelivery of several smaller CTVs with spot activity limited to minor crew-change and cargo-transfer work ▸For Q4 2025, Windcat CTV achieved a utilisation of 75.8% with a TCE of 2,883 USD/day. Q1 TCE forecast of 2,472 USD/day (68.8% utilisation) Q1 ’26 TCE-to-date 1,949 TCE Q4 ’25 P&L break-even 1,553 OPEX 2,883 2,472 +934 Q1 ’26 TCE-to-date 33,528 TCE Q4 ’25 P&L break-even 15,107 OPEX 108,046 69,900 +74,518 Source: Own data, Clarksons Q4 2025 PERFORMANCE ( $ per vessel per day) Offshore wind, oil & gas ▸Windcat took delivery of CSOV Windcat Amsterdam ▸Time charter agreements extended and new 3-year time charter agreement signed ▸Still four CSOVs and one CSOV XL on order ▸Generally, increased demand from the oil and gas side of the industry is noticeable, and it is expected that more CSOV tonnage will be absorbed outside offshore wind projects going forward. This will partly occur in other geographical regions (outside of EU market) ▸For Q4 2025, Windcat CSOVs achieved a TCE of 108,045 USD/day. Q1 TCE forecast at 69,900 USD/day (50%utilisation) TCE CALCULATIONS: Budget P&L break-even for 2026: includes OPEX, insurance, ship mgt fees, depreciation, interests, special expenses, arrangement fees & pool fees. OPEX as per 2026 budget, CSOV at 85% utilization KEY HIGHLIGHTS
  23. 30 ► If you would like to ask a question,

    please raise your hand ► Introduce yourself & unmute before asking your question ► If you can’t unmute, please use the Q&A section to ask your question ► For telephone participants, please type *5 to raise your hand and *6 to unmute ► If you have any follow-up questions, please send an e-mail to [email protected] Q&A