Upgrade to Pro — share decks privately, control downloads, hide ads and more …

CMB.TECH earnings call Q1 2026

Sponsored · Ship Features Fearlessly Turn features on and off without deploys. Used by thousands of Ruby developers.

CMB.TECH earnings call Q1 2026

Avatar for CMB.TECH

CMB.TECH PRO

May 20, 2026

More Decks by CMB.TECH

Other Decks in Business

Transcript

  1. Decarbonise Today Navigate Tomorrow Earnings conference call Q1 2026 19

    MAY 2026 ALEXANDER SAVERYS & LUDOVIC SAVERYS P R E S E N T E R
  2. 2 © 2026 – CMB.TECH Public presentation : do not

    replicate or distribute without the prior written permission of CMB.TECH Forward-looking statements Matters discussed in this presentation may constitute forward-looking statements under U.S. federal securities laws, including the Private Securities Litigation Reform Act of 1995. Forward-looking statements reflect the Company’s current views with respect to future events and financial performance and may include statements concerning plans, objectives, goals, strategies, future events or performance, and underlying assumptions and other statements, which are other than statements of historical facts. All statements, other than statements of historical facts, that address activities, events or developments that the Company expects, projects, believes or anticipates will or may occur in the future, including, without limitation, the delivery of vessels, the outlook for tanker shipping rates, general industry conditions future operating results of the Company’s vessels, capital expenditures, expansion and growth opportunities, bank borrowings, financing activities and other such matters, are forward-looking statements. Although the Company believes that its expectations stated in this presentation are based on reasonable assumptions, actual results may differ from those projected in the forward-looking statements. Important factors that, in our view, could cause actual results to differ materially from those discussed in the forward-looking statements include the failure of counterparties to fully perform their obligations to us, the strength of the world economies and currencies, general market conditions, including changes in tanker vessel charter hire rates and vessel values, changes in demand for tankers, changes in our vessel operating expenses, including dry-docking, crewing and insurance costs, or actions taken by regulatory authorities, ability of customers of our pools to perform their obligations under charter contracts on a timely basis, potential liability from future litigation, domestic and international political conditions, potential disruption of shipping routes due to accidents and political events or acts by terrorists. We undertake no obligation to publicly update or revise any forward-looking statement contained in this presentation, whether as a result of new information, future events or otherwise, except as required by law. In light of the risks, uncertainties and assumptions, the forward-looking events discussed in this presentation might not occur, and our actual results could differ materially from those anticipated in these forward-looking statements.
  3. 4 © 2026 – CMB.TECH Public presentation : do not

    replicate or distribute without the prior written permission of CMB.TECH A leading diversified maritime group FINANCIALS & HIGHLIGHTS FLEET FINANCE LISTING 200 + 32 Modern Eco Vessels (1) $ 3.3 bn. Contract backlog (USD) (2) $ 11.3 bn. Fair Market Value(4) ~ 50% Through-out the cycle leverage target 5.9 Average age (excl. CTVs 10.4y) $ 1.2 bn. CAPEX commitments (5) ~ $ 4.4 bn. Market Cap (3) ~ 60% of Net Profit generated through S&P THE DIVERSIFIED FLEET DRY BULK CRUDE TANKERS CONTAINER CHEMICAL OFFSHORE ENERGY 103 (+12) 24 (+2) 4 (+1) 8 (+8) 61 (+9) 6.8 years Avg. age 6,562 FMV $ millions 7.2 years Avg. age 2,732 FMV $ millions 1.8 year Avg. age 402 FMV $ millions <1 year Avg. age 823 FMV $ millions <1 CSOV 10.4 CTV years avg. age 782 FMV $ millions Notes: (1) Fleet on water + newbuilding orders as of 31/03/2026. (2) Contract backlog as of 31/03/2025 including subsequent acquisitions, fully owned vessels, and 100% of our JV owned 210,000 dwt Newcastlemax bulk carriers and Windcat FRS & TSM. The contract backlog excludes charterers’ extension options and purchase/cancellation options (if applicable). (3) Calculated based on the closing price of 07/05/2026. (4) Based on broker valuations on 31/03/2026 (5) CAPEX on 31/03/2026
  4. 5 © 2026 – CMB.TECH Public presentation : do not

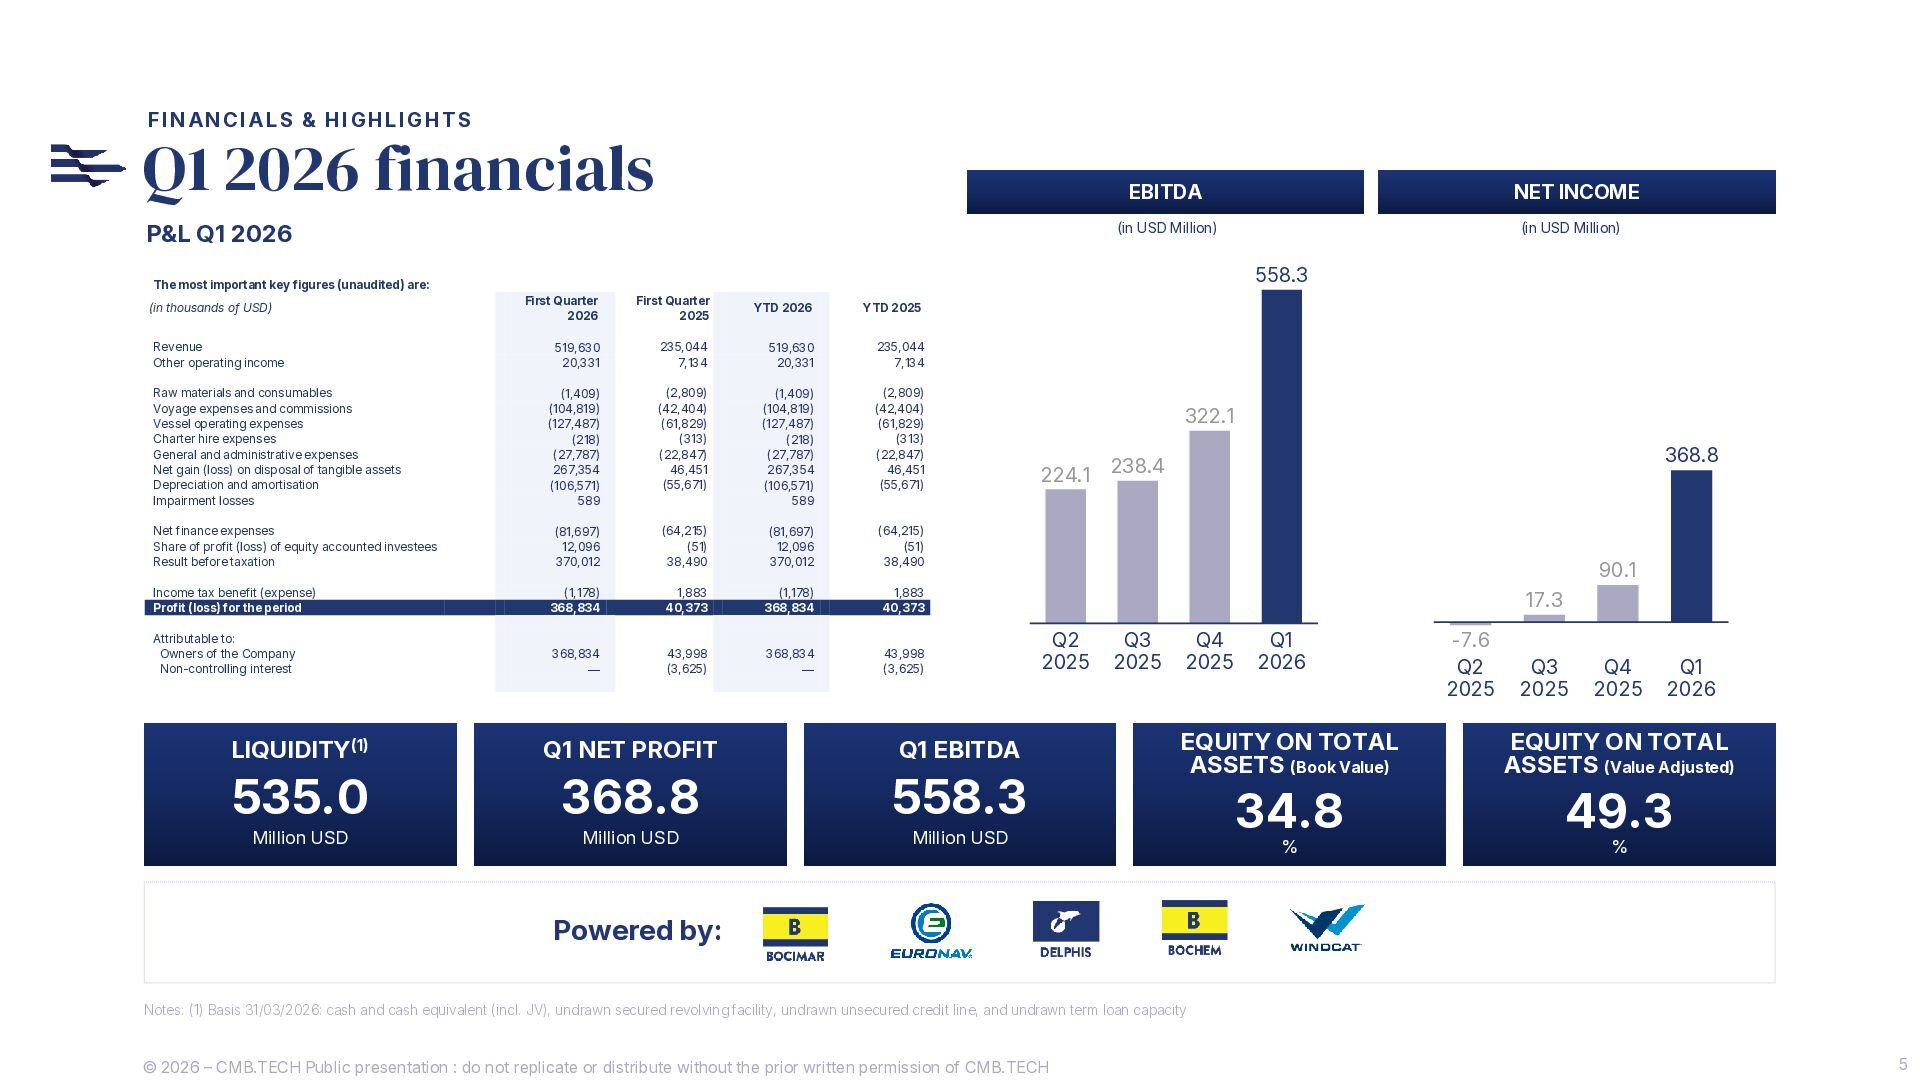
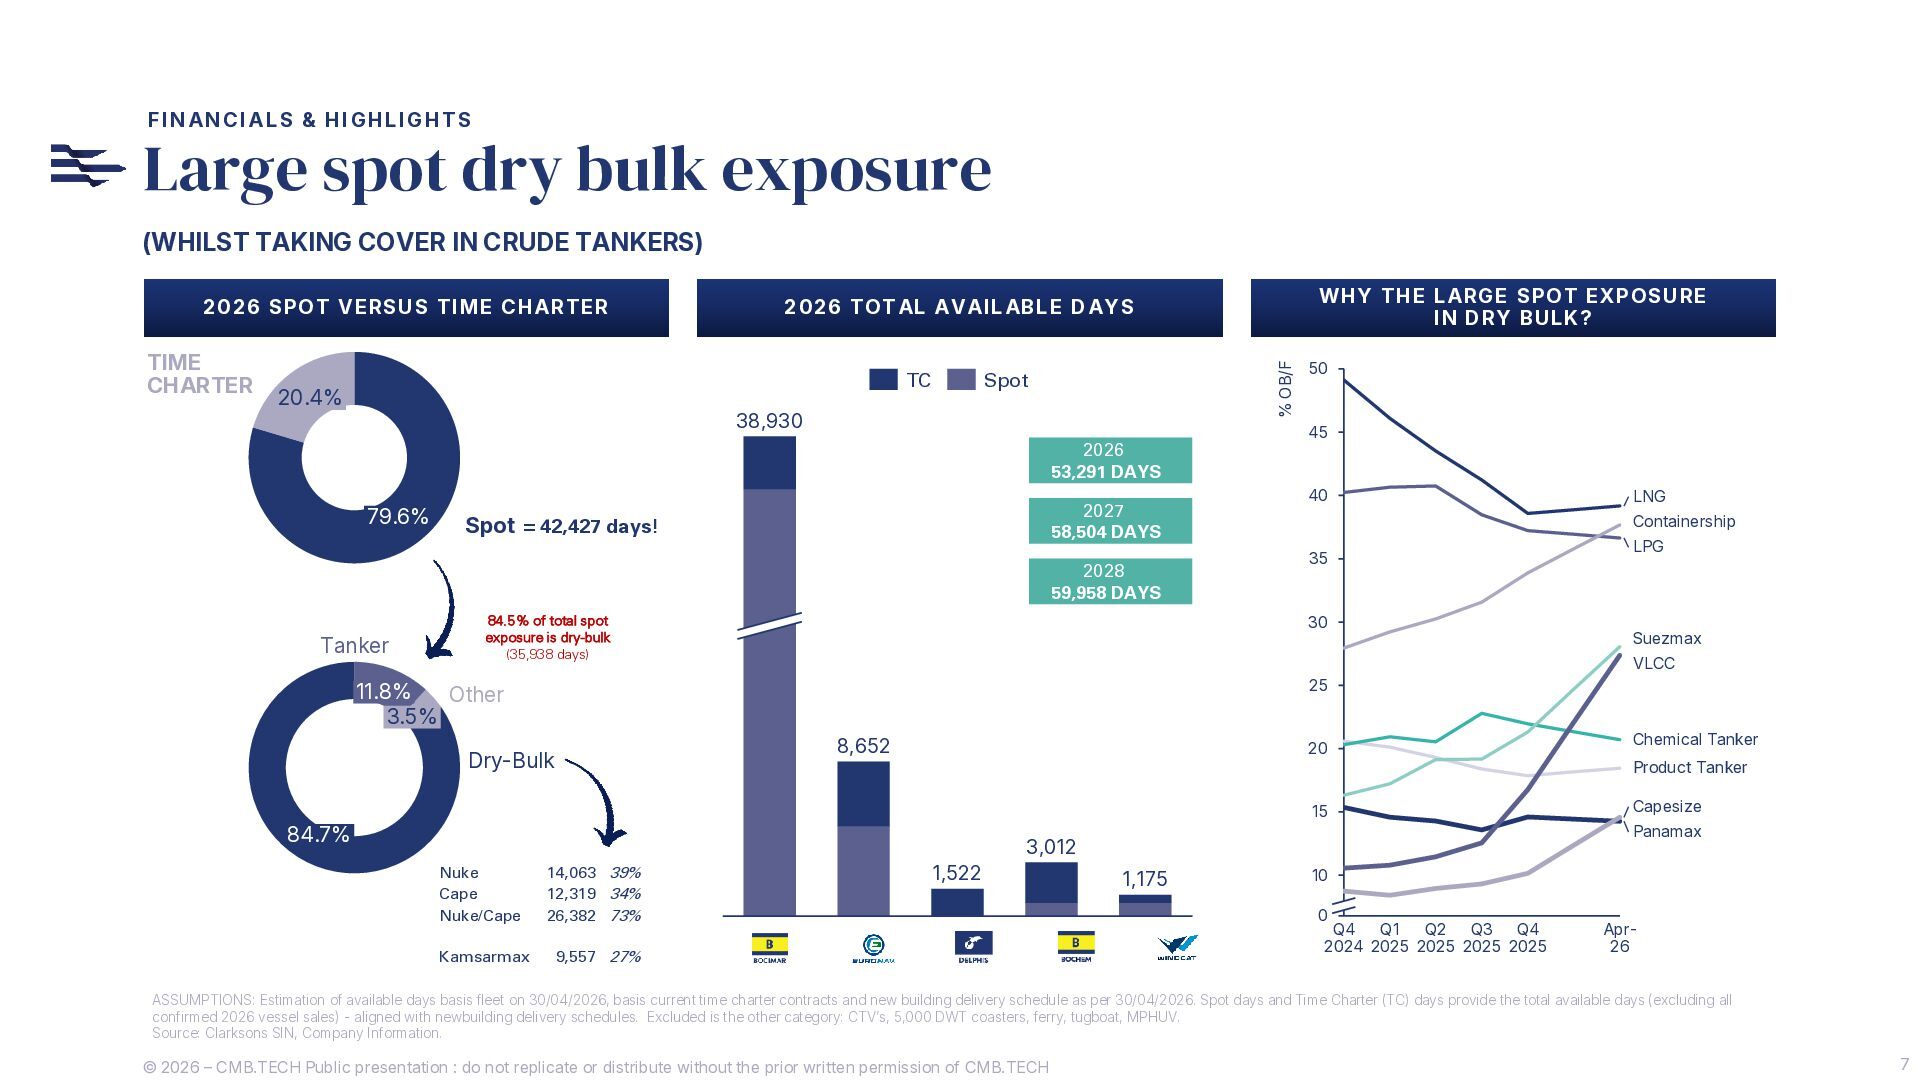
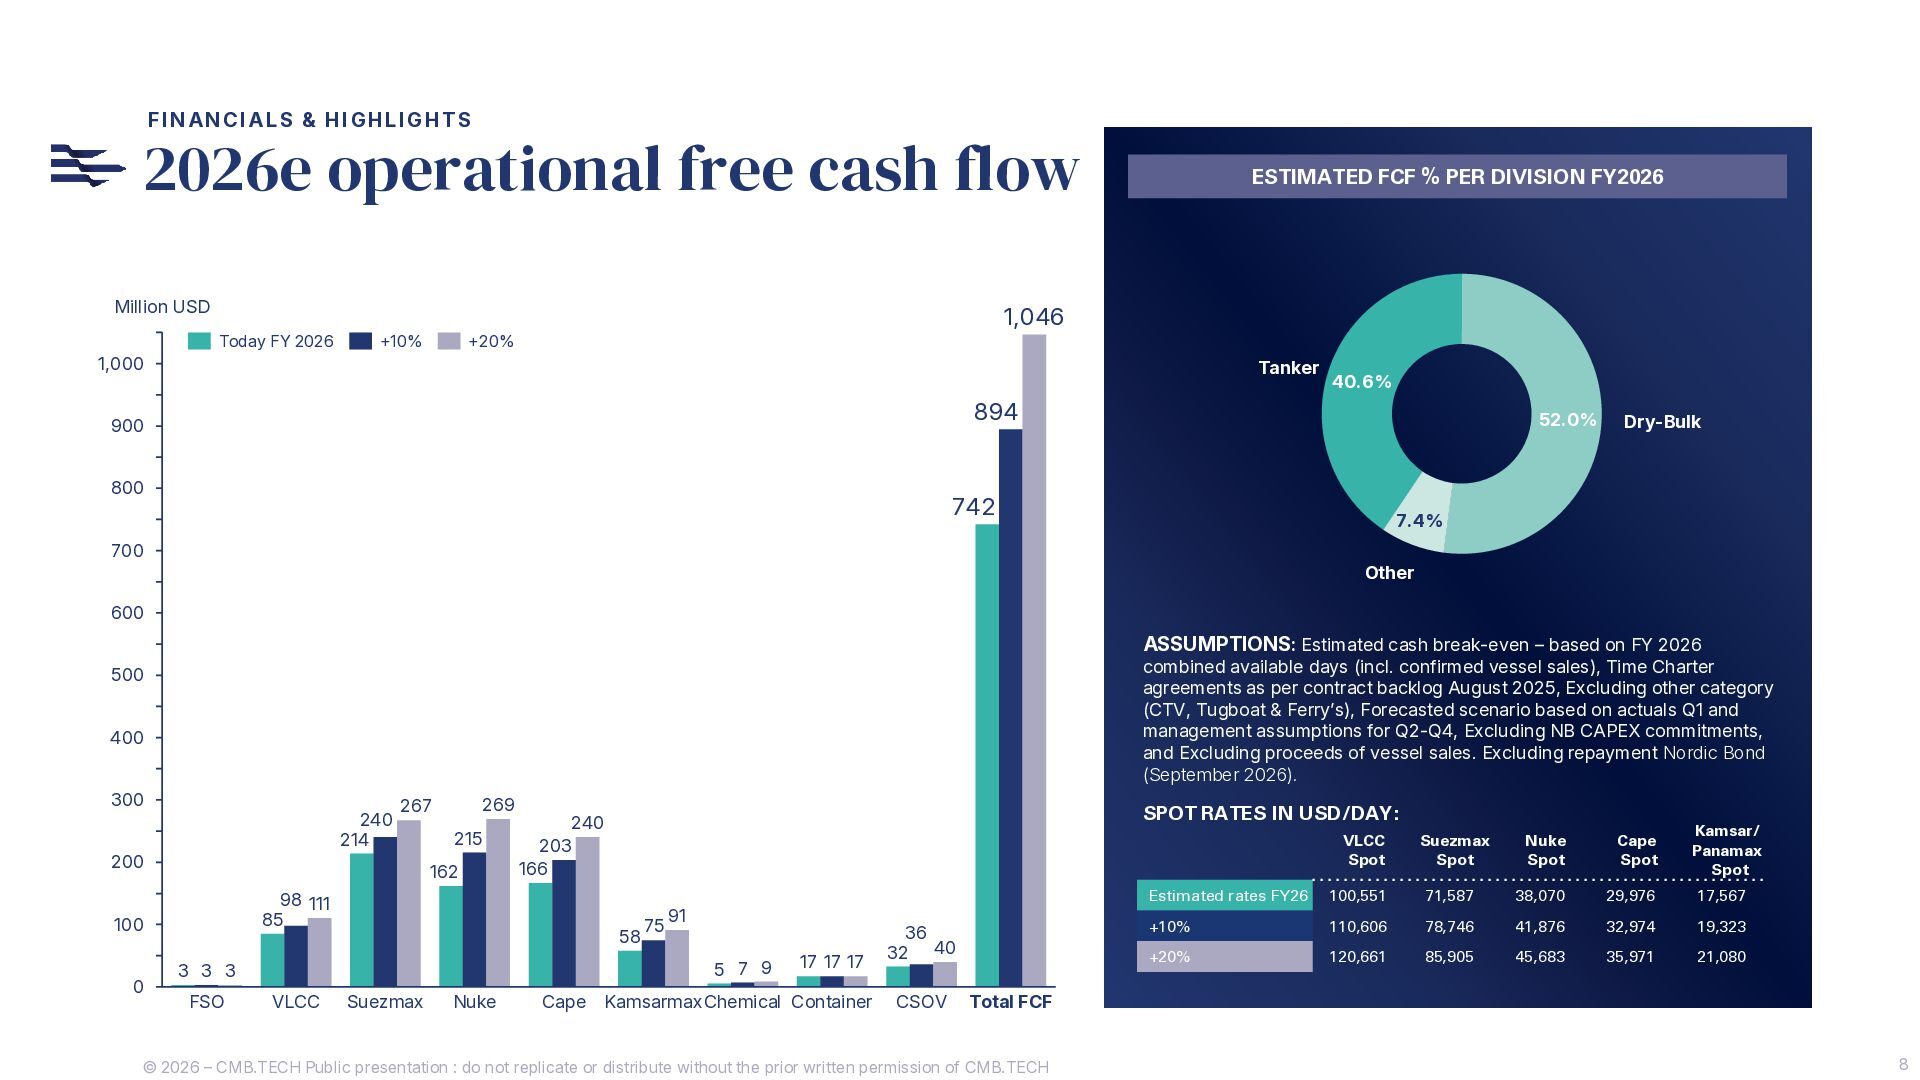
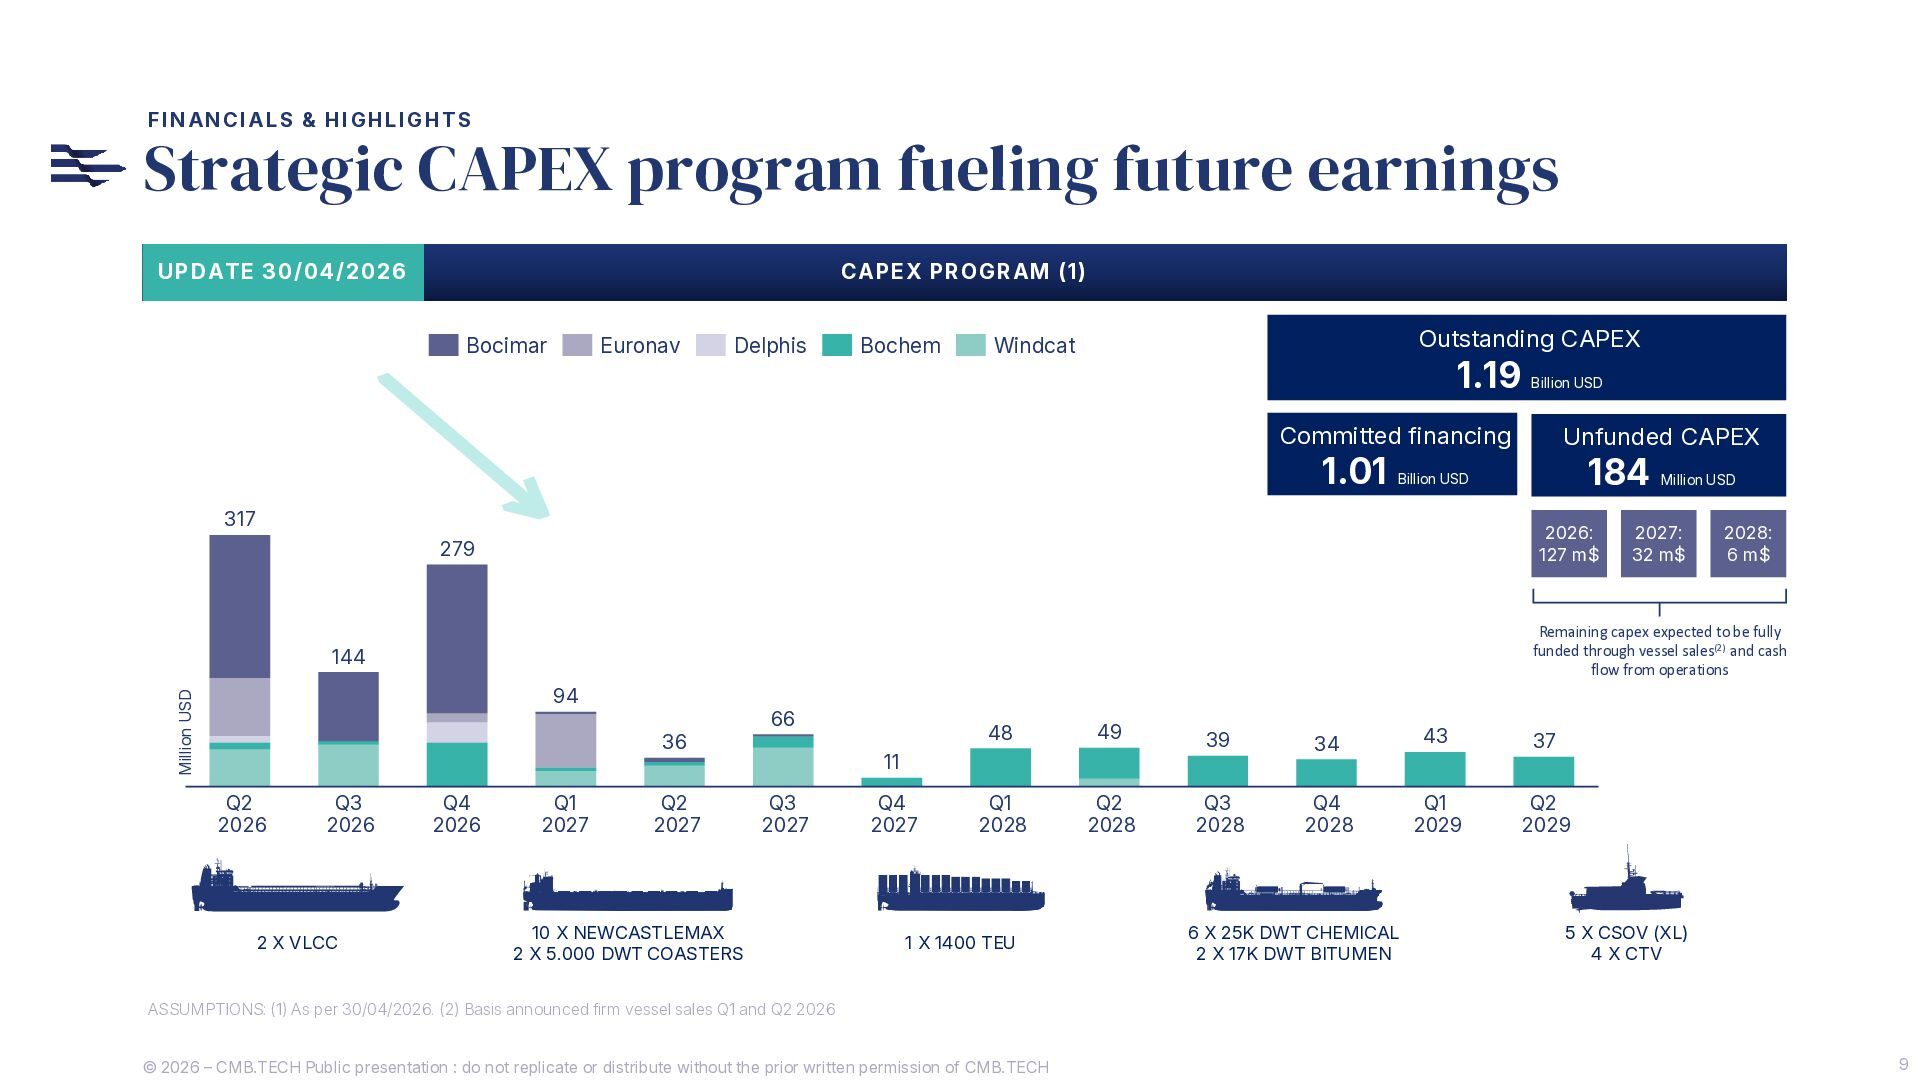
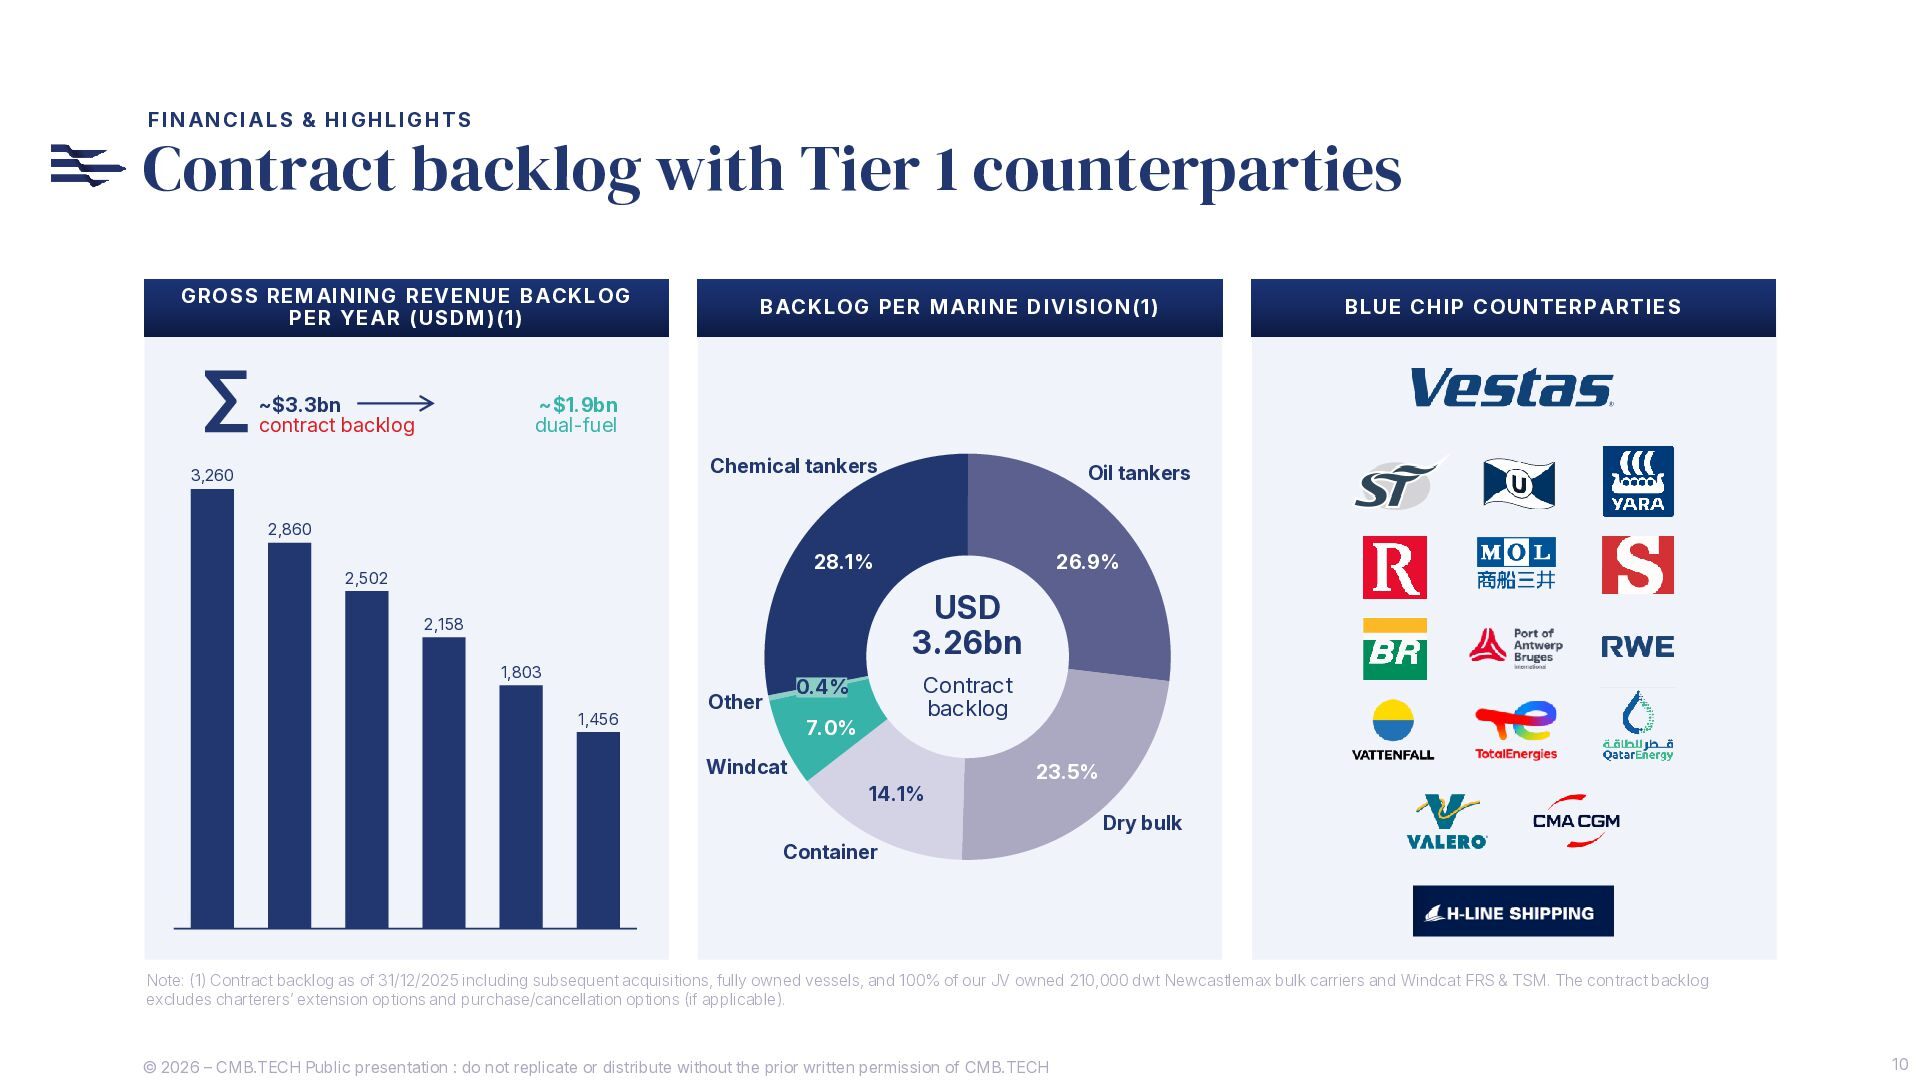
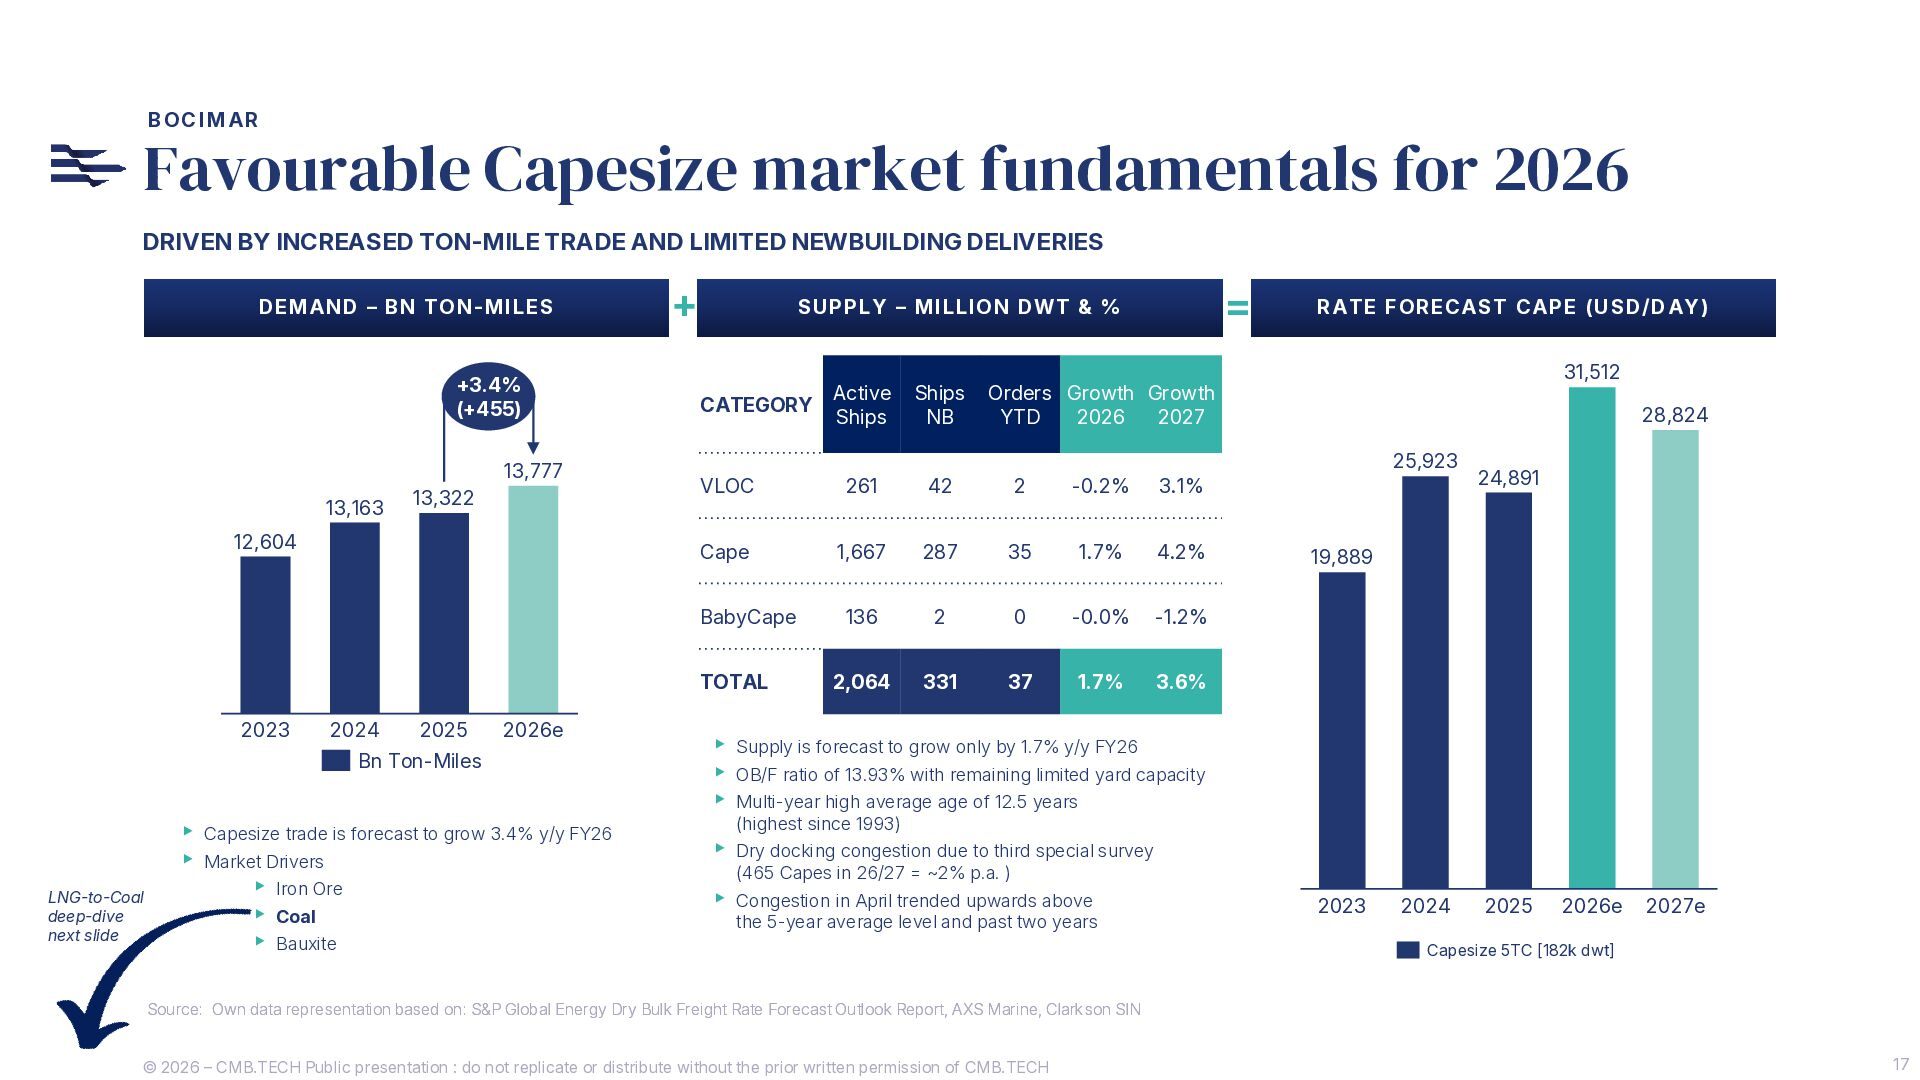
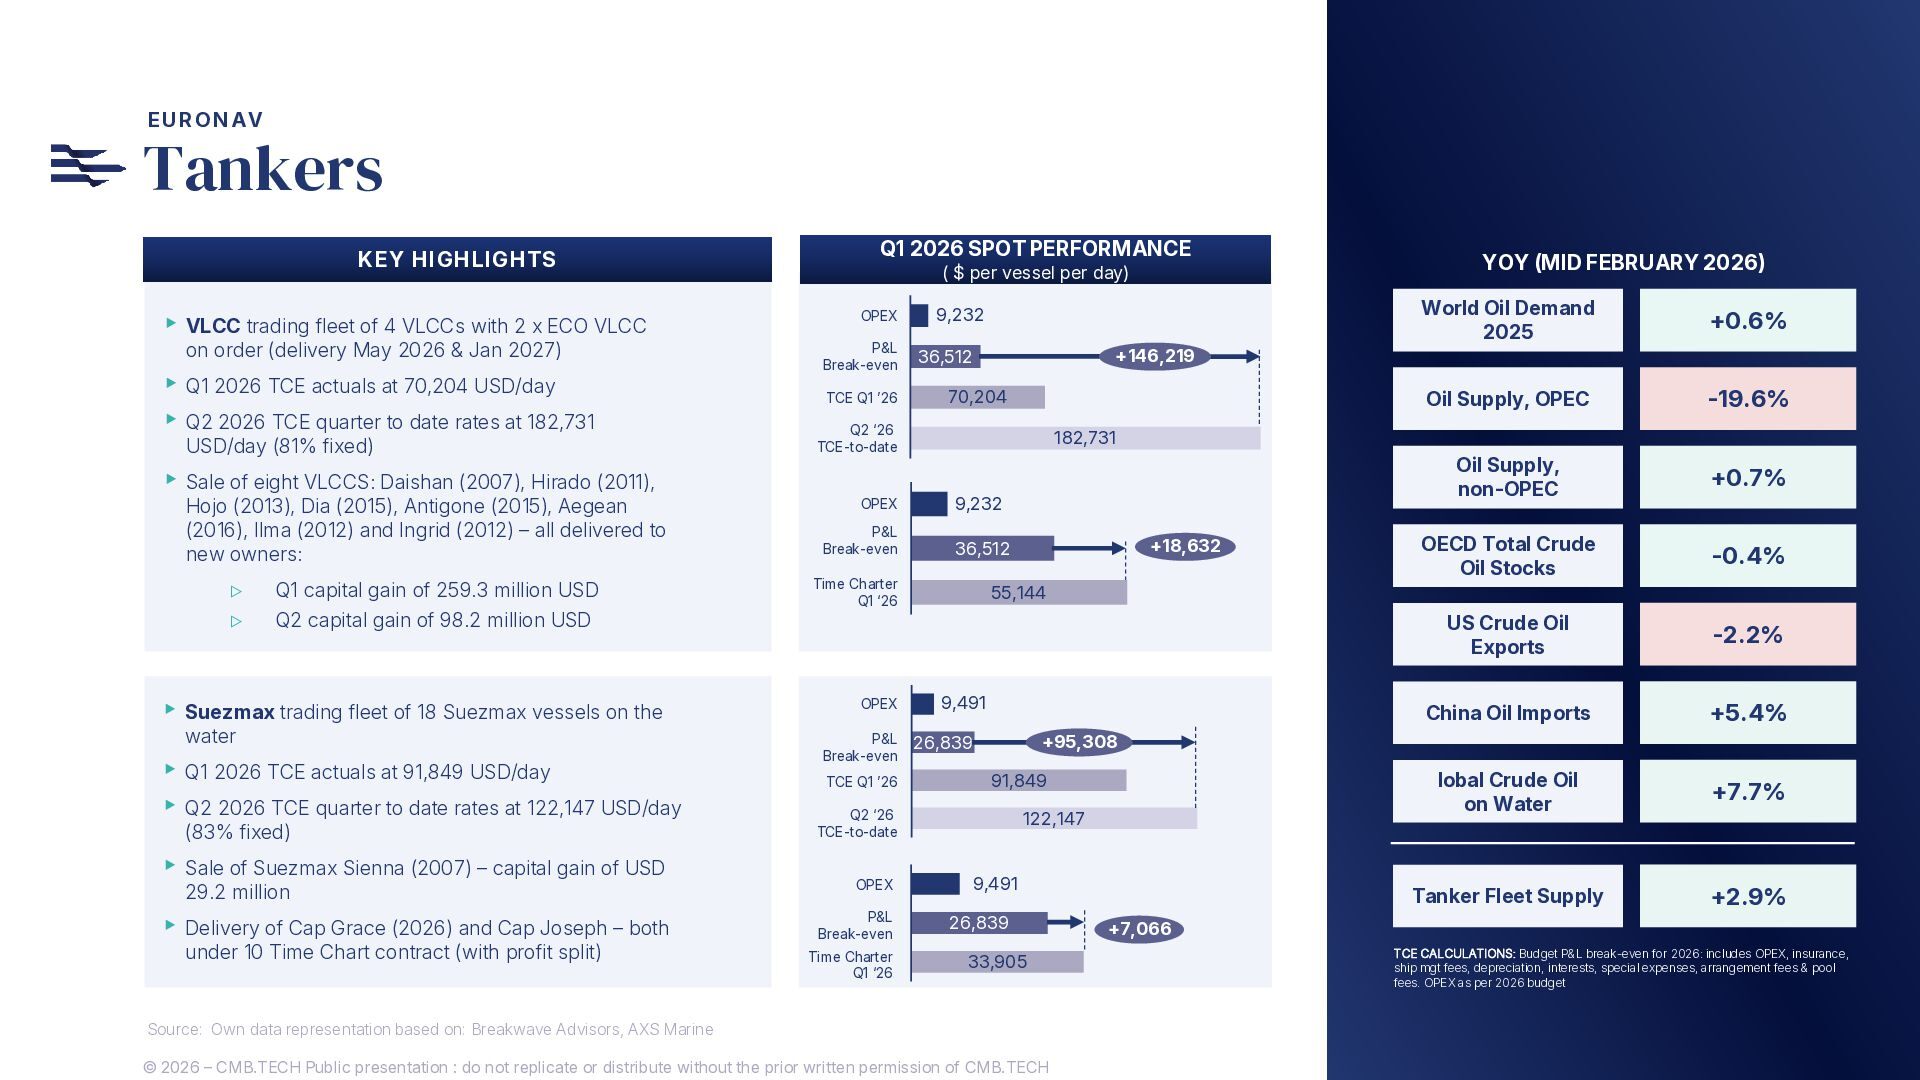
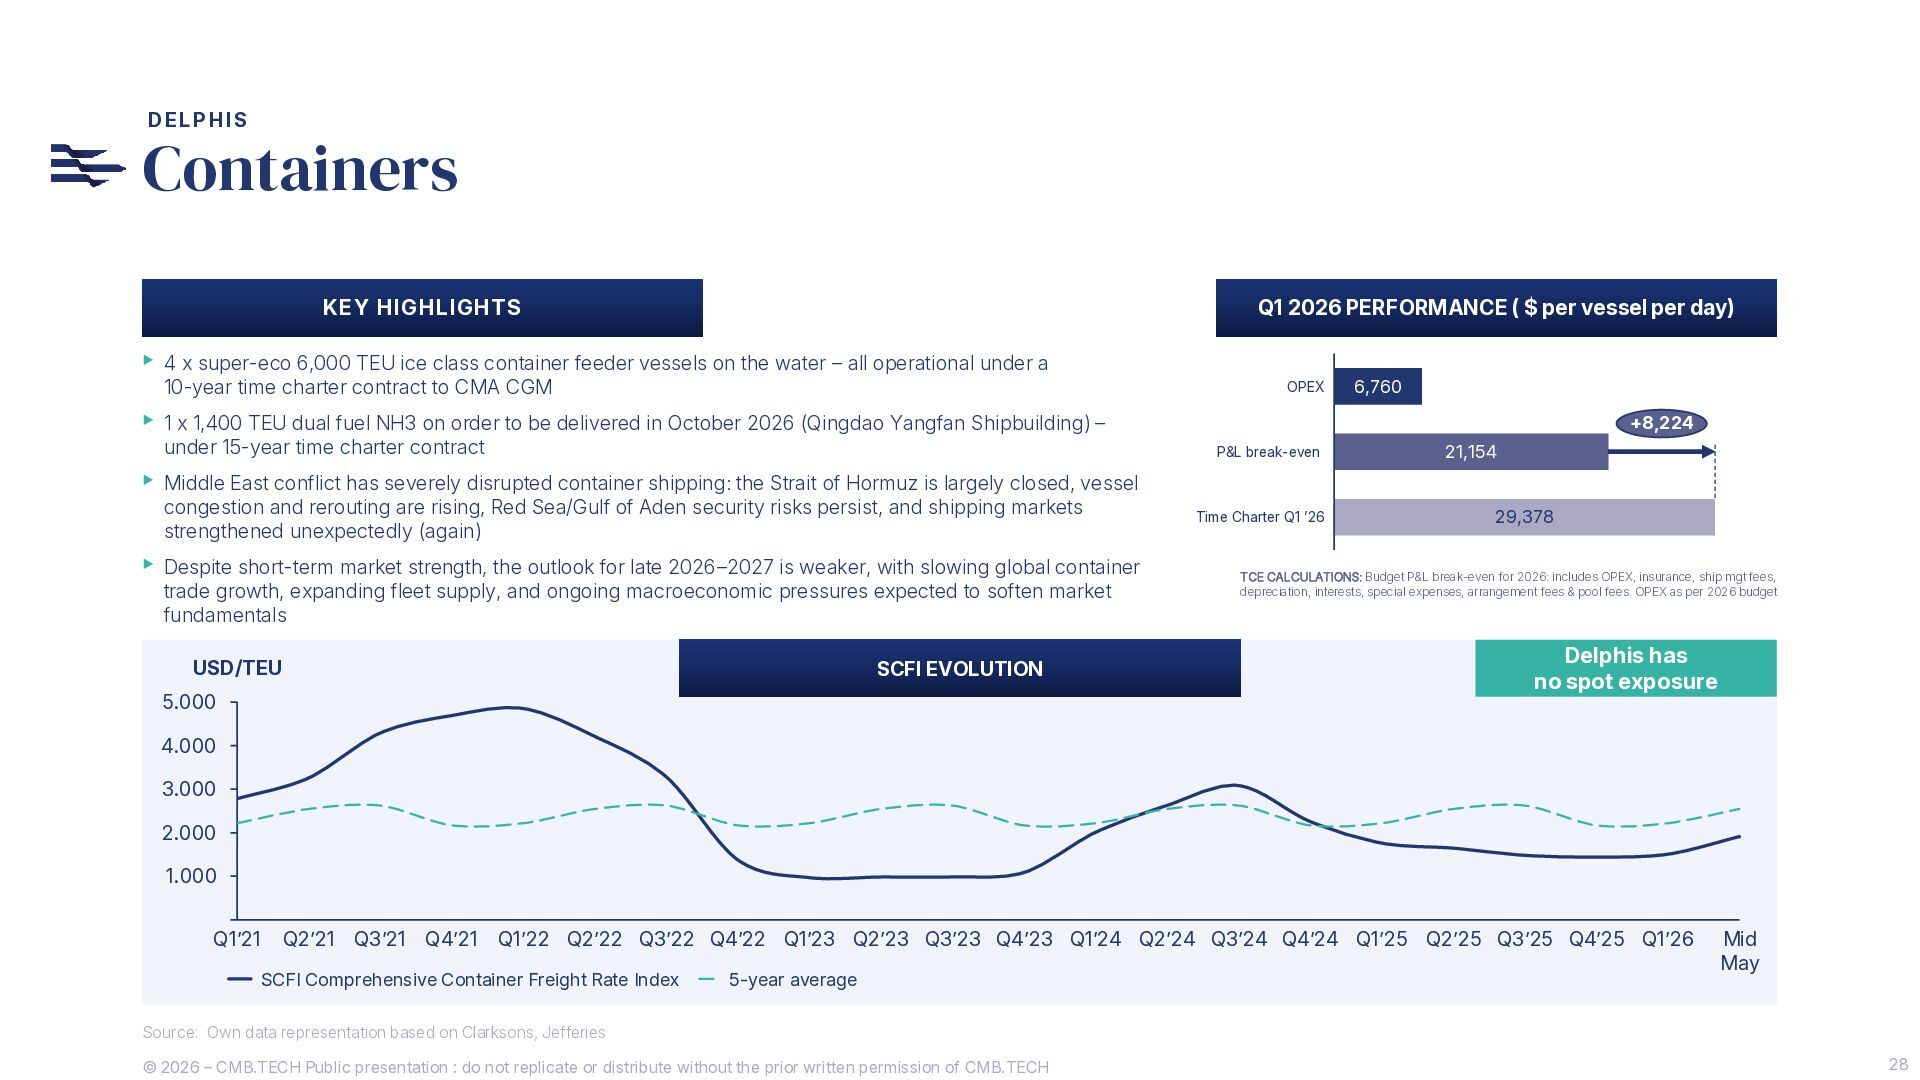
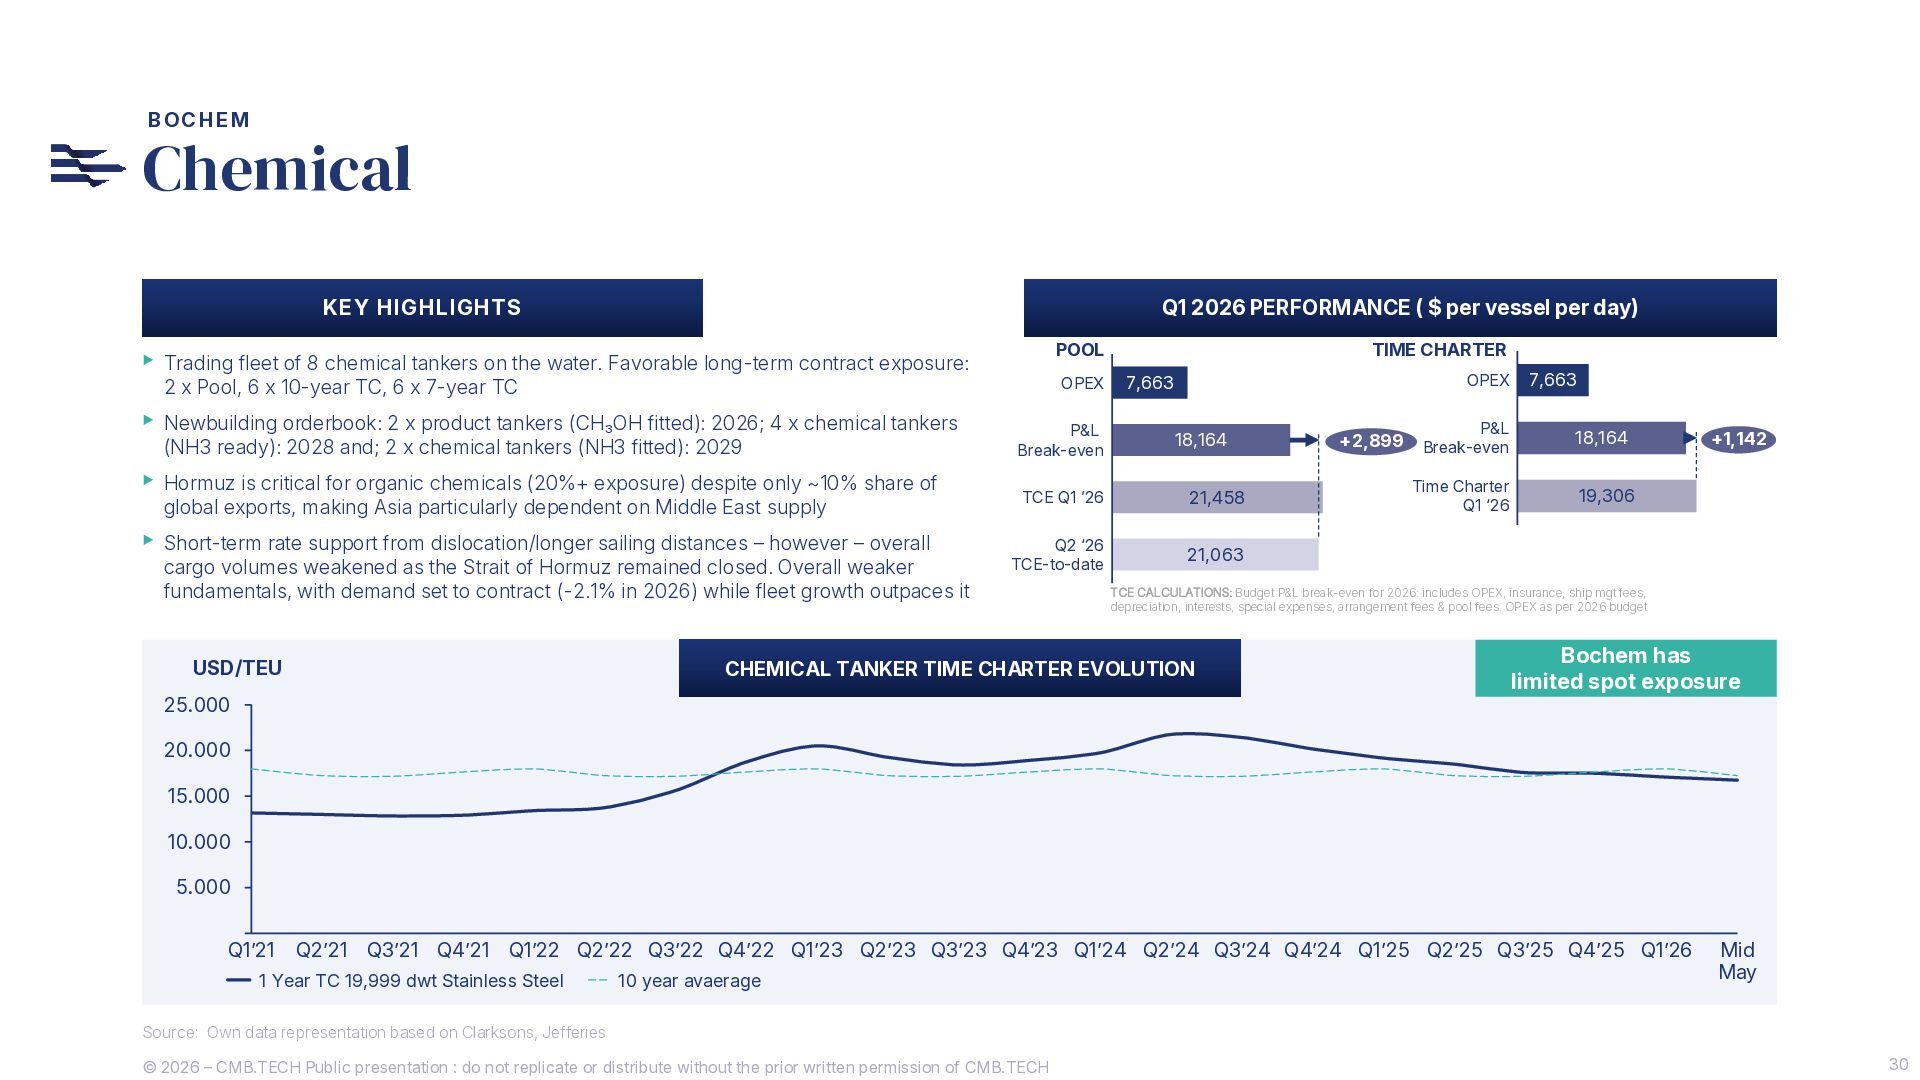
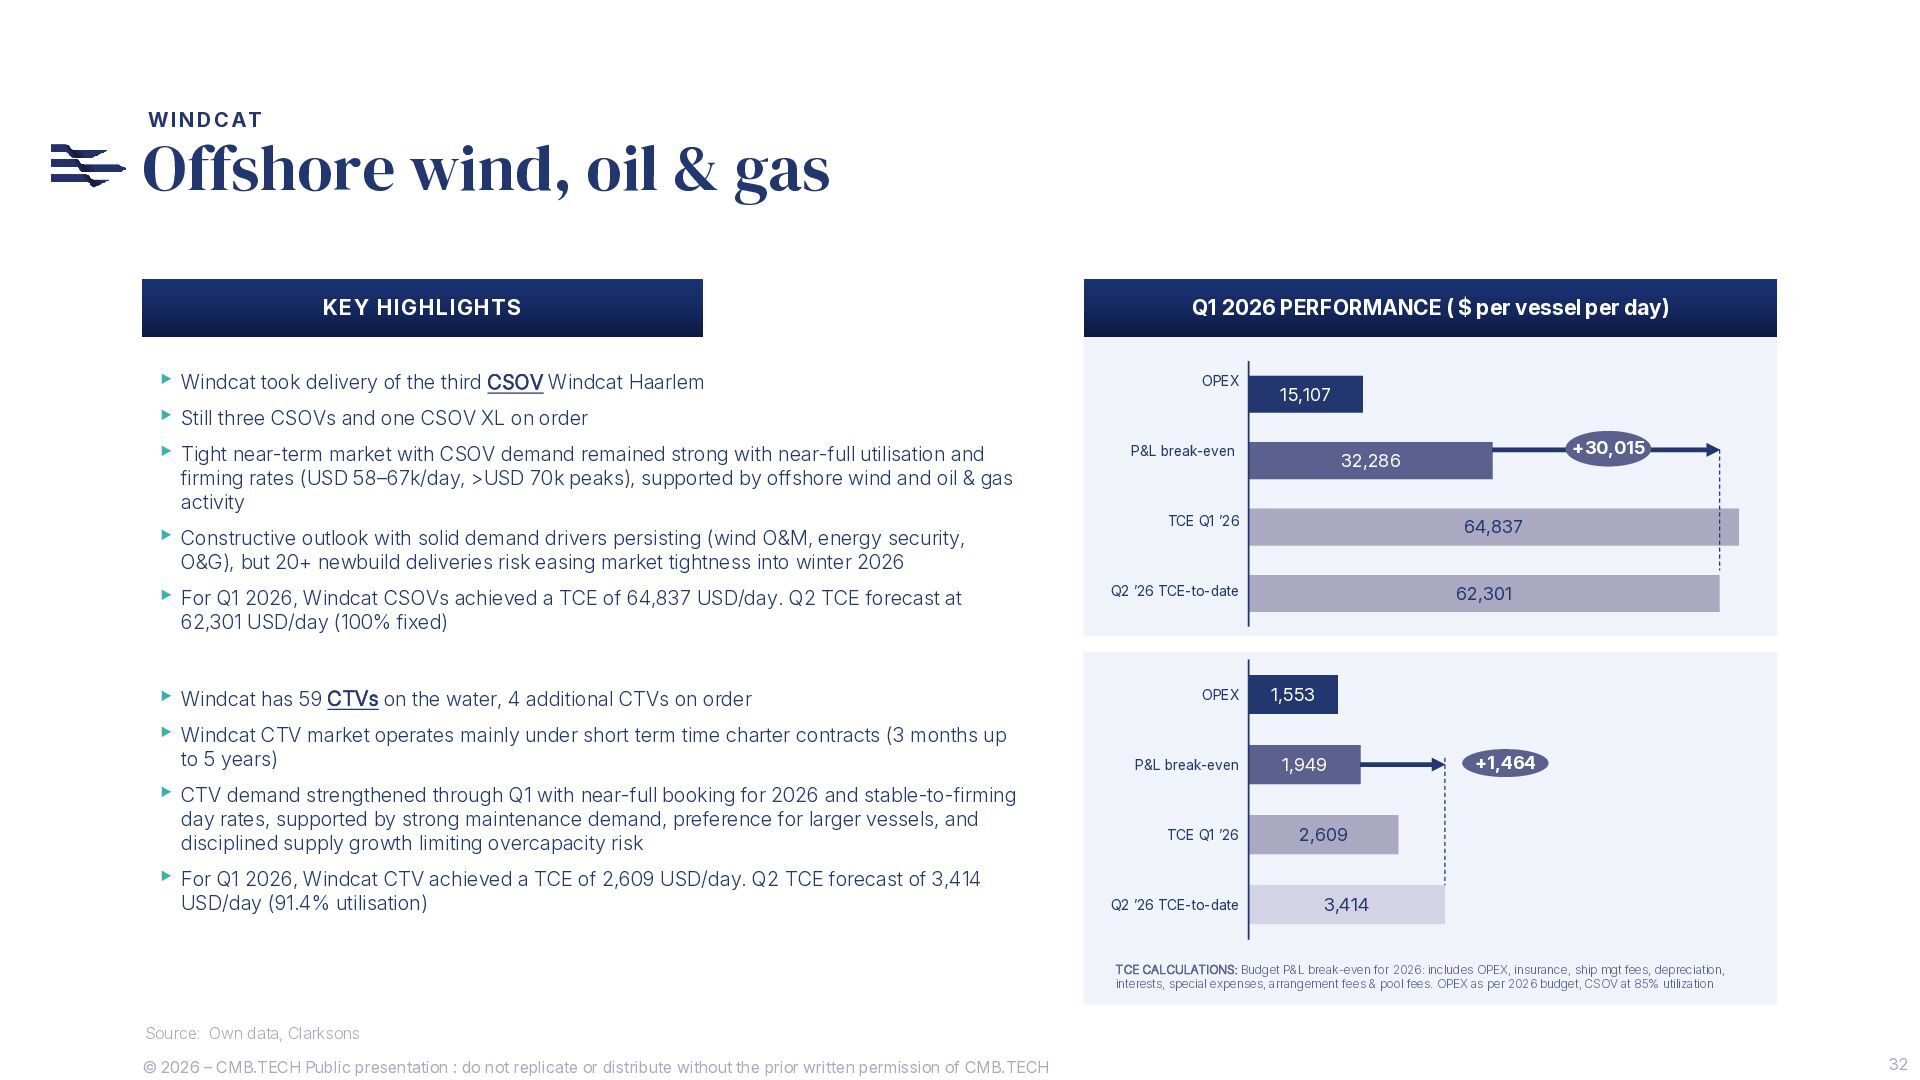
    replicate or distribute without the prior written permission of CMB.TECH Q1 2026 financials FINANCIALS & HIGHLIGHTS NET INCOME EBITDA (in USD Million) (in USD Million) LIQUIDITY(1) 535.0 Million USD Q1 NET PROFIT 368.8 Million USD Q1 EBITDA 558.3 Million USD EQUITY ON TOTAL ASSETS (Book Value) 34.8 % P&L Q1 2026 Powered by: EQUITY ON TOTAL ASSETS (Value Adjusted) 49.3 % The most important key figures (unaudited) are: (in thousands of USD) First Quarter 2026 First Quarter 2025 YTD 2026 YTD 2025 Revenue 519,630 235,044 519,630 235,044 Other operating income 20,331 7,134 20,331 7,134 Raw materials and consumables (1,409) (2,809) (1,409) (2,809) Voyage expenses and commissions (104,819) (42,404) (104,819) (42,404) Vessel operating expenses (127,487) (61,829) (127,487) (61,829) Charter hire expenses (218) (313) (218) (313) General and administrative expenses (27,787) (22,847) (27,787) (22,847) Net gain (loss) on disposal of tangible assets 267,354 46,451 267,354 46,451 Depreciation and amortisation (106,571) (55,671) (106,571) (55,671) Impairment losses 589 589 Net finance expenses (81,697) (64,215) (81,697) (64,215) Share of profit (loss) of equity accounted investees 12,096 (51) 12,096 (51) Result before taxation 370,012 38,490 370,012 38,490 Income tax benefit (expense) (1,178) 1,883 (1,178) 1,883 Profit (loss) for the period 368,834 40,373 368,834 40,373 Attributable to: Owners of the Company 368,834 43,998 368,834 43,998 Non-controlling interest — (3,625) — (3,625) Notes: (1) Basis 31/03/2026: cash and cash equivalent (incl. JV), undrawn secured revolving facility, undrawn unsecured credit line, and undrawn term loan capacity -7.6 17.3 90.1 368.8 Q2 2025 Q3 2025 Q4 2025 Q1 2026 224.1 238.4 322.1 558.3 Q2 2025 Q3 2025 Q4 2025 Q1 2026
  5. 6 © 2026 – CMB.TECH Public presentation : do not

    replicate or distribute without the prior written permission of CMB.TECH Q1 2026 highlights FINANCIALS & HIGHLIGHTS De-lever, pay dividends and strengthen the balance sheet… …driven by well-timed S&P as a core element to our business strategy ► Total result for the first quarter of 2026 was a profit of USD 368.8 million ► EBITDA for the first quarter of 2026 was USD 558.3 million ► Liquidity of USD 535.0 million per quarter end and total newbuilding CAPEX fully funded ► CMB.TECH’s contract backlog increased to USD 3.26 billion with the addition of 1 x 5-year Suezmax time charter and extension of 2 x Suezmax time charters by one year to a 10-year time charter each (with a profit split) ► Intention to distribute an amount of USD 0.64 per share: ▷ An interim dividend of USD 0.20 per share, ▷ A payment of USD 0.44 per share out of the share premium reserve (being except from any withholding tax) ► Well timed deliveries of 7 newbuilding vessels (Q1 + quarter to date): ▷ Newcastlemax: Mineral Latvija ▷ VLCC: Atrebates, Eburones ▷ Suezmax: Cap Grace, Cap Joseph ▷ Chemical tanker: Bochem Callao ▷ CSOV: Windcat Haarlem ► Following vessel sales generated a capital gain in Q1 2026: ▷ Capesize Golden Magnum (2009, 179,790 dwt), and Capesize Belgravia (2009, 169,390 dwt) – capital gain of 8.1 million USD ▷ VLCC Daishan (2007, 306,005 dwt), VLCC Hirado (2011, 302,550 dwt), VLCC Hojo (2013, 302,965 dwt), VLCC Dia (2015, 299,999 dwt), VLCC Antigone (2015, 299,421 dwt), and VLCC Aegean (2016, 299,999 dwt) – capital gain of USD 259.3 million ► Following vessel sales will generate a capital gain in Q2 2026: ▷ VLCCs Ilma (2012, 314,000 dwt) and VLCC Ingrid (2012, 314,000 dwt) – capital gain of a USD 98.2 million in Q2 2026 ▷ Suezmax Sienna (2007, 150,205 dwt) – capital gain of USD 29.2 million ➔ Q1 2026 Capital gain: 267.4 million USD ➔ Q2 2026 Capital gain: 127.4 million USD
  6. 7 © 2026 – CMB.TECH Public presentation : do not

    replicate or distribute without the prior written permission of CMB.TECH (WHILST TAKING COVER IN CRUDE TANKERS) 2026 SPOT VERSUS TIME CHARTER WHY THE LARGE SPOT EXPOSURE IN DRY BULK? Large spot dry bulk exposure 2026 TOTAL AVAILABLE DAYS FINANCIALS & HIGHLIGHTS ASSUMPTIONS: Estimation of available days basis fleet on 30/04/2026, basis current time charter contracts and new building delivery schedule as per 30/04/2026. Spot days and Time Charter (TC) days provide the total available days (excluding all confirmed 2026 vessel sales) - aligned with newbuilding delivery schedules. Excluded is the other category: CTV’s, 5,000 DWT coasters, ferry, tugboat, MPHUV. Source: Clarksons SIN, Company Information. 38,930 8,652 1,522 3,012 1,175 Spot TIME CHARTER 79.6% 20.4% 2026 53,291 DAYS 2027 58,504 DAYS 2028 59,958 DAYS 50 40 0 10 15 20 25 30 35 45 % OB/F Q4 2024 Q1 2025 Q2 2025 Q3 2025 Q4 2025 Apr- 26 LNG LPG Containership Product Tanker Chemical Tanker Suezmax VLCC Capesize Panamax 84.7% Dry-Bulk 11.8% Tanker 3.5% Other 84.5% of total spot exposure is dry-bulk (35,938 days) = 42,427 days! TC Spot Nuke 14,063 39% Cape 12,319 34% Nuke/Cape 26,382 73% Kamsarmax 9,557 27%
  7. 8 © 2026 – CMB.TECH Public presentation : do not

    replicate or distribute without the prior written permission of CMB.TECH 2026e operational free cash flow FINANCIALS & HIGHLIGHTS VLCC Spot Suezmax Spot Nuke Spot Cape Spot Kamsar/ Panamax Spot Estimated rates FY26 100,551 71,587 38,070 29,976 17,567 +10% 110,606 78,746 41,876 32,974 19,323 +20% 120,661 85,905 45,683 35,971 21,080 ESTIMATED FCF % PER DIVISION FY2026 0 100 200 300 400 500 600 700 800 900 1,000 FSO VLCC Suezmax Nuke Cape KamsarmaxChemical Container CSOV Total FCF 3 3 3 85 98 111 214 240 267 162 215 269 166 203 240 58 75 91 Million USD 7 9 17 17 17 5 36 40 742 894 1,046 32 Today FY 2026 +10% +20% 40.6% 52.0% 7.4% Tanker Dry-Bulk Other ASSUMPTIONS: Estimated cash break-even – based on FY 2026 combined available days (incl. confirmed vessel sales), Time Charter agreements as per contract backlog August 2025, Excluding other category (CTV, Tugboat & Ferry’s), Forecasted scenario based on actuals Q1 and management assumptions for Q2-Q4, Excluding NB CAPEX commitments, and Excluding proceeds of vessel sales. Excluding repayment Nordic Bond (September 2026). SPOT RATES IN USD/DAY:
  8. 9 © 2026 – CMB.TECH Public presentation : do not

    replicate or distribute without the prior written permission of CMB.TECH Strategic CAPEX program fueling future earnings FINANCIALS & HIGHLIGHTS Q2 2026 Q3 2026 Q4 2026 Q1 2027 Q2 2027 Q3 2027 Q4 2027 Q1 2028 Q2 2028 Q3 2028 Q4 2028 Q1 2029 Q2 2029 317 144 279 94 36 66 11 48 49 39 34 43 37 Bocimar Euronav Delphis Bochem Windcat 2 X VLCC 10 X NEWCASTLEMAX 2 X 5.000 DWT COASTERS 1 X 1400 TEU 6 X 25K DWT CHEMICAL 2 X 17K DWT BITUMEN 5 X CSOV (XL) 4 X CTV CAPEX PROGRAM (1) Committed financing 1.01 Billion USD Unfunded CAPEX 184 Million USD 2026: 127 m$ 2027: 32 m$ 2028: 6 m$ Outstanding CAPEX 1.19 Billion USD Remaining capex expected to be fully funded through vessel sales(2) and cash flow from operations ASSUMPTIONS: (1) As per 30/04/2026. (2) Basis announced firm vessel sales Q1 and Q2 2026 UPDATE 30/04/2026 Million USD
  9. 10 © 2026 – CMB.TECH Public presentation : do not

    replicate or distribute without the prior written permission of CMB.TECH GROSS REMAINING REVENUE BACKLOG PER YEAR (USDM)(1) BLUE CHIP COUNTERPARTIES Contract backlog with Tier 1 counterparties BACKLOG PER MARINE DIVISION(1) FINANCIALS & HIGHLIGHTS Note: (1) Contract backlog as of 31/12/2025 including subsequent acquisitions, fully owned vessels, and 100% of our JV owned 210,000 dwt Newcastlemax bulk carriers and Windcat FRS & TSM. The contract backlog excludes charterers’ extension options and purchase/cancellation options (if applicable). ∑ ~$3.3bn contract backlog ~$1.9bn dual-fuel 3,260 2,860 2,502 2,158 1,803 1,456 28.1% 26.9% 23.5% 14.1% 7.0% Chemical tankers Oil tankers Dry bulk Container Windcat 0.4% Other USD 3.26bn Contract backlog
  10. 12 © 2026 – CMB.TECH Public presentation : do not

    replicate or distribute without the prior written permission of CMB.TECH Supply side drives market outlook MARKET UPDATE DRY BULK TANKERS CONTAINER CHEMICAL OFFSHORE ENERGY Demand side ▸ Tonne-mile iron ore: +1.8 % in 2026 +2.8 % in 2027 ▸ Tonne-mile bauxite: + 10.8 % in 2026 ▸ Tonne-mile 2026 +0.3% agribulk +3.1% minor bulk +1.1% coal ▸ Tonne-mile crude oil: -0.4% in 2026 +1.8% in 2027 ▸ World oil demand (IEA) incl. closure of Strait of Hormuz : -80 kb/d in 2026 +700 kb/d in 2027 ▸ TEU-mile: -1.0% in 2026 -5.5% in 2027 ▸ Tonne-mile chemicals: +0.9% in 2026 +1.0% in 2027 ▸ Global GDP growth adjusted for tariffs effect: +3.1% in 2026 (with adverse scenario of 2.5%) ▸ Over the next two years (2026-2027), an average of 19GW of capacity per year is scheduled to be completed ▸ Increased demand from the oil and gas side of the industry is noticeable Supply side ▸ OB/F for Capesize 14.6%, Panamax 14.3% ▸ 2026 Capesize 2026 fleet growth 1.7%, Panamax 4.9% ▸ 38% Capes > 15 years, 33% Panamax >15 years ▸ OB/F VLCC 27.4%, Suezmax 28.1% ▸ 2026 crude fleet growth of 3.8%, 5.6% in 2027 ▸ 18% of the VLCC & 20% Suezmax fleet > 20 years ▸ OB/F: 37.6% (average over all sizes) ▸ Red Sea rerouting (~12%) ▸ 2026 container fleet growth of 4.7%, 7.6% in 2027 ▸ OB/F ratio at 20.7% of the 10-54,999 dwt chemical tanker fleet ▸ 26.0% > 20 years ▸ Product tanker tonnage as swing factor ▸ CTV fleet stands at 731 units versus an orderbook of 101 units (OB/F 13.8%) ▸ Tier 1 CSOV fleet stands at 65 units versus an orderbook of 45 units (OB/F 40.9%) Supply / Demand balance 2026 POSITIVE POSITIVE CAUTIOUS CAUTIOUS POSITIVE Commercial exposure Spot: 87 (+ 9NB) Time Charter: 16 (+3NB) Spot: 11 (+2NB) Time Charter: 13 Spot: 0 Time Charter: 4 (+1NB) Spot: 2 Time Charter: 6 (+8NB) CTV Spot: 4 (+4NB) CTV Time Charter: 55 CSOV Spot: 0 (+4NB) CSOV Short TC: 2 (+1NB) Source: Clarksons SIN, IMF, AXS Marine, Morgan Stanley, BRS, Bloomberg Intelligence
  11. 14 © 2026 – CMB.TECH Public presentation : do not

    replicate or distribute without the prior written permission of CMB.TECH 14 YOY (MID MAY 2026) Dry bulk BOCIMAR KEY HIGHLIGHTS Q1 2026 SPOT PERFORMANCE ( $ per vessel per day) TCE CALCULATIONS: Budget P&L break-even for 2026: includes OPEX, insurance, ship mgt fees, depreciation, interests, special expenses, arrangement fees & pool fees. OPEX as per 2026 budget ▸36 NEWCASTLEMAXES on the water (average age of 3.2y) with another 10 Newcastlemaxes to be delivered by Q1 2027 ▸Q1 2026 TCE actuals at 28,120 USD/day, outperforming 5TC BCI by 3,035 USD/day net of commissions ▸Q2 2026 TCE quarter to date rates at 44,105 USD/day (80% fixed) ▸ Time Charter: 24,114 USD/day (4 vessels) 29,531 28,120 44,105 OPEX P&L break-even TCE Q1 ’26 Q2 ’26 TCE-to-date 7,039 7,113 21,380 26,104 37,701 OPEX P&L break-even TCE Q1 ’26 Q2 ’26 TCE-to-date +16,321 6,307 14,787 14,578 19,402 OPEX P&L break-even TCE Q1 ’26 Q2 ’26 TCE-to-date +4,615 ▸37 CAPESIZE VESSELS on the water (average age of 11.2y) ▸Q1 2026 TCE actuals at 26,104 USD/day, outperforming 5TC BCI182 by 1,019 USD/day net of commissions ▸Q1 2026 TCE quarter to date rates at 37,701 USD/day (73% fixed) ▸30 KAMSARMAX/PANAMAX vessels on the water ▸Q1 2026 TCE actuals at 14,578 USD/day, in line with 5TC BPI-82 net of commissions ▸Q2 2026 TCE quarter to date rates at 19,402 USD/day (74% fixed) ▸Time Charter: 13,456 USD/day (8 vessels with redelivery Q2/Q3 2026) Source: Own data representation based on Clarksons Research, Breakwave Advisors, AXS Marine, Bloomberg +14,574 China steel production China steel inventories China iron ore inventories China iron ore imports China coal imports Brazil iron ore exports Australia iron ore exports -4.5% +7.0% +18.1% +3.4% -7.7% +5.9% +2.6% Dry bulk fleet supply +3.0% China soybean imports +5.1%
  12. 15 © 2026 – CMB.TECH Public presentation : do not

    replicate or distribute without the prior written permission of CMB.TECH AND HENCE VESSEL VALUES ARE SUPPORTED GOING FORWARD VESSEL NB SUPPLY SIDE FUNDAMENTALS VESSEL AVERAGE AGE AS A PROXY FOR RECYCLING POTENTIAL Dry bulk has the most favourable OB/F ratio BOCIMAR Total NB: 473 # OB/F: 14.3 % Total NB: 276 # OB/F: 14.6 % 116 169 133 53 35 93 106 40 0 50 100 150 200 250 300 2026 2027 2028 2029 11 13 2030 2 2031 Capesize NB deliveries Panamax NB deliveries 2020 2025 2030 0 8 1990 1995 10 2000 11 9 12 2005 13 2010 2015 12.3 12.3 12.6 Age (years) 11.4 Capesize - Average Age Panamax - Average Age 33% > 15 years 19% > 20 years 39% > 15 years 9% > 20 years CAPESIZE ‘BALANCE’ PANAMAX ‘BALANCE’ ✓ ✓ 15y average Source: Own data representation based on: Clarksons SIN, AXS Marine
  13. 16 © 2026 – CMB.TECH Public presentation : do not

    replicate or distribute without the prior written permission of CMB.TECH NOT YET DRIVEN BY ADDITIONAL COAL DEMAND CAPESIZE VOLUME GROWTH – TOP EXPORTED COMMODITIES PANAMAX VOLUME GROWTH – TOP EXPORTED COMMODITIES Strong Q1 volumes driven by iron ore and bauxite BOCIMAR 15 20 Jan-25 124 19 18 Jan-26 101 17 20 Feb-25 112 20 18 Feb-26 128 17 24 Mar-25 120 22 22 Mar-26 121 15 23 Apr-25 129 19 25 Apr-26 Iron Ore 113 Coal 147 161 138 Bauxite 170 164 159 172 150 102 17 8 4 Jan-25 64 20 8 4 Jan-26 53 22 7 3 Feb-25 55 22 6 3 Feb-26 61 27 8 5 Mar-25 61 28 7 3 Mar-26 57 23 7 4 Apr-25 60 25 7 3 Apr-26 62 Grain Iron Ore Bauxite 92 96 Coal 87 99 90 96 86 Q1 YOY Growth Cargo split % Q1 COAL +2.4% (+4.1 MMT) 63.9% GRAIN +5.4% (+3.6 MMT) 24.9% IRON ORE -11.1% (-2.7 MMT) 7.7% BAUXITE -22.5% (-2.8 MMT) 3.5% Q1 YOY Growth Cargo split % Q1 IRON ORE +4.1% (+13.9 MMT) 74.9% BAUXITE +25.5% (+12.4 MMT) 12.2% COAL -8.8% (-5.6 MMT) 12.8% Source: Own data representation based on: AXS Marine
  14. 17 © 2026 – CMB.TECH Public presentation : do not

    replicate or distribute without the prior written permission of CMB.TECH 19,889 25,923 24,891 31,512 28,824 DRIVEN BY INCREASED TON-MILE TRADE AND LIMITED NEWBUILDING DELIVERIES DEMAND – BN TON-MILES RATE FORECAST CAPE (USD/DAY) Favourable Capesize market fundamentals for 2026 SUPPLY – MILLION DWT & % BOCIMAR Source: Own data representation based on: S&P Global Energy Dry Bulk Freight Rate Forecast Outlook Report, AXS Marine, Clarkson SIN Source: Own data representation based on: S&P Global Energy Dry Bulk Freight Rate Forecast Outlook Report, AXS Marine, Clarkson SIN 2023 2024 2025 2026e 2027e Capesize 5TC [182k dwt] 12,604 13,163 13,322 13,777 0.0 0.1 0.2 0.3 0.4 0.5 0.6 0.7 0.8 0.9 1.0 10,000 10,500 11,000 11,500 12,000 12,500 13,000 13,500 14,000 14,500 15,000 15,500 2023 2024 2025 2026e +3.4% (+455) ▸ Capesize trade is forecast to grow 3.4% y/y FY26 ▸ Market Drivers ▸ Iron Ore ▸ Coal ▸ Bauxite ▸ Supply is forecast to grow only by 1.7% y/y FY26 ▸ OB/F ratio of 13.93% with remaining limited yard capacity ▸ Multi-year high average age of 12.5 years (highest since 1993) ▸ Dry docking congestion due to third special survey (465 Capes in 26/27 = ~2% p.a. ) ▸ Congestion in April trended upwards above the 5-year average level and past two years Bn Ton-Miles CATEGORY Active Ships Ships NB Orders YTD Growth 2026 Growth 2027 VLOC 261 42 2 -0.2% 3.1% Cape 1,667 287 35 1.7% 4.2% BabyCape 136 2 0 -0.0% -1.2% TOTAL 2,064 331 37 1.7% 3.6% LNG-to-Coal deep-dive next slide + =
  15. 18 © 2026 – CMB.TECH Public presentation : do not

    replicate or distribute without the prior written permission of CMB.TECH FREIGHT IMPACT OF GAS TO COAL SWITCHING DEMAND GROWTH SCENARIOS VERSUS SUPPLY Operation Epic Fury and gas-to-coal switching INITIAL SITUATION ► In the Pacific, coal flows - a major driver of demand for the segment, is expected to shrink y/y over the second half of 2026 ► Coal in Power Generation was forecast to contract y/y in Europe & JKT EUROPE & JKT (Japan, South-Korea, Taiwan) ► Continued high Oil & LNG prices can be a big swing factor to the coal trade forecast for H2 2026 ► JKT coal capacity and utilisation increase from 57% to 67%, increasing seaborne arrivals with +27 MMT (current scenario) ► Europe coal capacity and utilisation increase from 39% to 55%, increasing seaborne arrivals by +12 MMT (current scenario), or +70 MMT (high case) BOCIMAR 1.7 4.9 3.0 3.8 3.5 5.1 5.2 7.5 Capesize Panamax Panamax Fleet Supply growth Base case (no Iran war / no Strait of Hormuz closure) Current scenario High case In % 25.6% 20.5% 12.8% 12.8% 12.8% Australia Colombia Indonesia Russia Sub- Saharan Africa 7.7% USA 7.7% Canada Source: Own data representation based on: Arrow, Commodore Research
  16. 19 © 2026 – CMB.TECH Public presentation : do not

    replicate or distribute without the prior written permission of CMB.TECH UPDATED TO INCLUDE STRAIT OF HORMUZ IMPACT CAPESIZE (MMT PER QUARTER in 2026) PANAMAX/KAMSARMAX (MMT PER QUARTER in 2026) FY 2026 Capesize & Panamax BOCIMAR 364 415 421 437 59 64 65 65 59 53 47 53 10 Q1 7 Q2 7 Q3 8 Q4 Minor Bauxite Coal Iron Ore 492 539 540 563 ▸Strong iron ore volumes further strengthened by seasonal ramp- up as of Q2 2026 (weather pattern Brazil / Australia) ▸Persistent strong bauxite volumes, tempered seasonally as of Q2/Q3 2026 (weather pattern Guinea) 183 209 221 224 82 83 83 75 49 42 48 52 23 25 28 27 19 20 21 15 Q1 Q2 Q3 Q4 Fertilizer Iron Ore Minor Bulk Agribulk Coal 352 378 400 399 ▸ Coal ramp-up and continued strength expected Source: Own data representation based on: Clarksons SIN, AXS Marine
  17. 23 © 2026 – CMB.TECH Public presentation : do not

    replicate or distribute without the prior written permission of CMB.TECH 23 KEY HIGHLIGHTS Q1 2026 SPOT PERFORMANCE ( $ per vessel per day) YOY (MID FEBRUARY 2026) Tankers EURONAV World Oil Demand 2025 Oil Supply, OPEC Oil Supply, non-OPEC OECD Total Crude Oil Stocks China Oil Imports lobal Crude Oil on Water +0.6% -19.6% +0.7% -0.4% +5.4% +7.7% Tanker Fleet Supply +2.9% US Crude Oil Exports -2.2% ▸VLCC trading fleet of 4 VLCCs with 2 x ECO VLCC on order (delivery May 2026 & Jan 2027) ▸Q1 2026 TCE actuals at 70,204 USD/day ▸Q2 2026 TCE quarter to date rates at 182,731 USD/day (81% fixed) ▸Sale of eight VLCCS: Daishan (2007), Hirado (2011), Hojo (2013), Dia (2015), Antigone (2015), Aegean (2016), Ilma (2012) and Ingrid (2012) – all delivered to new owners: ▷ Q1 capital gain of 259.3 million USD ▷ Q2 capital gain of 98.2 million USD Source: Own data representation based on: Breakwave Advisors, AXS Marine 36,512 70,204 182,731 9,232 OPEX P&L Break-even TCE Q1 ’26 Q2 ‘26 TCE-to-date +146,219 26,839 91,849 122,147 9,491 OPEX P&L Break-even TCE Q1 ’26 Q2 ‘26 TCE-to-date +95,308 36,512 55,144 9,232 OPEX P&L Break-even Time Charter Q1 ‘26 +18,632 ▸Suezmax trading fleet of 18 Suezmax vessels on the water ▸Q1 2026 TCE actuals at 91,849 USD/day ▸Q2 2026 TCE quarter to date rates at 122,147 USD/day (83% fixed) ▸Sale of Suezmax Sienna (2007) – capital gain of USD 29.2 million ▸Delivery of Cap Grace (2026) and Cap Joseph – both under 10 Time Chart contract (with profit split) 9,491 26,839 33,905 OPEX P&L Break-even Time Charter Q1 ‘26 +7,066 TCE CALCULATIONS: Budget P&L break-even for 2026: includes OPEX, insurance, ship mgt fees, depreciation, interests, special expenses, arrangement fees & pool fees. OPEX as per 2026 budget
  18. 24 © 2026 – CMB.TECH Public presentation : do not

    replicate or distribute without the prior written permission of CMB.TECH AND HENCE VESSEL VALUES ARE SUPPORTED GOING FORWARD VESSEL NB SUPPLY SIDE FUNDAMENTALS VESSEL AVERAGE AGE AS A PROXY FOR RECYCLING/SCRAPPING Crude orderbook keeps on growing EURONAV ✓ ✓ 2025 2030 0 8 1990 1995 10 2000 11 9 12 2005 13 2010 14 2015 2020 13.0 13.5 13.5 Age (years) 13.0 Suezmax Fleet - Average Age VLCC Fleet - Average Age Total NB: 251 # OB/F: 27.4 % 43% > 15 years 18% > 20 years VLCC ‘BALANCE’ Total NB: 234 # OB/F: 28.1 % 41% > 15 years 20% > 20 years SUEZMAX ‘BALANCE’ 28 68 134 52 32 62 82 37 0 20 40 60 80 100 120 140 160 180 200 220 2026 2027 2028 2029 3 10 2030 Suezmax NB deliveries VLCC NB deliveries 15y average Source: Own data representation based on: Clarksons SIN, AXS Marine
  19. 25 © 2026 – CMB.TECH Public presentation : do not

    replicate or distribute without the prior written permission of CMB.TECH TOTAL STRAIT OF HORMUZ TRANSITS STRAIT OF HORMUZ LOST CRUDE OIL VOLUMES – TANKER IMPACT? Operation Epic Fury and crude oil supply evolution EURONAV -15.0 -5.3 -2.7 Baseline 1.2 Selective passage 4.1 Saudi Yanbu pipeline 1.1 UAE Fujairah pipeline 0.3 Iraq Kirkuk- Ceyhan pipeline 0.7 Floating storage release / Sanction release 1.4 Max export growth US (SPR + add volumes) 1.0 Export growth NOR, BRA, TUR, GUY, CAN, AGO Theoretical balance 2.6 Pre-war surplus Million Barrels Per Day 01- Jan- 2026 01- Feb- 2026 01- Mar- 2026 01- Apr- 2026 01- May- 2026 Total Strait of Hormuz Transits IMPACT VESSEL AVAILABILITY: 115 VLCCs and 24 Suezmaxes trapped in the Persian Gulf, of which 78 laden and 61 ballast, ~38% dark fleet vessels, ~ 108 million barrels of oil at sea trapped IMPACT ON TON (NEGATIVE) AND MILES (POSITIVE): Lost volumes but tonne-mile kicker from a shift from AG to USG (USG–China is x 2.5 MEG–China) & Only 29 VLCCs and 14 Suezmaxes crossed the Strait of Hormuz during the ongoing conflict Lost volumes are being replaced by ‘longer-distance’ volumes = utilization remains largely intact Source: Own data representation based on: Rystad, Clarksons SIN, AXS Marine, Morgan Stanley, Allied, Goldman Sachs, Morgan Stanley
  20. 26 © 2026 – CMB.TECH Public presentation : do not

    replicate or distribute without the prior written permission of CMB.TECH NUMBER OF VLCCs (ballast and loading) TD3C VERSUS TD22 VLCC USG ballasters increasing EURONAV Source: Own data representation based on: Kepler data, Arctic 01-Feb-2026 01-Mar-2026 01-Apr-2026 01-May-2026 0 100,000 200,000 300,000 400,000 500,000 600,000 USD/day BDTI TD3C-TCE: 270,000t Middle East Gulf to China BDTI TD22-TCE: 270,000mt, USG - China 440 460 480 500 400 540 520 560 0 420 # Apr- 25 May- 25 Jun- 25 Aug- 25 Sep- 25 Oct- 25 Nov- 25 Jul- 25 Jan- 26 Feb- 26 Mar- 26 Apr- 26 Dec- 25 Ballast Loaded and floating Ballasters into the Atlantic hit record levels in early April, pushing the West tonnage list to a one year high…albeit SPR releases are supportive for VLCC tonne-mile
  21. 27 © 2026 – CMB.TECH Public presentation : do not

    replicate or distribute without the prior written permission of CMB.TECH DELPHIS CONTAINER VESSELS
  22. 28 © 2026 – CMB.TECH Public presentation : do not

    replicate or distribute without the prior written permission of CMB.TECH ▸4 x super-eco 6,000 TEU ice class container feeder vessels on the water – all operational under a 10-year time charter contract to CMA CGM ▸1 x 1,400 TEU dual fuel NH3 on order to be delivered in October 2026 (Qingdao Yangfan Shipbuilding) – under 15-year time charter contract ▸Middle East conflict has severely disrupted container shipping: the Strait of Hormuz is largely closed, vessel congestion and rerouting are rising, Red Sea/Gulf of Aden security risks persist, and shipping markets strengthened unexpectedly (again) ▸Despite short-term market strength, the outlook for late 2026–2027 is weaker, with slowing global container trade growth, expanding fleet supply, and ongoing macroeconomic pressures expected to soften market fundamentals Source: Own data representation based on Clarksons, Jefferies SCFI EVOLUTION 1.000 2.000 3.000 4.000 5.000 USD/TEU Q1’21 Q2’21 Q3’21 Q4’21 Q1’22 Q2’22 Q3’22 Q4’22 Q1’23 Q2’23 Q3’23 Q4’23 Q1’24 Q2’24 Q3’24 Q4’24 Q1’25 Q2’25 Q3’25 Q4’25 Q1’26 Mid May SCFI Comprehensive Container Freight Rate Index 5-year average 6,760 21,154 29,378 OPEX P&L break-even Time Charter Q1 ’26 +8,224 Containers DELPHIS TCE CALCULATIONS: Budget P&L break-even for 2026: includes OPEX, insurance, ship mgt fees, depreciation, interests, special expenses, arrangement fees & pool fees. OPEX as per 2026 budget KEY HIGHLIGHTS Q1 2026 PERFORMANCE ( $ per vessel per day) Delphis has no spot exposure
  23. 29 © 2026 – CMB.TECH Public presentation : do not

    replicate or distribute without the prior written permission of CMB.TECH BOCHEM CHEMICAL TANKERS
  24. 30 © 2026 – CMB.TECH Public presentation : do not

    replicate or distribute without the prior written permission of CMB.TECH ▸Trading fleet of 8 chemical tankers on the water. Favorable long-term contract exposure: 2 x Pool, 6 x 10-year TC, 6 x 7-year TC ▸Newbuilding orderbook: 2 x product tankers (CH₃OH fitted): 2026; 4 x chemical tankers (NH3 ready): 2028 and; 2 x chemical tankers (NH3 fitted): 2029 ▸Hormuz is critical for organic chemicals (20%+ exposure) despite only ~10% share of global exports, making Asia particularly dependent on Middle East supply ▸Short-term rate support from dislocation/longer sailing distances – however – overall cargo volumes weakened as the Strait of Hormuz remained closed. Overall weaker fundamentals, with demand set to contract (-2.1% in 2026) while fleet growth outpaces it Source: Own data representation based on Clarksons, Jefferies CHEMICAL TANKER TIME CHARTER EVOLUTION Chemical BOCHEM KEY HIGHLIGHTS Q1 2026 PERFORMANCE ( $ per vessel per day) Bochem has limited spot exposure 7,663 18,164 21,458 21,063 OPEX P&L Break-even TCE Q1 ’26 Q2 ‘26 TCE-to-date +2,899 7,663 18,164 19,306 OPEX P&L Break-even Time Charter Q1 ‘26 +1,142 POOL TIME CHARTER TCE CALCULATIONS: Budget P&L break-even for 2026: includes OPEX, insurance, ship mgt fees, depreciation, interests, special expenses, arrangement fees & pool fees. OPEX as per 2026 budget 5.000 10.000 15.000 20.000 25.000 Q1’21 Q2’21 Q3’21 Q4’21 Q1’22 Q2’22 Q3’22 Q4’22 Q1’23 Q2’23 Q3’23 Q4’23 Q1’24 Q2’24 Q3’24 Q4’24 Q1’25 Q2’25 Q3’25 Q4’25 Q1’26 Mid May 1 Year TC 19,999 dwt Stainless Steel 10 year avaerage USD/TEU
  25. 31 © 2026 – CMB.TECH Public presentation : do not

    replicate or distribute without the prior written permission of CMB.TECH WINDCAT OFFSHORE ENERGY
  26. 32 © 2026 – CMB.TECH Public presentation : do not

    replicate or distribute without the prior written permission of CMB.TECH ▸Windcat has 59 CTVs on the water, 4 additional CTVs on order ▸Windcat CTV market operates mainly under short term time charter contracts (3 months up to 5 years) ▸CTV demand strengthened through Q1 with near-full booking for 2026 and stable-to-firming day rates, supported by strong maintenance demand, preference for larger vessels, and disciplined supply growth limiting overcapacity risk ▸For Q1 2026, Windcat CTV achieved a TCE of 2,609 USD/day. Q2 TCE forecast of 3,414 USD/day (91.4% utilisation) 15,107 32,286 64,837 62,301 OPEX P&L break-even TCE Q1 ’26 Q2 ’26 TCE-to-date +30,015 1,553 1,949 2,609 3,414 OPEX P&L break-even TCE Q1 ’26 Q2 ’26 TCE-to-date +1,464 Source: Own data, Clarksons Offshore wind, oil & gas WINDCAT ▸Windcat took delivery of the third CSOV Windcat Haarlem ▸Still three CSOVs and one CSOV XL on order ▸Tight near-term market with CSOV demand remained strong with near-full utilisation and firming rates (USD 58–67k/day, >USD 70k peaks), supported by offshore wind and oil & gas activity ▸Constructive outlook with solid demand drivers persisting (wind O&M, energy security, O&G), but 20+ newbuild deliveries risk easing market tightness into winter 2026 ▸For Q1 2026, Windcat CSOVs achieved a TCE of 64,837 USD/day. Q2 TCE forecast at 62,301 USD/day (100% fixed) TCE CALCULATIONS: Budget P&L break-even for 2026: includes OPEX, insurance, ship mgt fees, depreciation, interests, special expenses, arrangement fees & pool fees. OPEX as per 2026 budget, CSOV at 85% utilization KEY HIGHLIGHTS Q1 2026 PERFORMANCE ( $ per vessel per day)
  27. Q&A ► If you would like to ask a question,

    please raise your hand. ► Introduce yourself & unmute before asking your question. ► If you can’t unmute, please use the Q&A section to ask your question. ► For telephone participants, please type *5 to raise your hand and *6 to unmute. ► If you have any follow-up questions, please send an e-mail to [email protected]