What do planning decision-time statistics actually measure? This briefing examines 37,249 major and minor residential application decisions in England between 1 April 2025 and 31 March 2026, using MHCLG's PS2 open data.
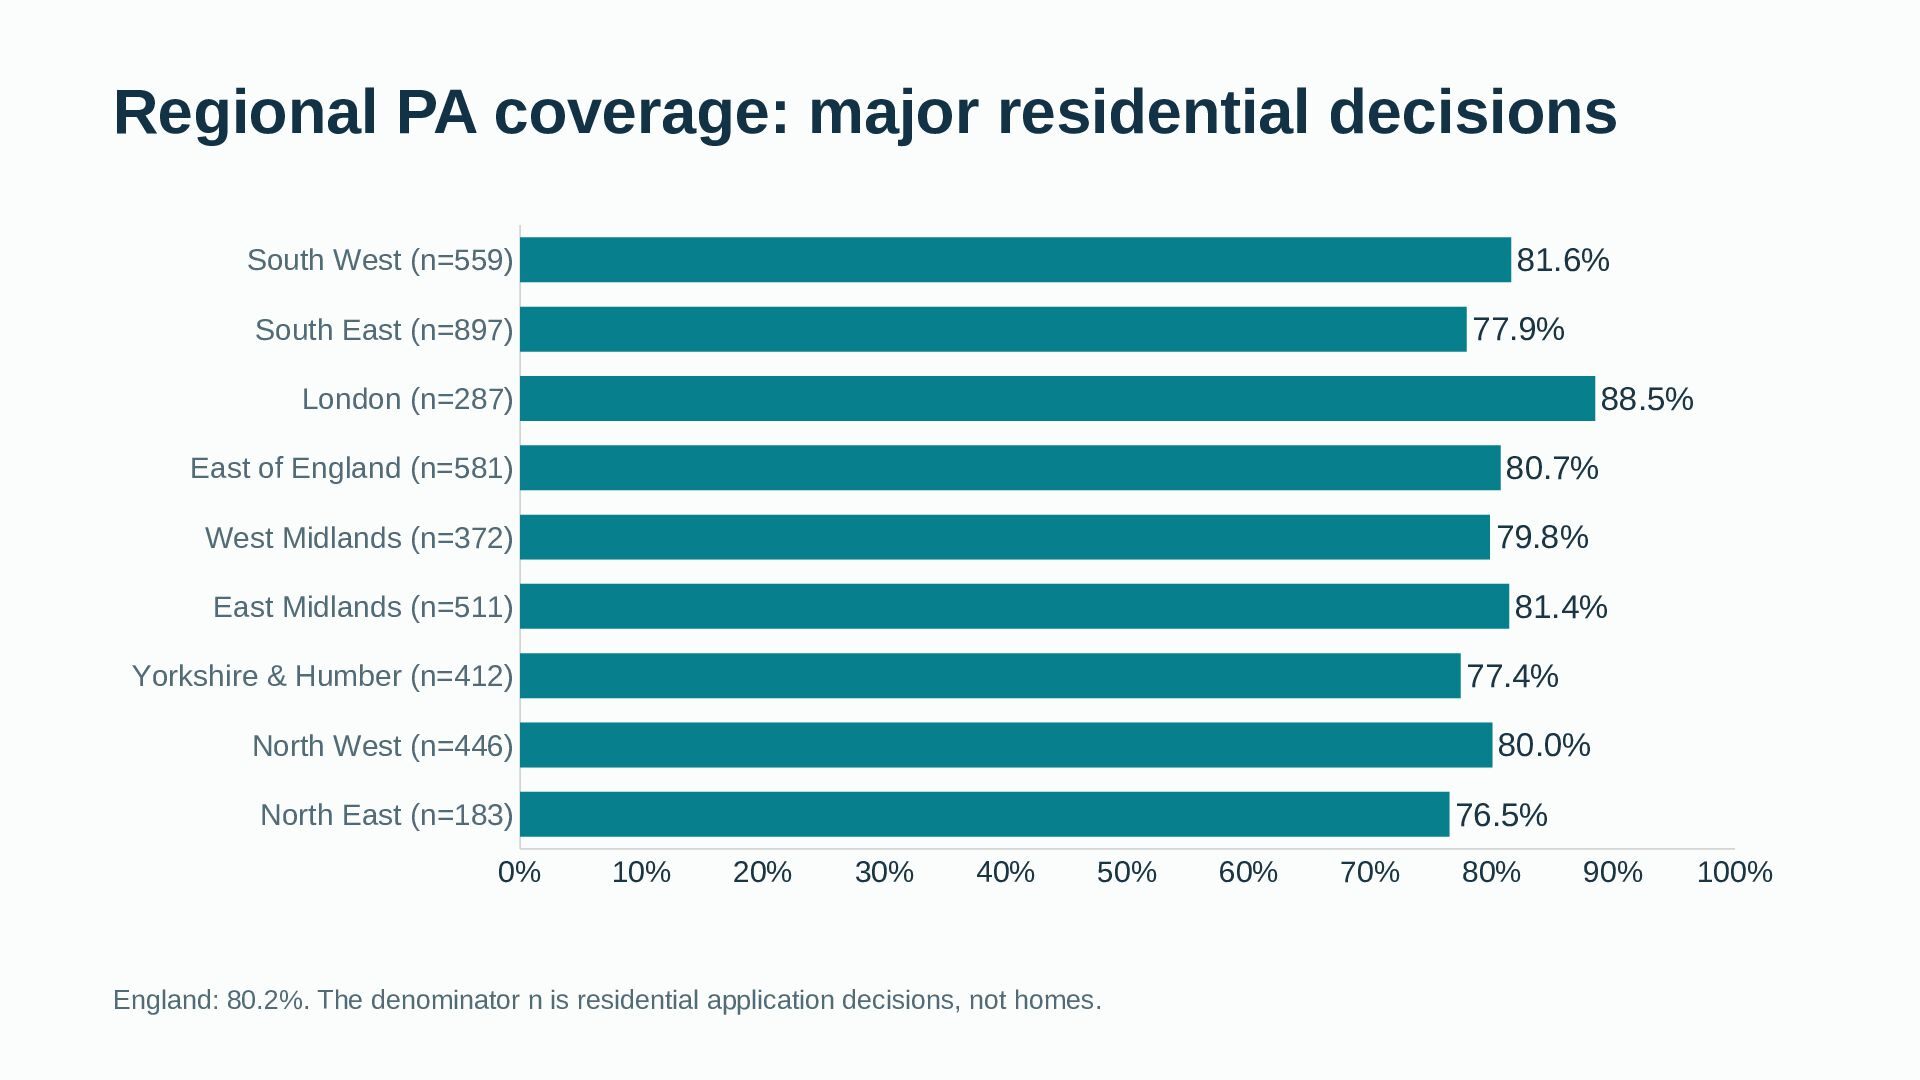
The analysis compares England with all nine regions and tracks the four quarters separately. It shows how the PA category, which includes Planning Performance Agreements, Extensions of Time and Environmental Impact Assessments, changes the population covered by the detailed elapsed-time bands. National Parks remain separately identified in the backing data.
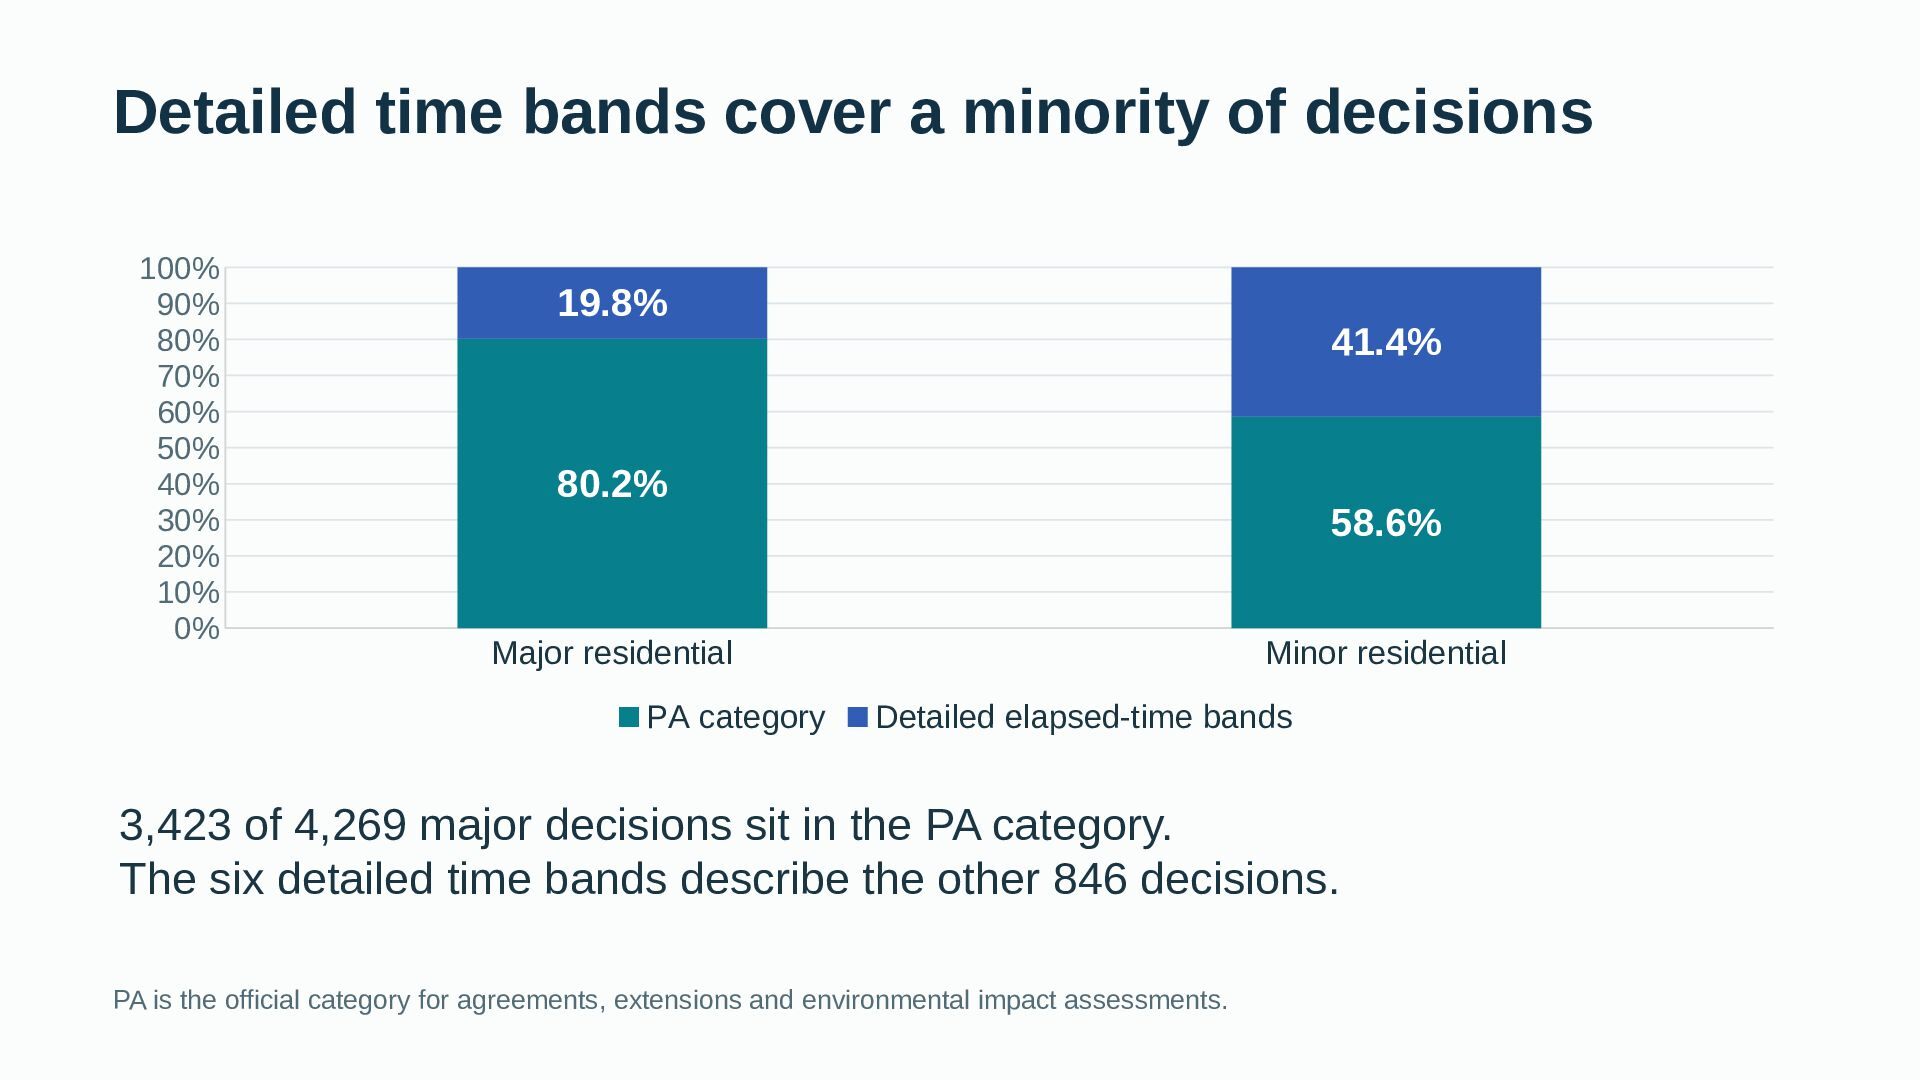
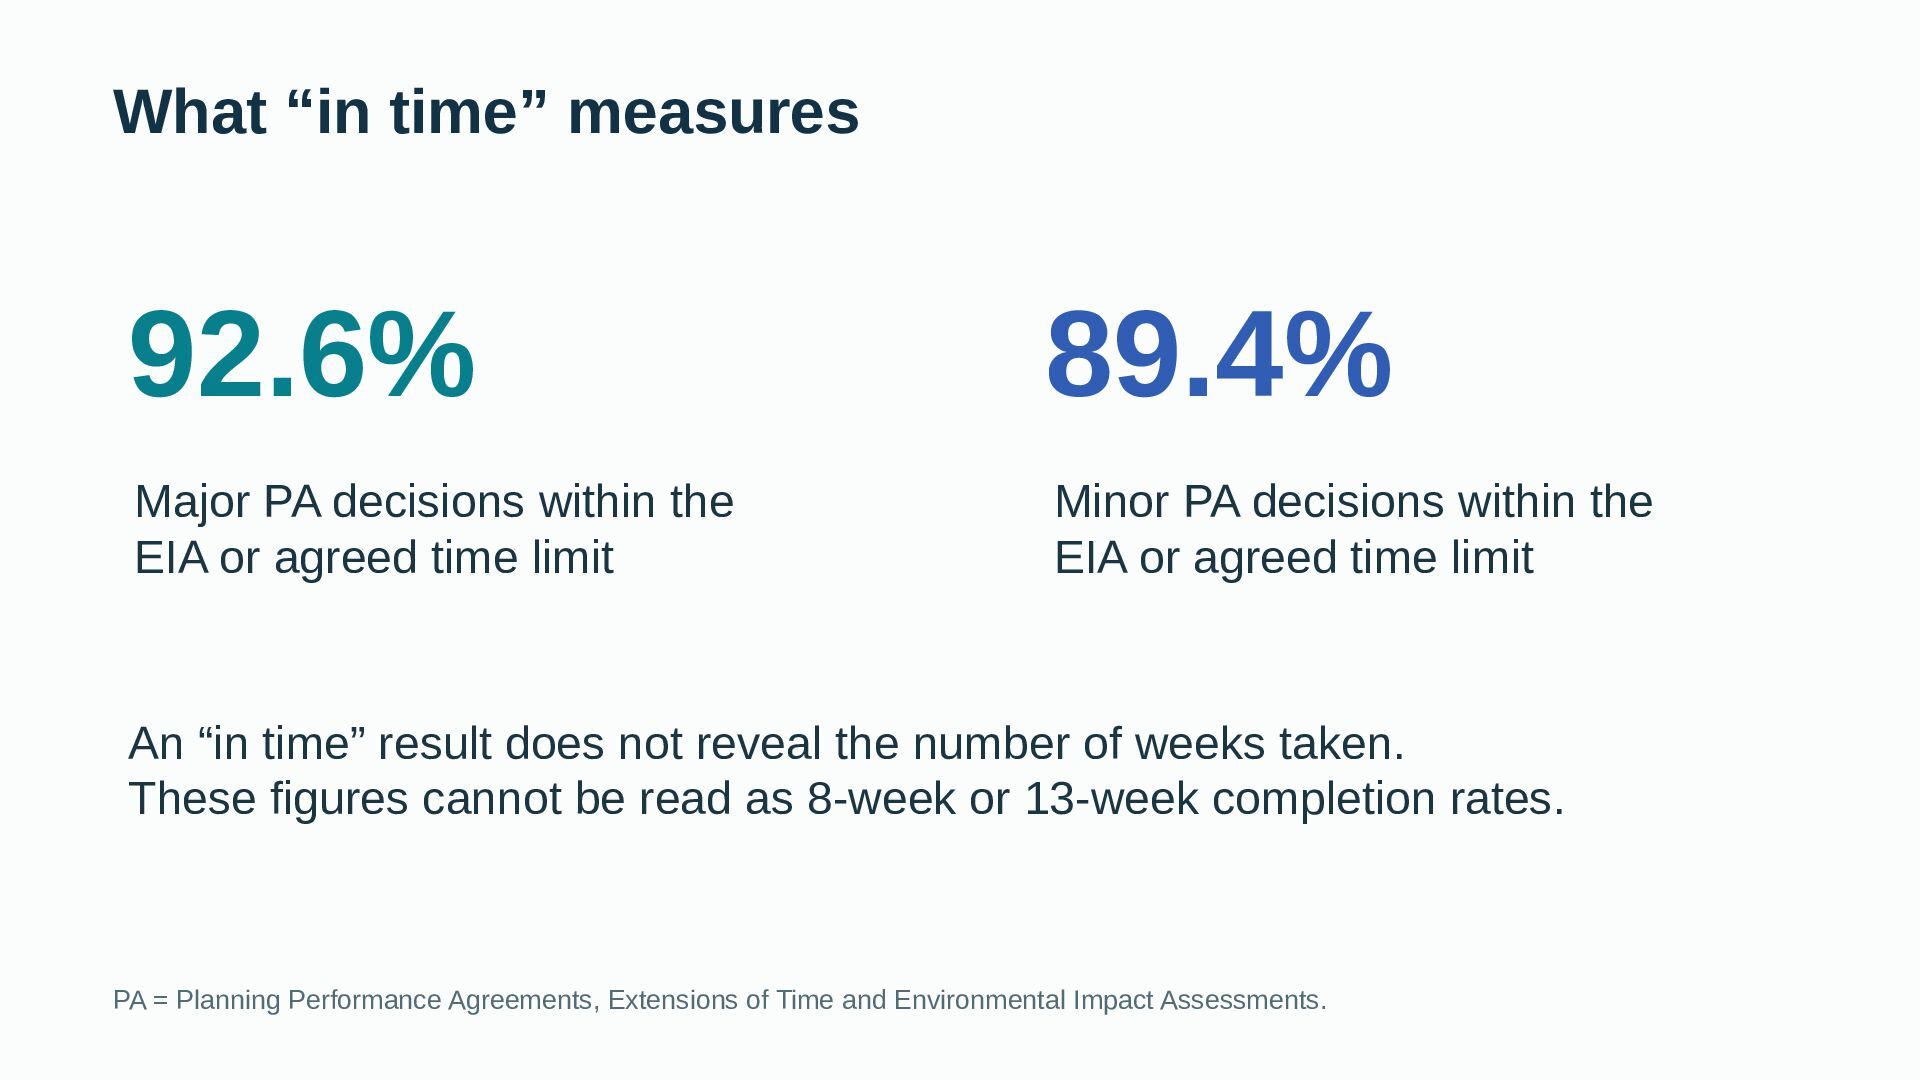
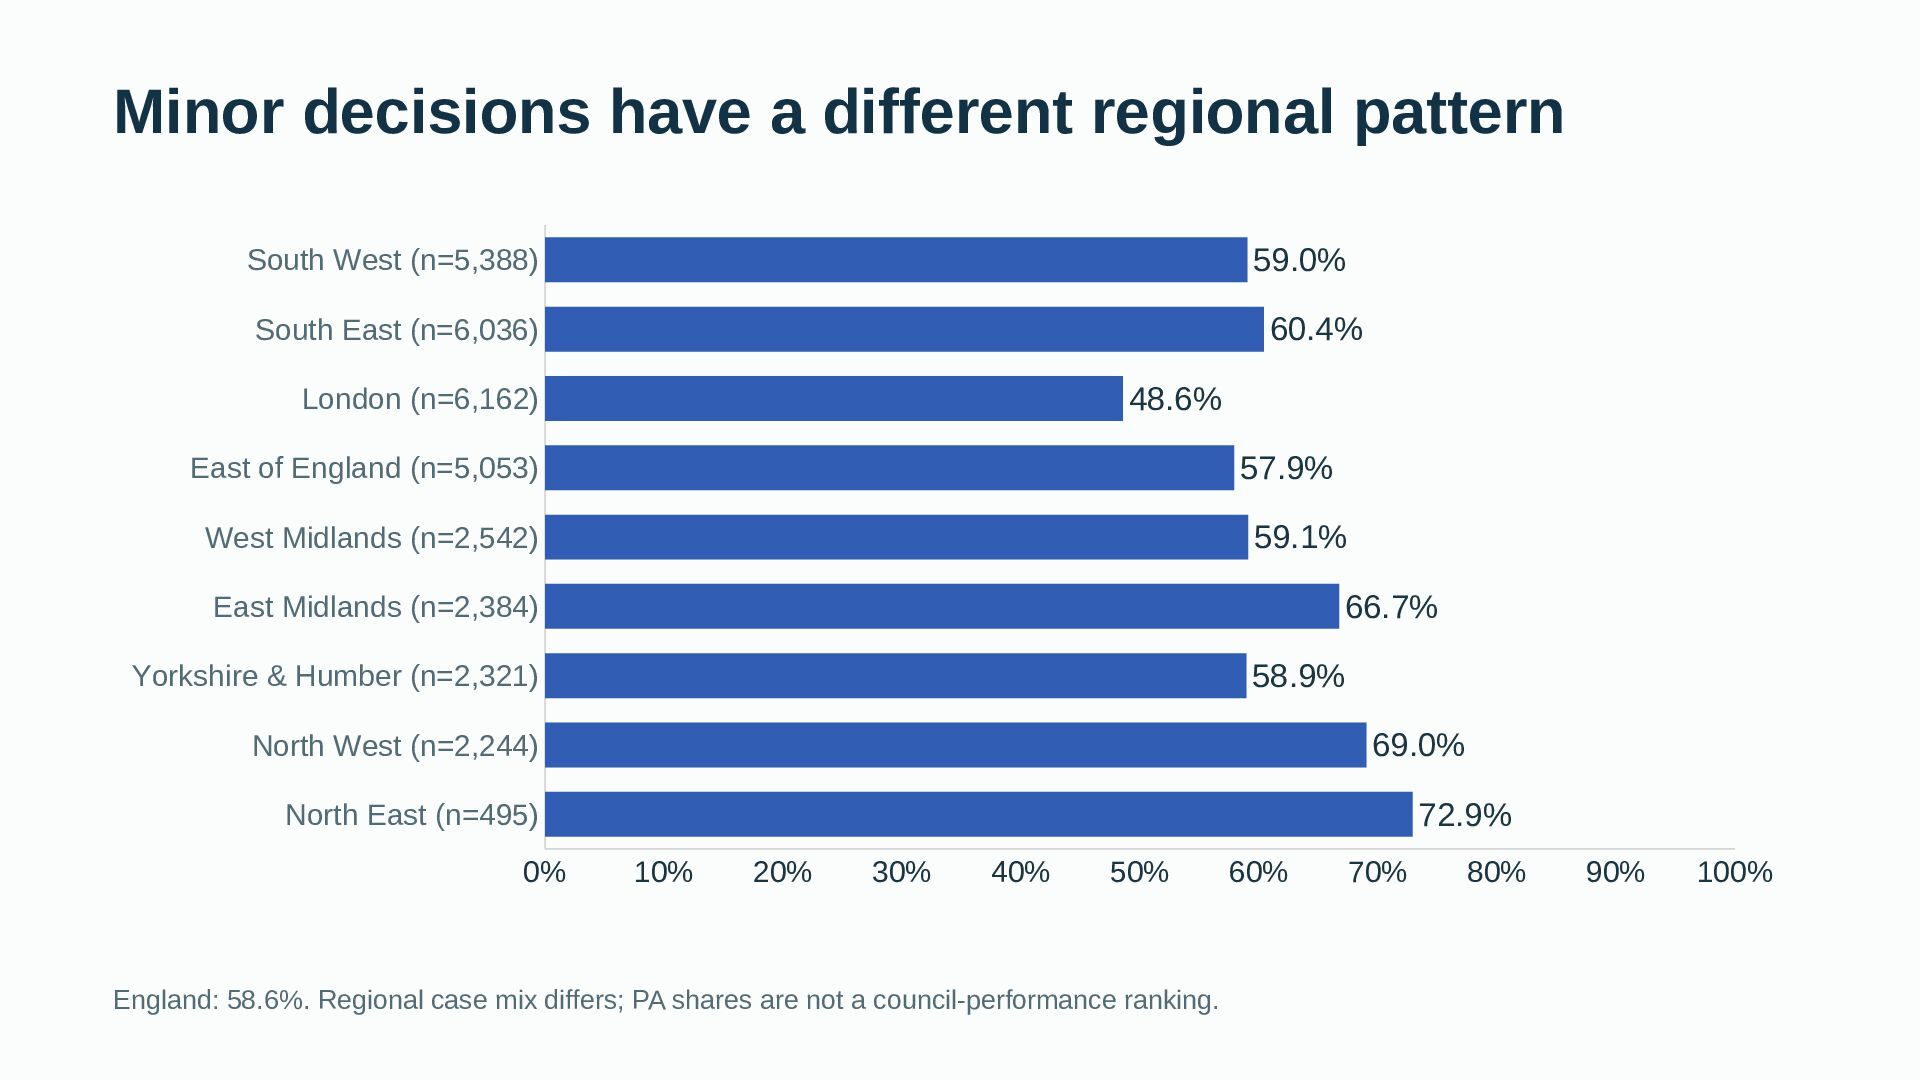
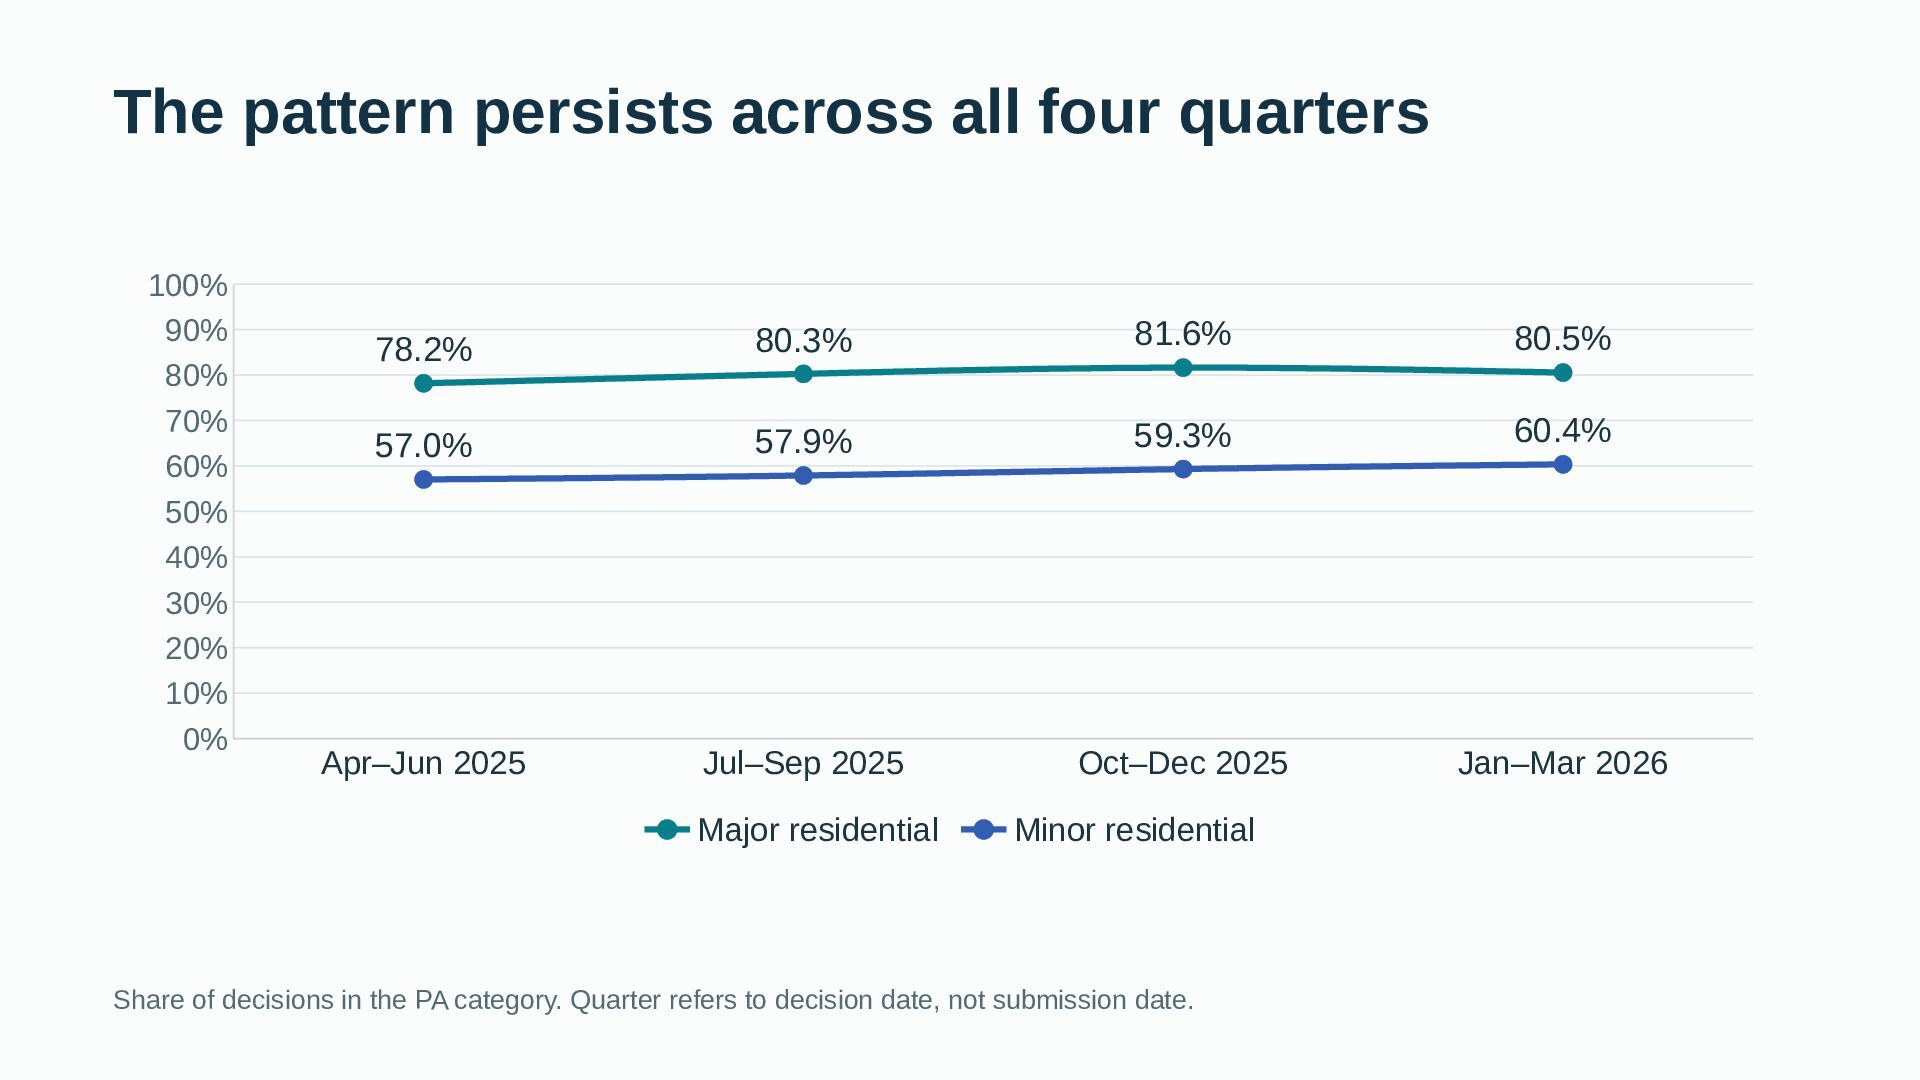
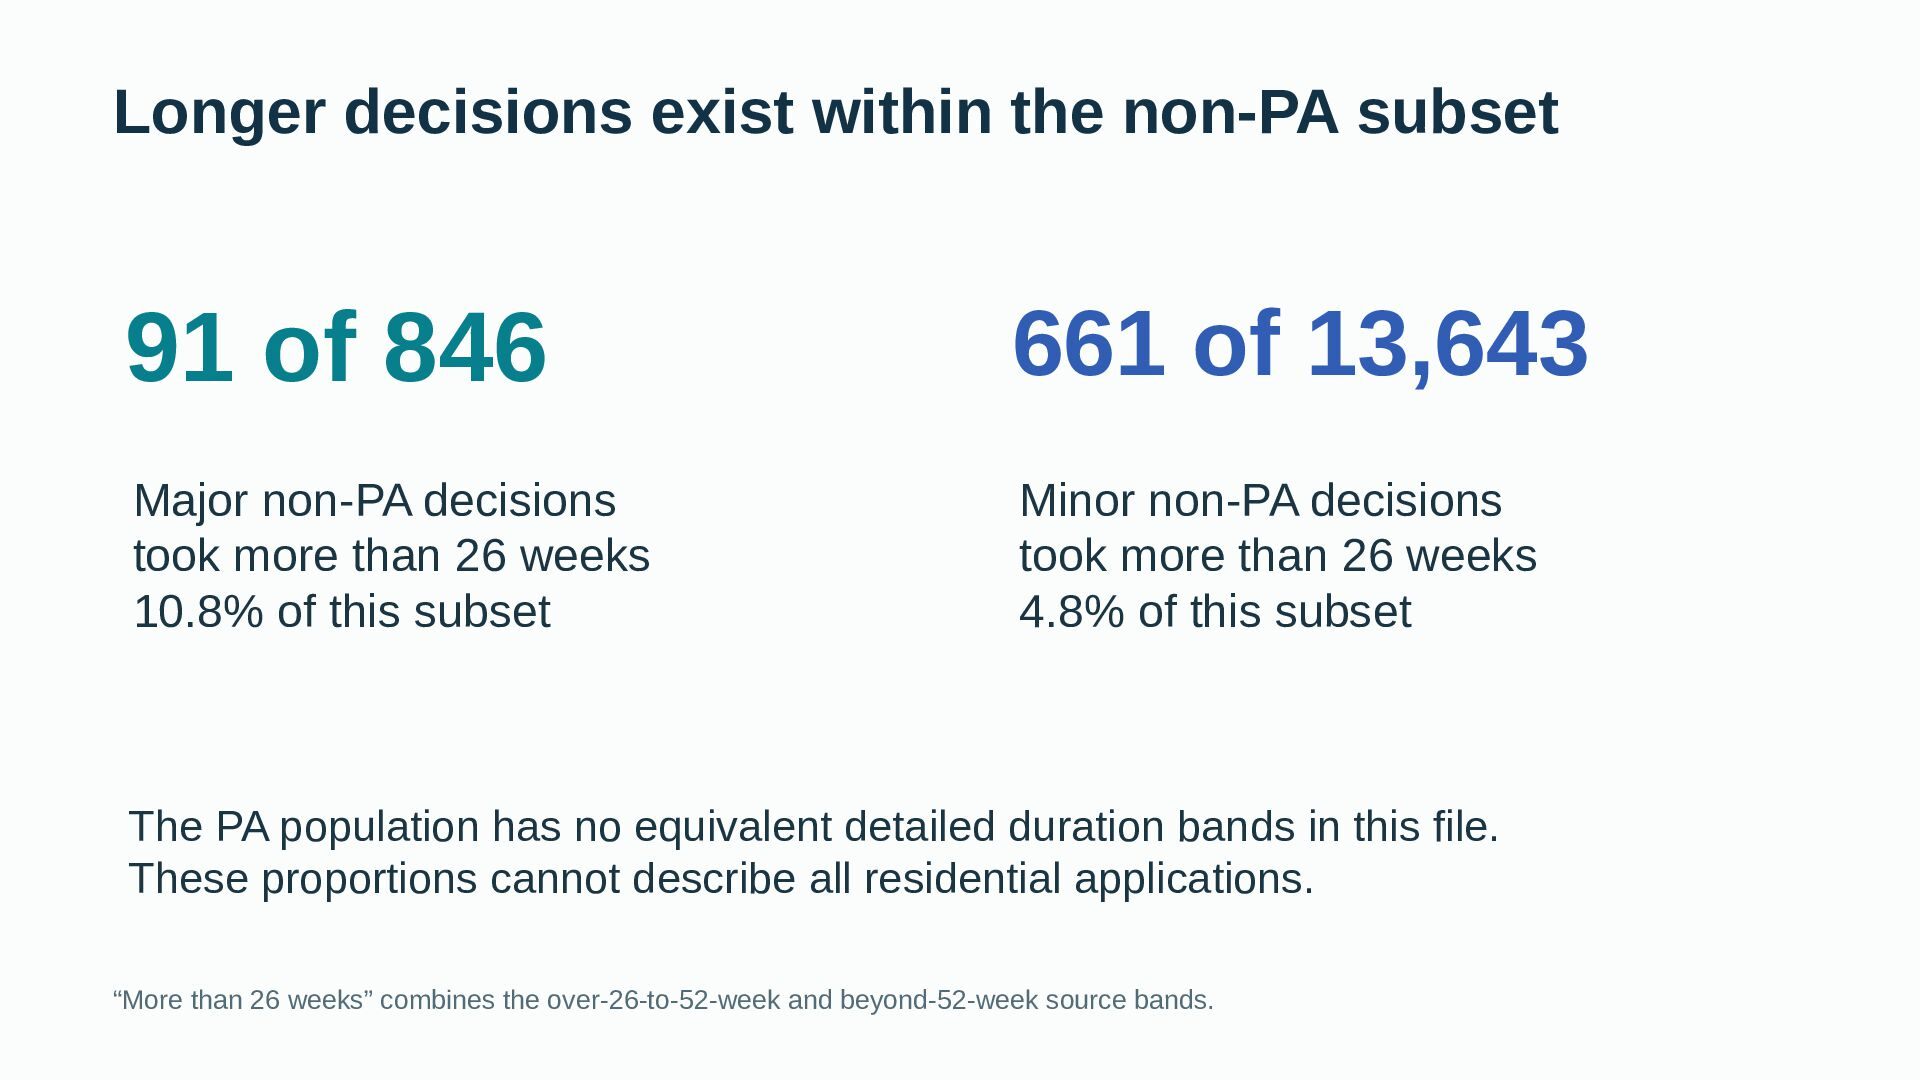
80.2% of major residential decisions and 58.6% of minor residential decisions were in the PA category. Those shares are not delay rates. Detailed time bands cover the non-PA subset and cannot establish the average waiting time for all applications.
The backing-data archive contains the original source CSV, three derived datasets, calculation code, methods, a claim ledger and checksums. The MHCLG source release and reporting guidance explain the collection and definitions.
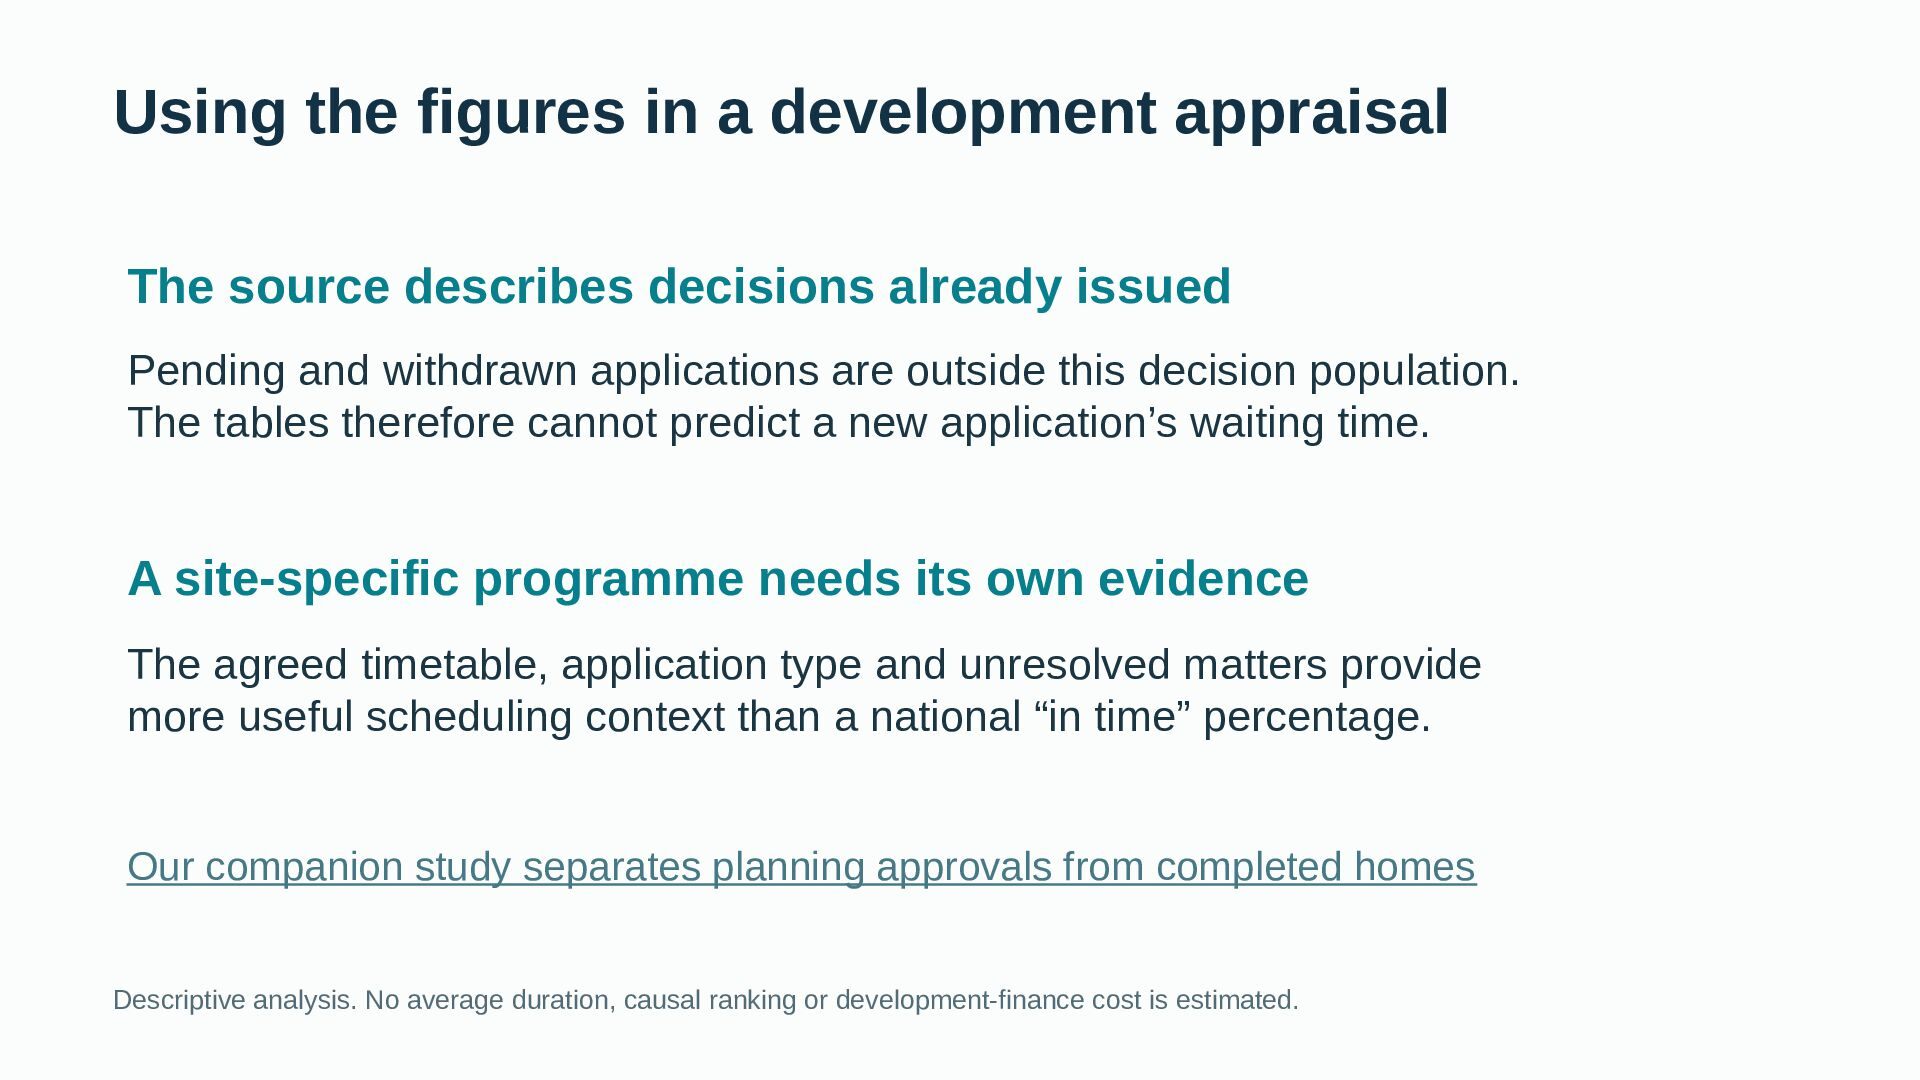
For the distinction between planning decisions and delivered homes, see our companion housing-pipeline study. Construction Capital's wider market reports provide the broader property-market context.
Author: Matt Lenzie, Construction Capital, a commercial property-finance business. This descriptive analysis shares an official source vintage with the companion study and does not constitute independent corroboration or peer review. Original public-sector information: OGL v3.0. Derived work: CC BY 4.0.


 constructioncapital
 fr0gger
 satai
 microbaseinc
 institutdelelevage
 signer
 gpeyre
 wataruuuuu
 izumiyama_lab
 reokashiwa
 kzmssk
 aleyda
 nwiizo
 palkan
 swwweet
 csswizardry
 morganepeng
 kastner
 reverentgeek
 soysaucechin
 inesmontani
 addyosmani