Upgrade to Pro — share decks privately, control downloads, hide ads and more …

The regional planning gap: Q3 2026

The regional planning gap: Q3 2026

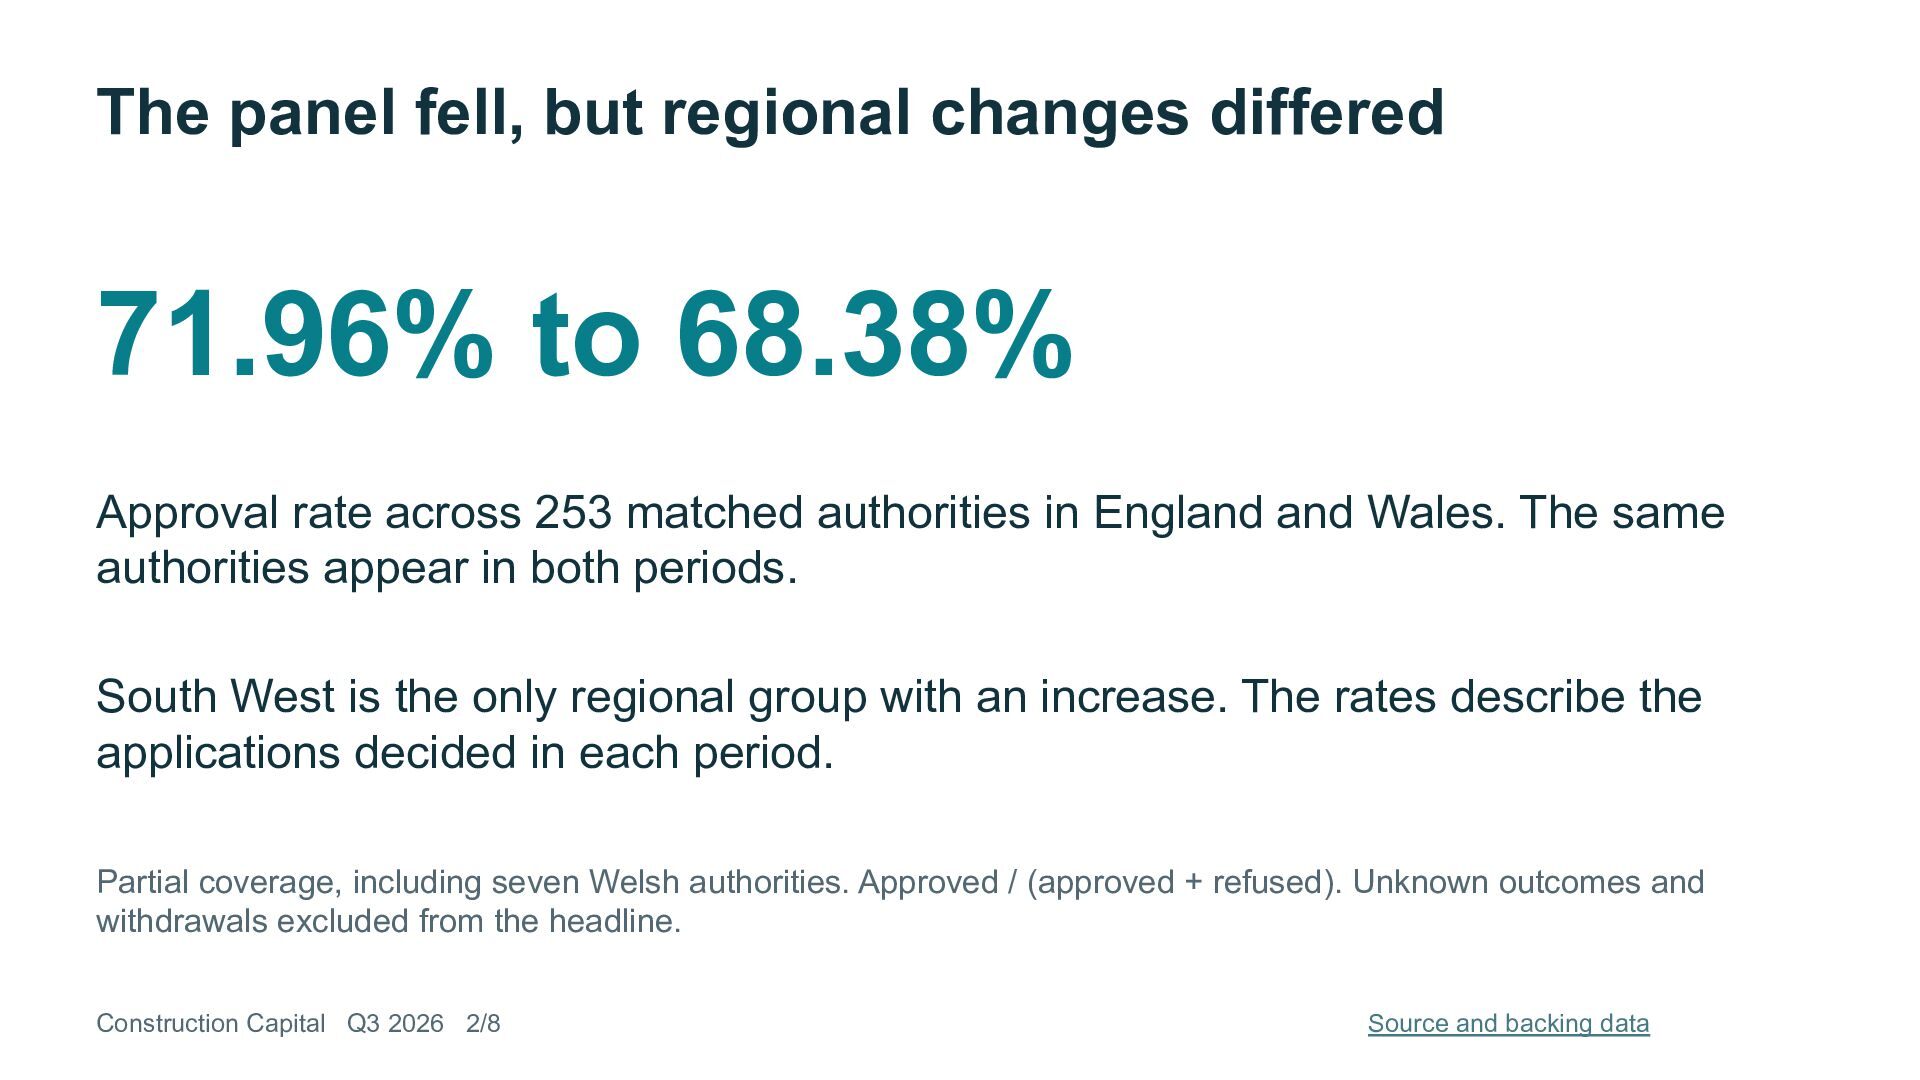
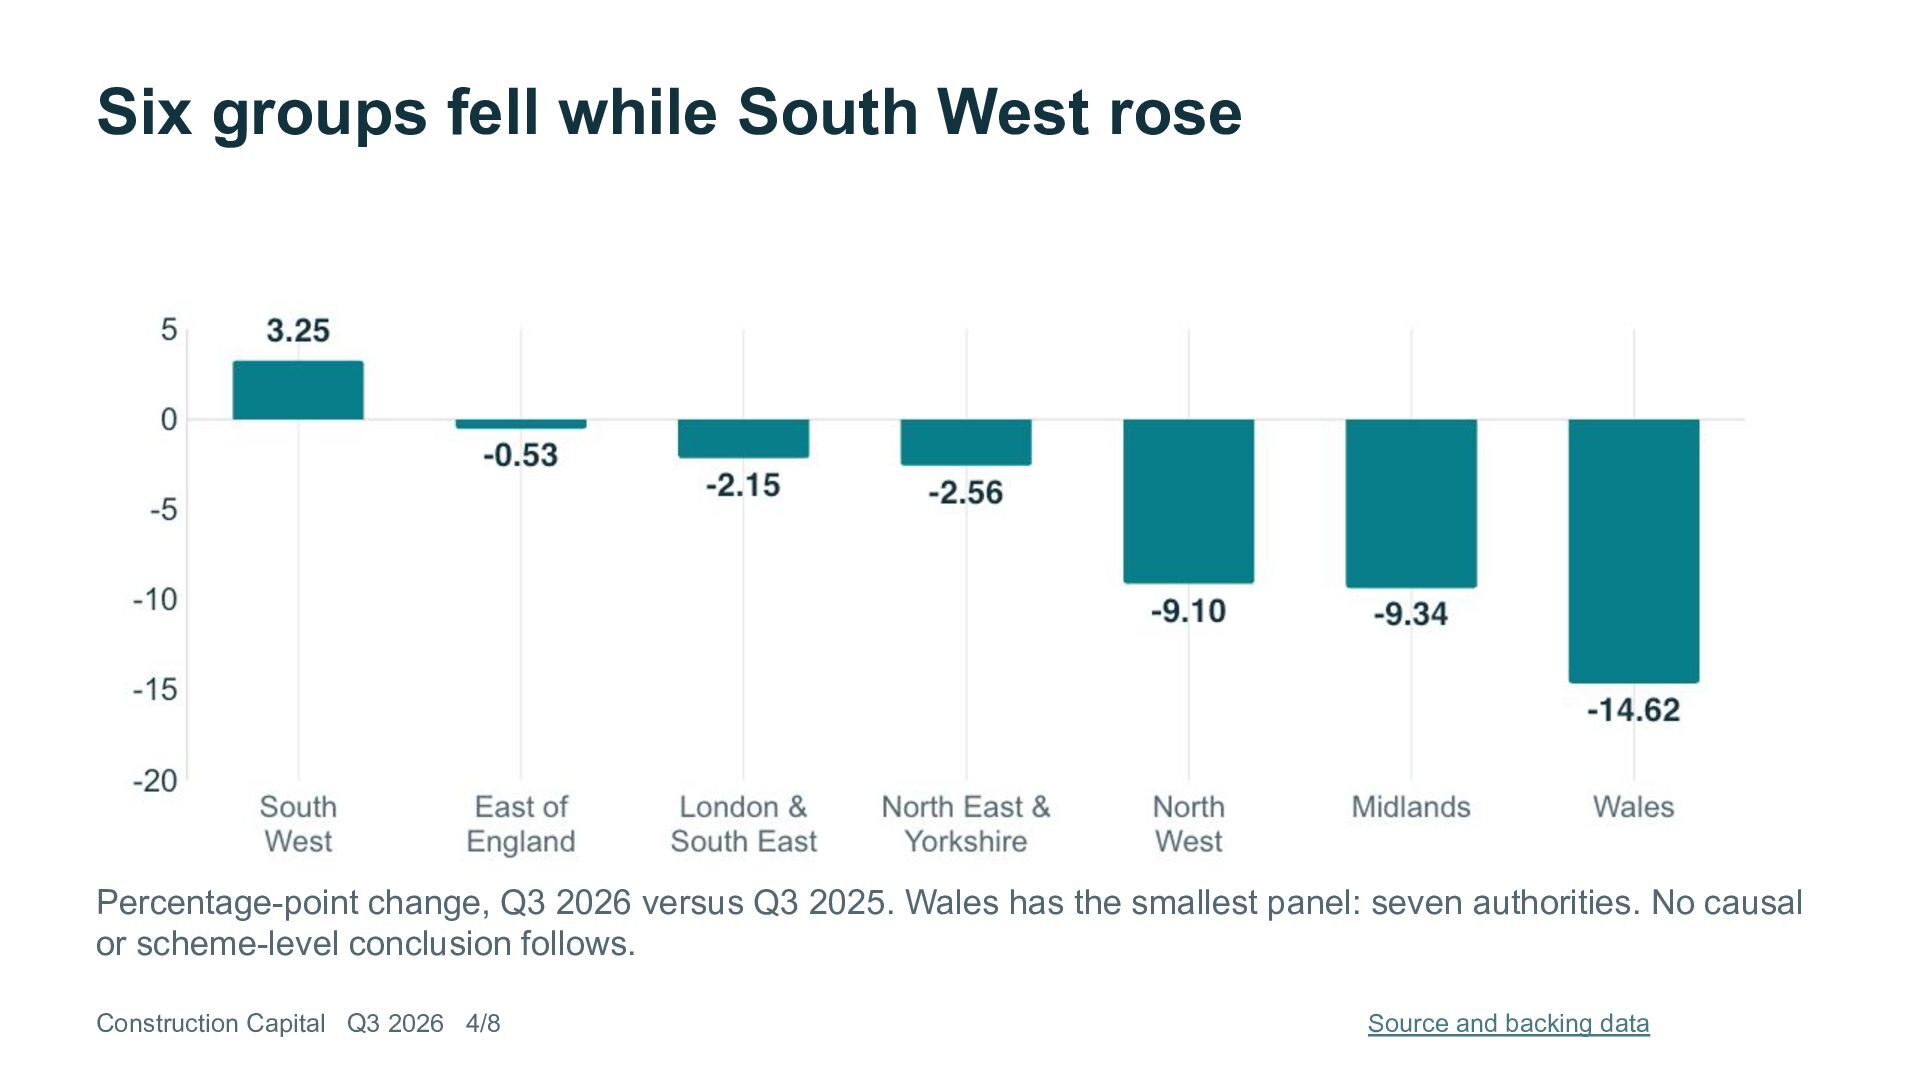
Approval rates diverged across seven regional groups in Construction Capital’s matched panel of 253 authorities in England and Wales. South West was the only group with an increase, from 75.84% in Q3 2025 to 79.09% in Q3 2026. The full-panel rate fell from 71.96% to 68.38%.

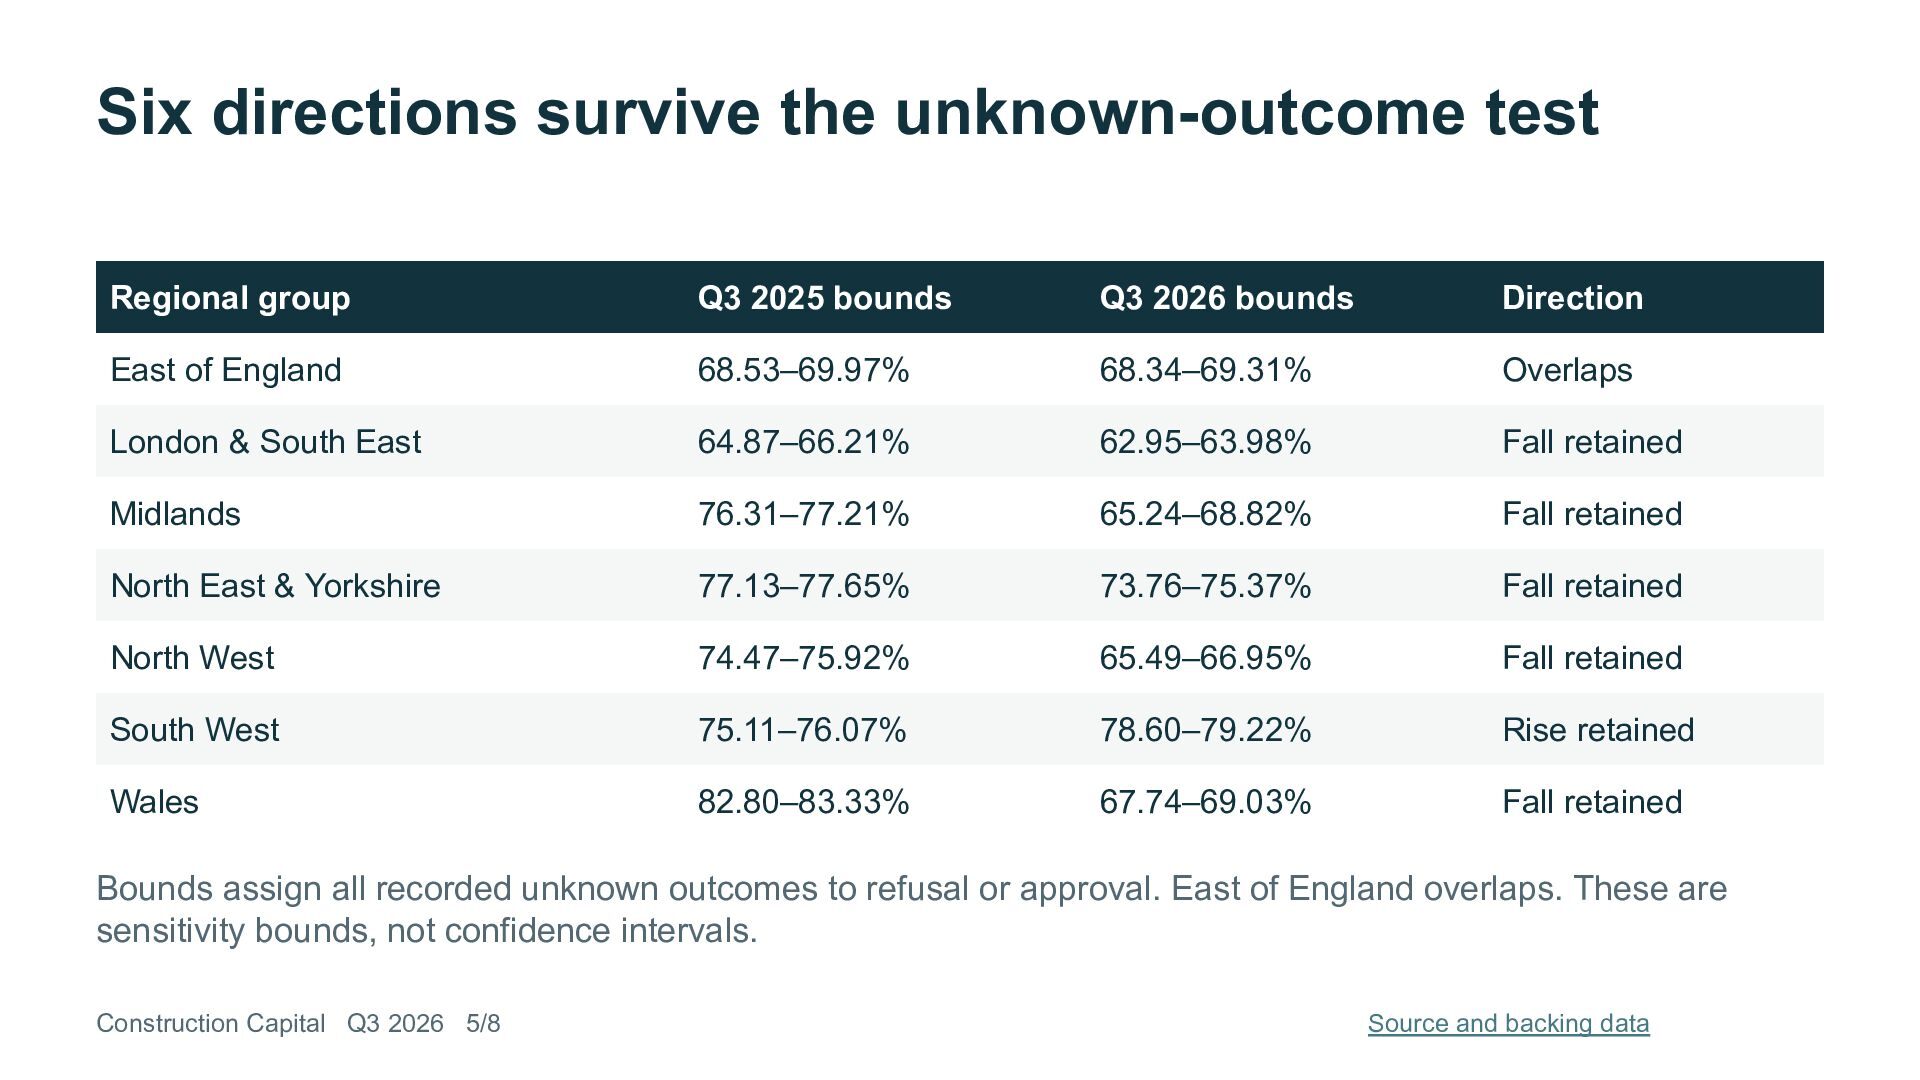
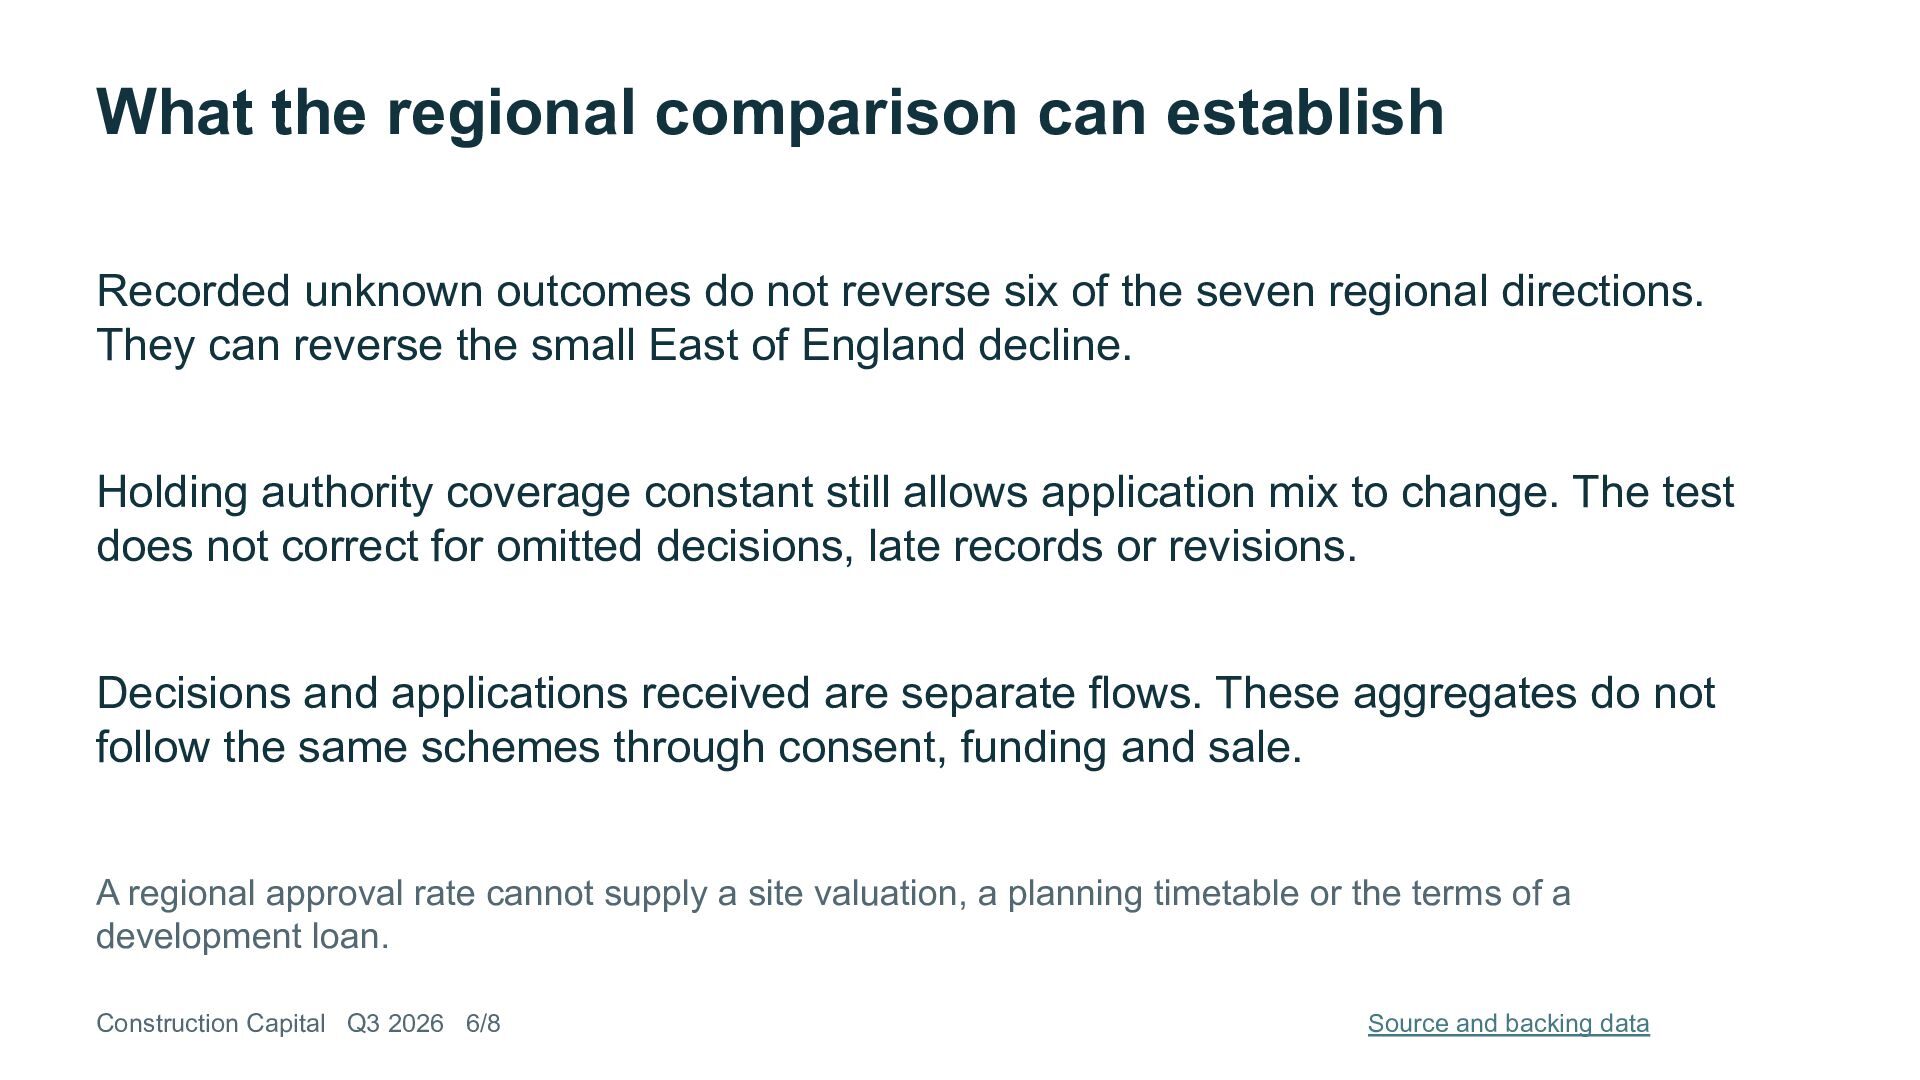
This eight-slide presentation tests whether recorded unknown outcomes could reverse each regional direction. Six of seven directions survive the extreme-assignment test. East of England is the exception. These are deterministic sensitivity bounds, not confidence intervals. Coverage is partial, including only seven Welsh authorities. The comparison does not estimate a particular scheme’s chance of consent, and it does not correct for application mix, omitted decisions or later revisions.

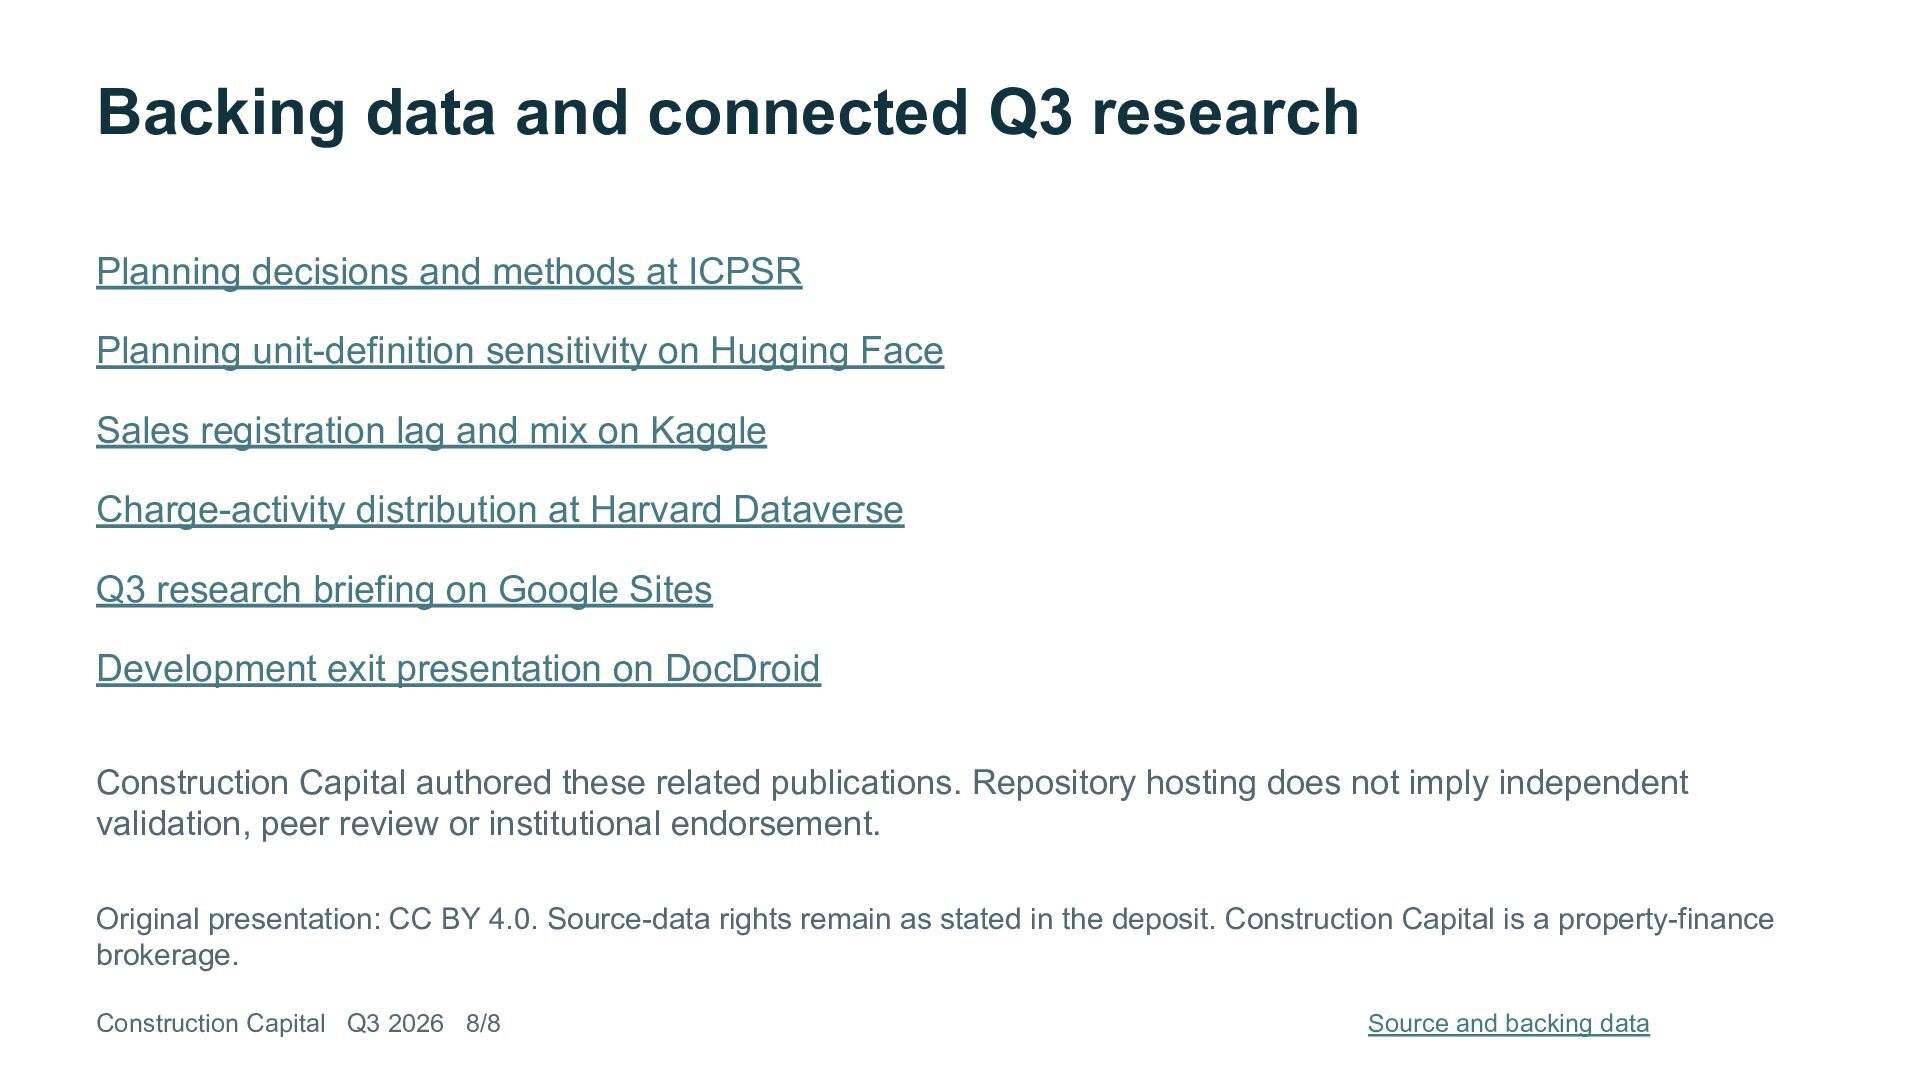
The ICPSR planning release contains the source tables, definitions and code. Download the regional backing-data package for the seven-row comparison, source CSV and reproduction script. The Google Slides master provides the same presentation.

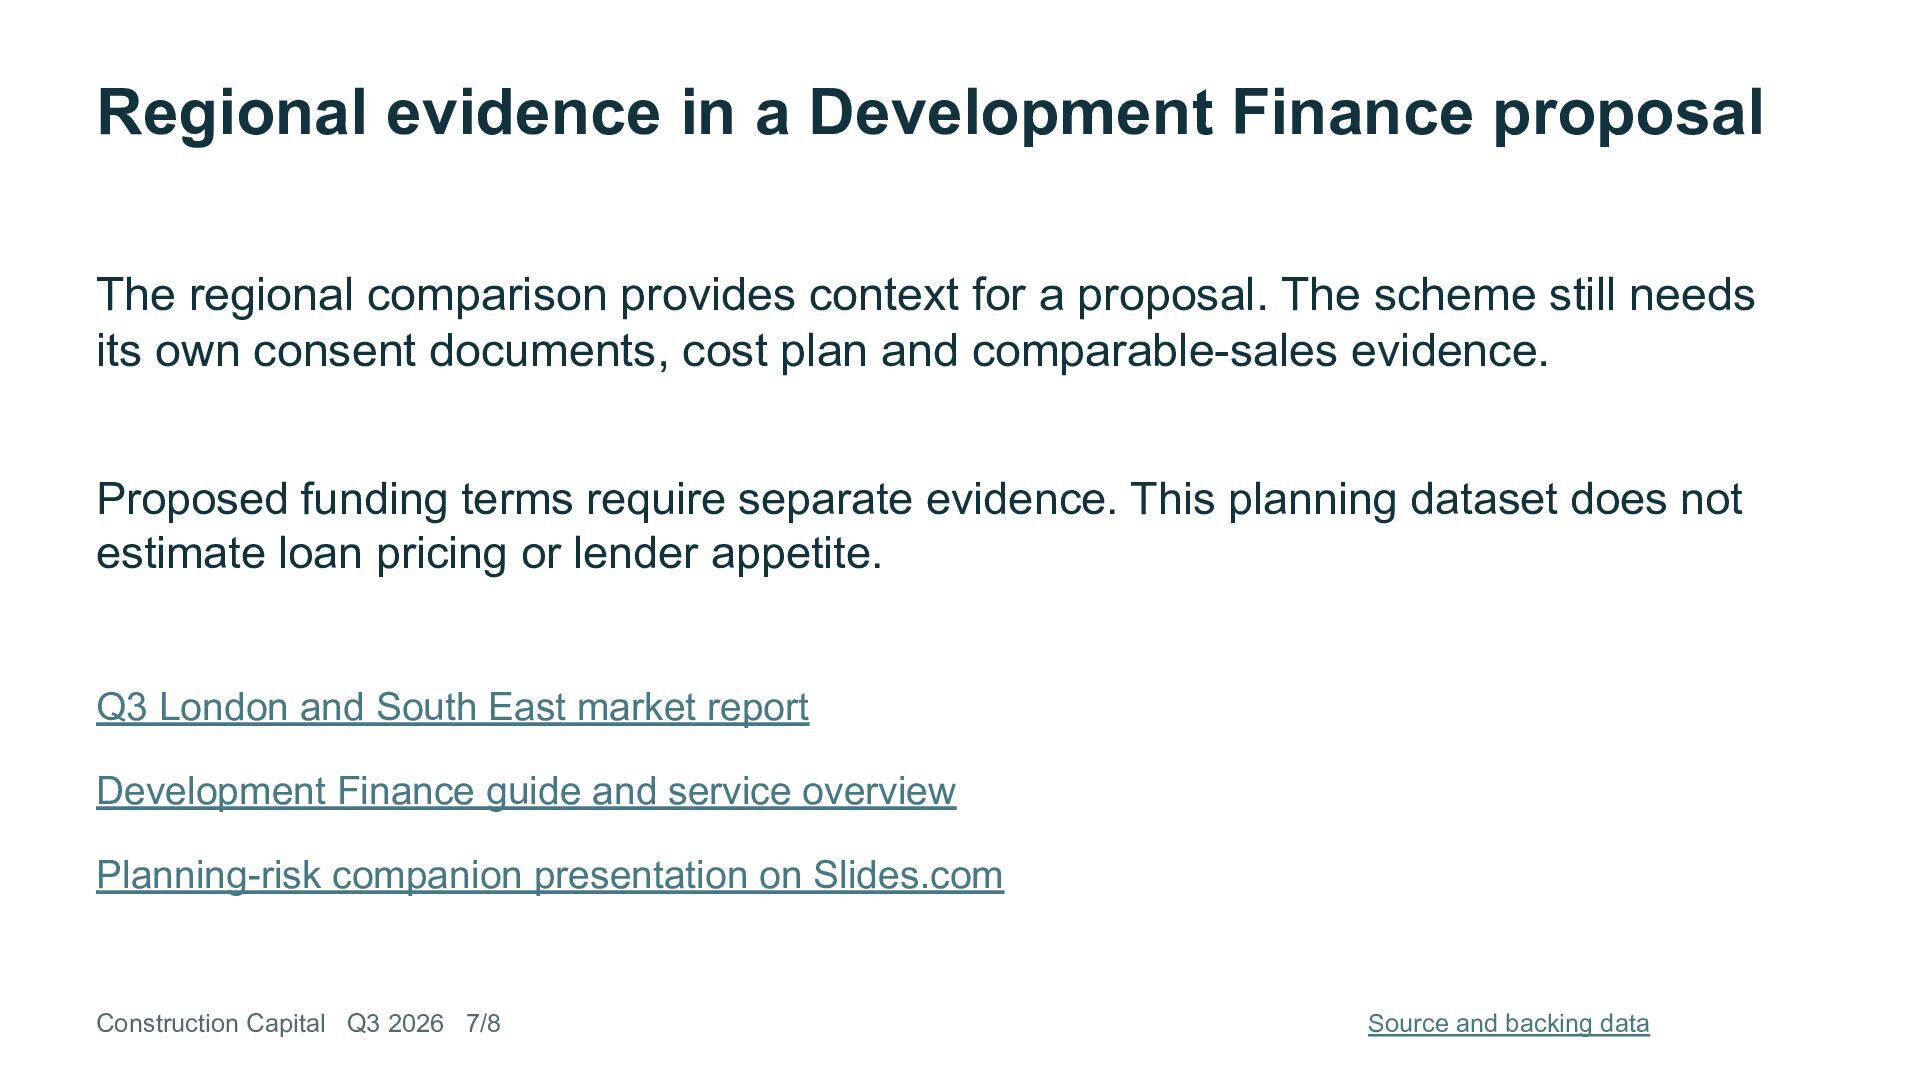
For wider context, see the Q3 London and South East market report. Construction Capital’s Development Finance guide explains how planning documents and other scheme evidence fit a funding proposal. This dataset does not estimate loan pricing or lender appetite.

The planning-risk companion presentation examines approval decomposition and pipeline definitions. The Q3 research briefing connects the planning, sales and charge-activity studies. All share Construction Capital authorship.

Matt Lenzie, Construction Capital. 6 October 2026. CC-DF-2026Q3-P04, a regional adaptation of CC-DF-2026Q3-01. Original presentation text: CC BY 4.0. Source-data rights remain as stated in the deposit. Construction Capital is a property-finance brokerage. Hosting does not imply peer review or institutional endorsement.

More Decks by Matt Lenzie | Construction Capital

Other Decks in Research

Transcript

  1. CONSTRUCTION CAPITAL RESEARCH The regional planning gap Approval rates and

    recorded unknown outcomes Q3 2025 to Q3 2026 Matt Lenzie 6 October 2026
  2. The panel fell, but regional changes differed 71.96% to 68.38%

    Approval rate across 253 matched authorities in England and Wales. The same authorities appear in both periods. South West is the only regional group with an increase. The rates describe the applications decided in each period. Partial coverage, including seven Welsh authorities. Approved / (approved + refused). Unknown outcomes and withdrawals excluded from the headline. Construction Capital Q3 2026 2/8 Source and backing data
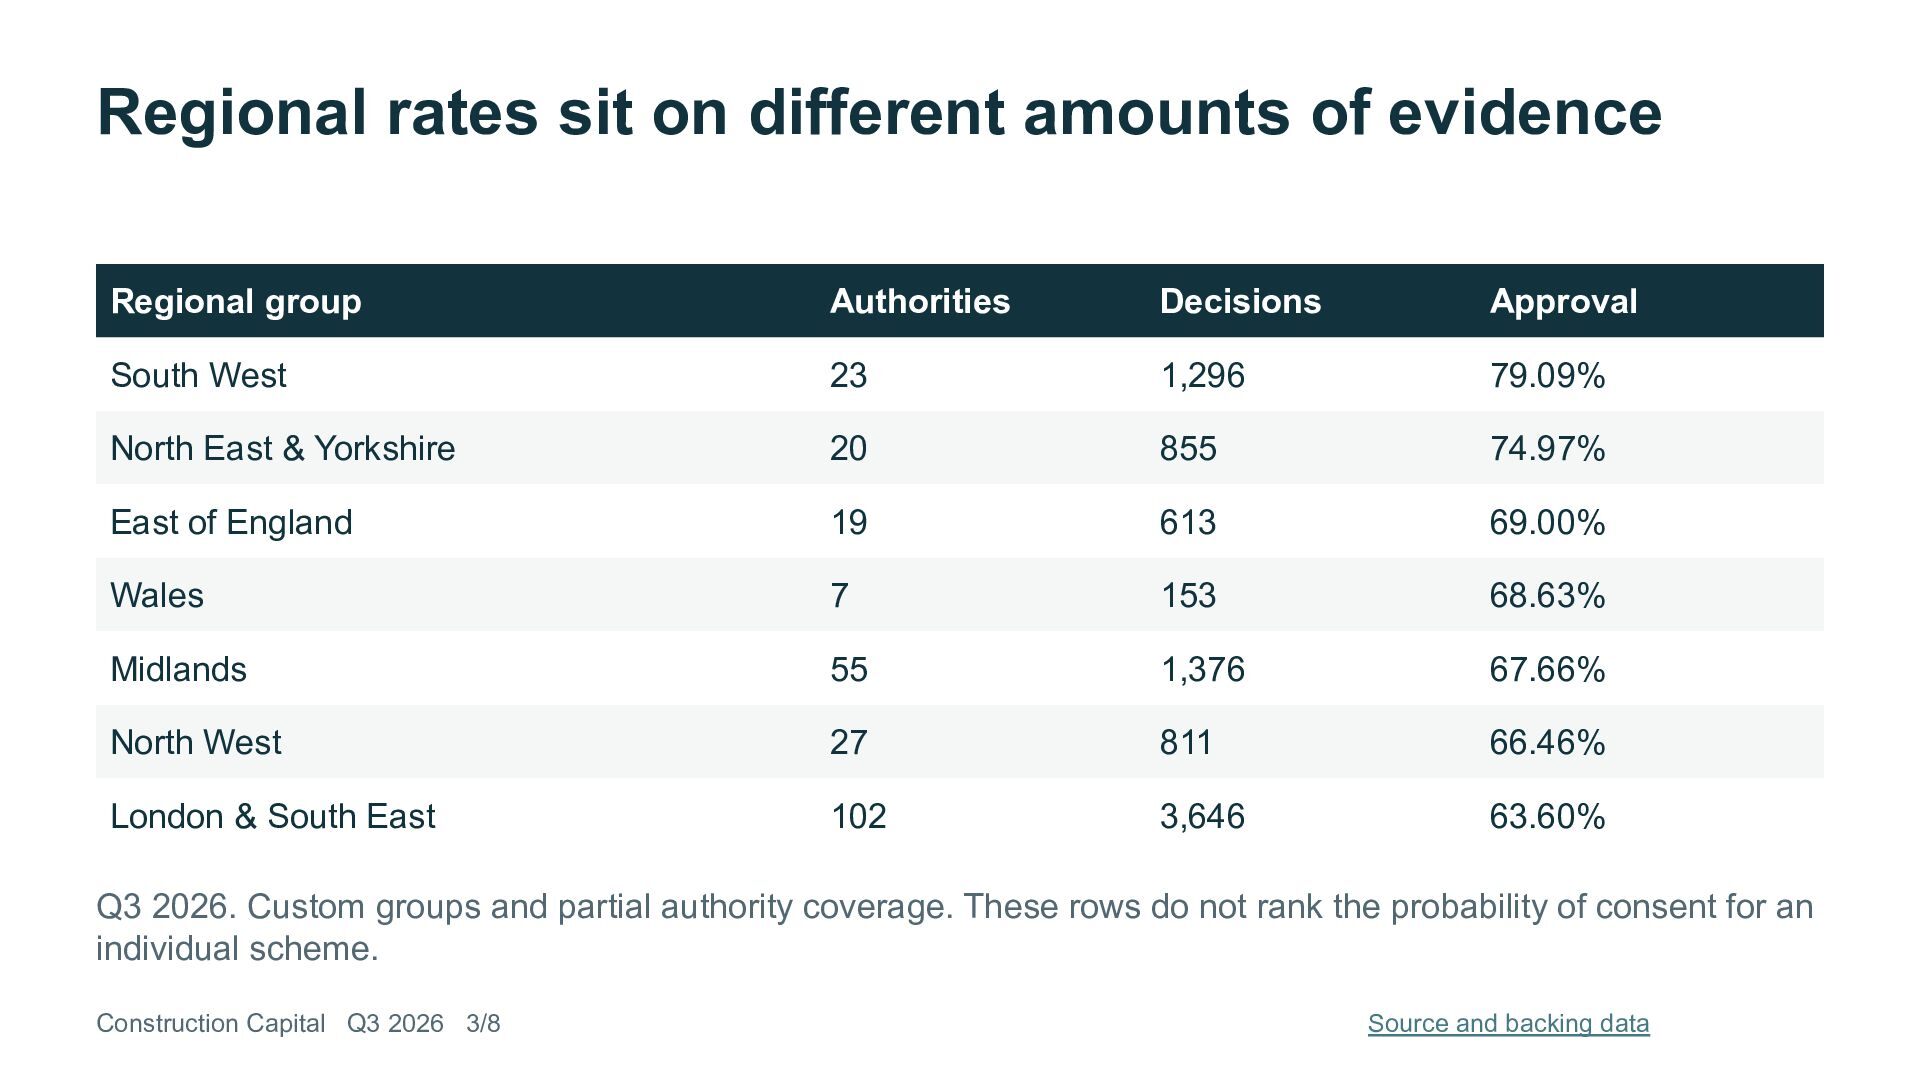
  3. Regional rates sit on different amounts of evidence Regional group

    Authorities Decisions Approval South West 23 1,296 79.09% North East & Yorkshire 20 855 74.97% East of England 19 613 69.00% Wales 7 153 68.63% Midlands 55 1,376 67.66% North West 27 811 66.46% London & South East 102 3,646 63.60% Q3 2026. Custom groups and partial authority coverage. These rows do not rank the probability of consent for an individual scheme. Construction Capital Q3 2026 3/8 Source and backing data
  4. Six groups fell while South West rose Percentage-point change, Q3

    2026 versus Q3 2025. Wales has the smallest panel: seven authorities. No causal or scheme-level conclusion follows. Construction Capital Q3 2026 4/8 Source and backing data
  5. Six directions survive the unknown-outcome test Regional group Q3 2025

    bounds Q3 2026 bounds Direction East of England 68.53–69.97% 68.34–69.31% Overlaps London & South East 64.87–66.21% 62.95–63.98% Fall retained Midlands 76.31–77.21% 65.24–68.82% Fall retained North East & Yorkshire 77.13–77.65% 73.76–75.37% Fall retained North West 74.47–75.92% 65.49–66.95% Fall retained South West 75.11–76.07% 78.60–79.22% Rise retained Wales 82.80–83.33% 67.74–69.03% Fall retained Bounds assign all recorded unknown outcomes to refusal or approval. East of England overlaps. These are sensitivity bounds, not confidence intervals. Construction Capital Q3 2026 5/8 Source and backing data
  6. What the regional comparison can establish Recorded unknown outcomes do

    not reverse six of the seven regional directions. They can reverse the small East of England decline. Holding authority coverage constant still allows application mix to change. The test does not correct for omitted decisions, late records or revisions. Decisions and applications received are separate flows. These aggregates do not follow the same schemes through consent, funding and sale. A regional approval rate cannot supply a site valuation, a planning timetable or the terms of a development loan. Construction Capital Q3 2026 6/8 Source and backing data
  7. Regional evidence in a Development Finance proposal The regional comparison

    provides context for a proposal. The scheme still needs its own consent documents, cost plan and comparable-sales evidence. Proposed funding terms require separate evidence. This planning dataset does not estimate loan pricing or lender appetite. Q3 London and South East market report Development Finance guide and service overview Planning-risk companion presentation on Slides.com Construction Capital Q3 2026 7/8 Source and backing data
  8. Backing data and connected Q3 research Planning decisions and methods

    at ICPSR Planning unit-definition sensitivity on Hugging Face Sales registration lag and mix on Kaggle Charge-activity distribution at Harvard Dataverse Q3 research briefing on Google Sites Development exit presentation on DocDroid Construction Capital authored these related publications. Repository hosting does not imply independent validation, peer review or institutional endorsement. Original presentation: CC BY 4.0. Source-data rights remain as stated in the deposit. Construction Capital is a property-finance brokerage. Construction Capital Q3 2026 8/8 Source and backing data