Upgrade to Pro — share decks privately, control downloads, hide ads and more …

Quantitative Analysis of Scholarly References on YouTube: Focusing on Their Research Fields and Contributors / ICADL2023

Jiro Kikkawa
December 01, 2023

Quantitative Analysis of Scholarly References on YouTube: Focusing on Their Research Fields and Contributors / ICADL2023

Our presentation slide at ICADL2023 (https://icadl.net/icadl2023/), Session 7: Social Media Analytics on 6th December 2023.
Authors: Jiro Kikkawa, Masao Takaku, and Fuyuki Yoshikane
Paper: https://doi.org/10.1007/978-981-99-8085-7_13
Conference program: https://ifdik2023.conf.tw/site/page.aspx?pid=287&sid=1521&lang=en
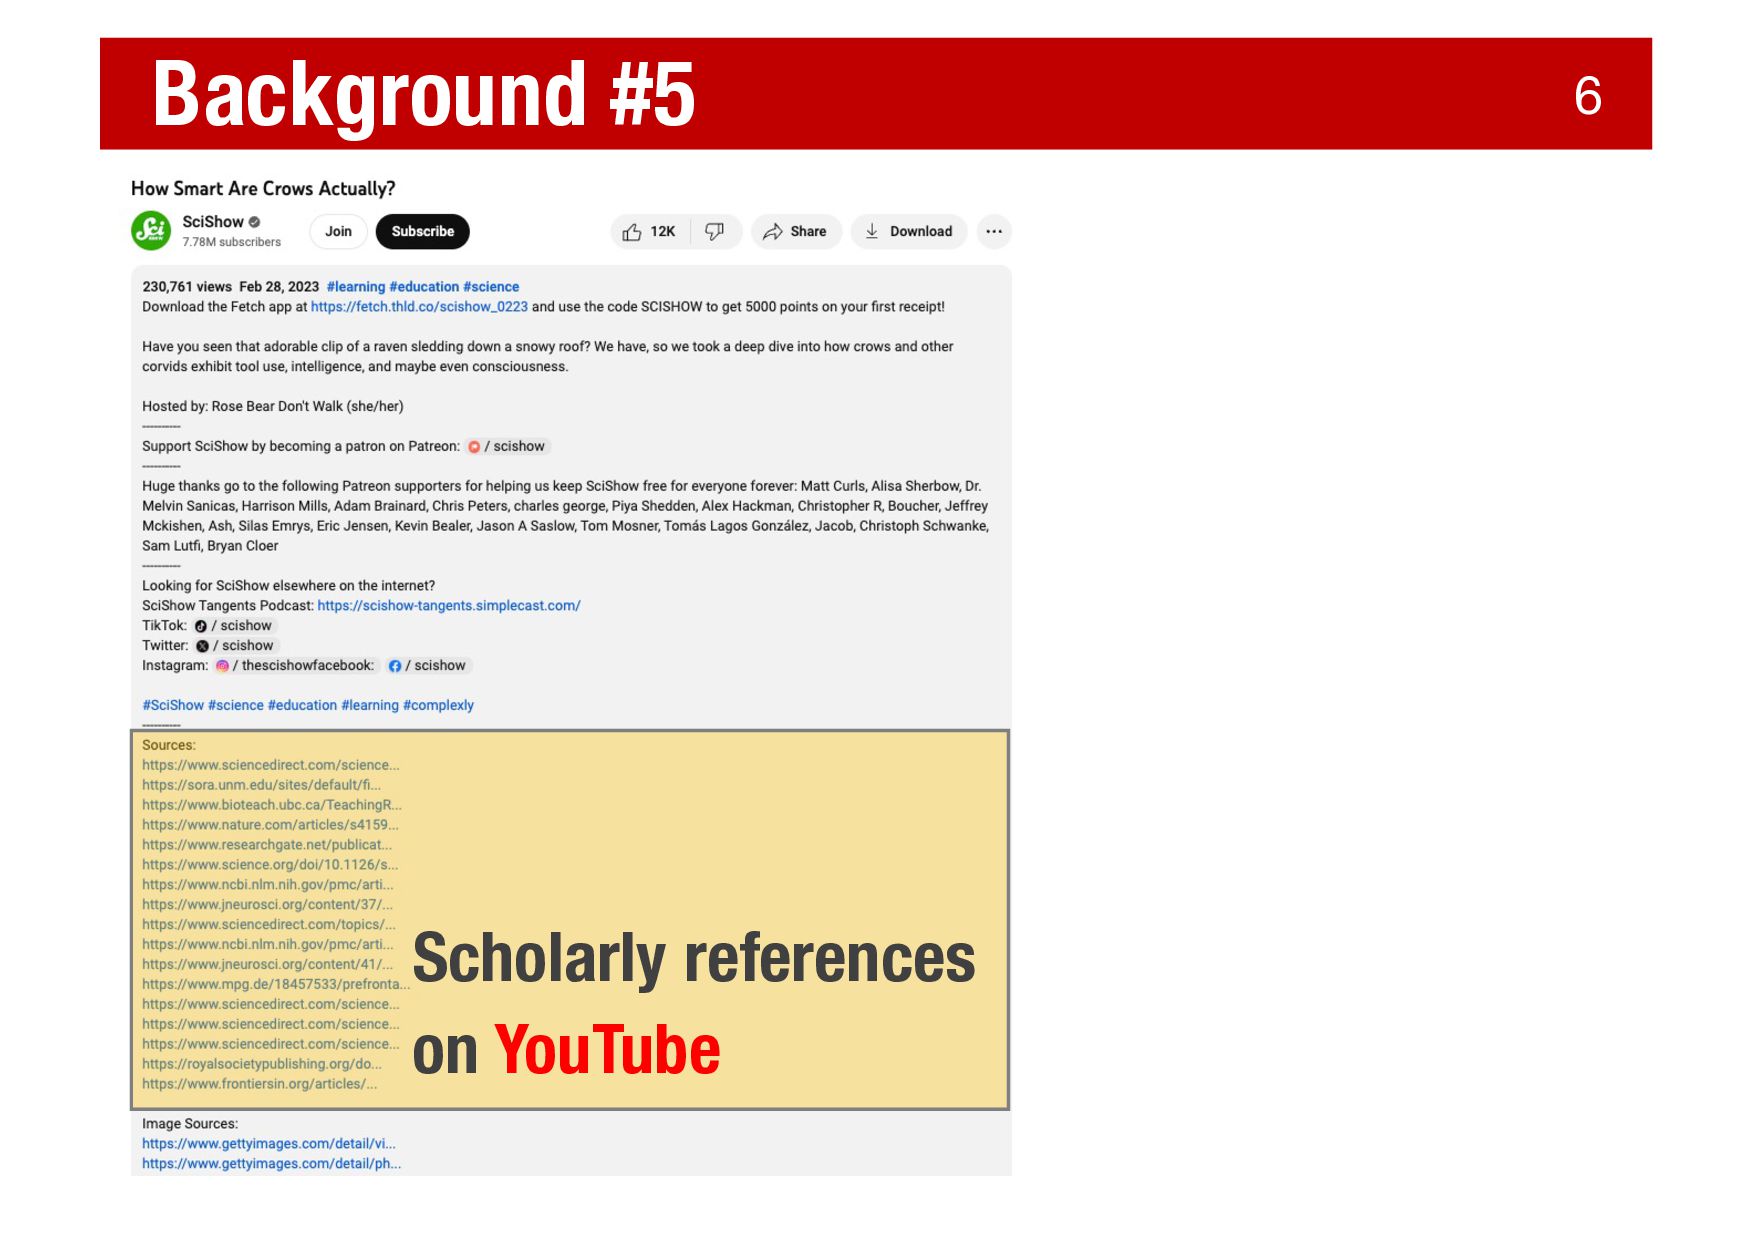
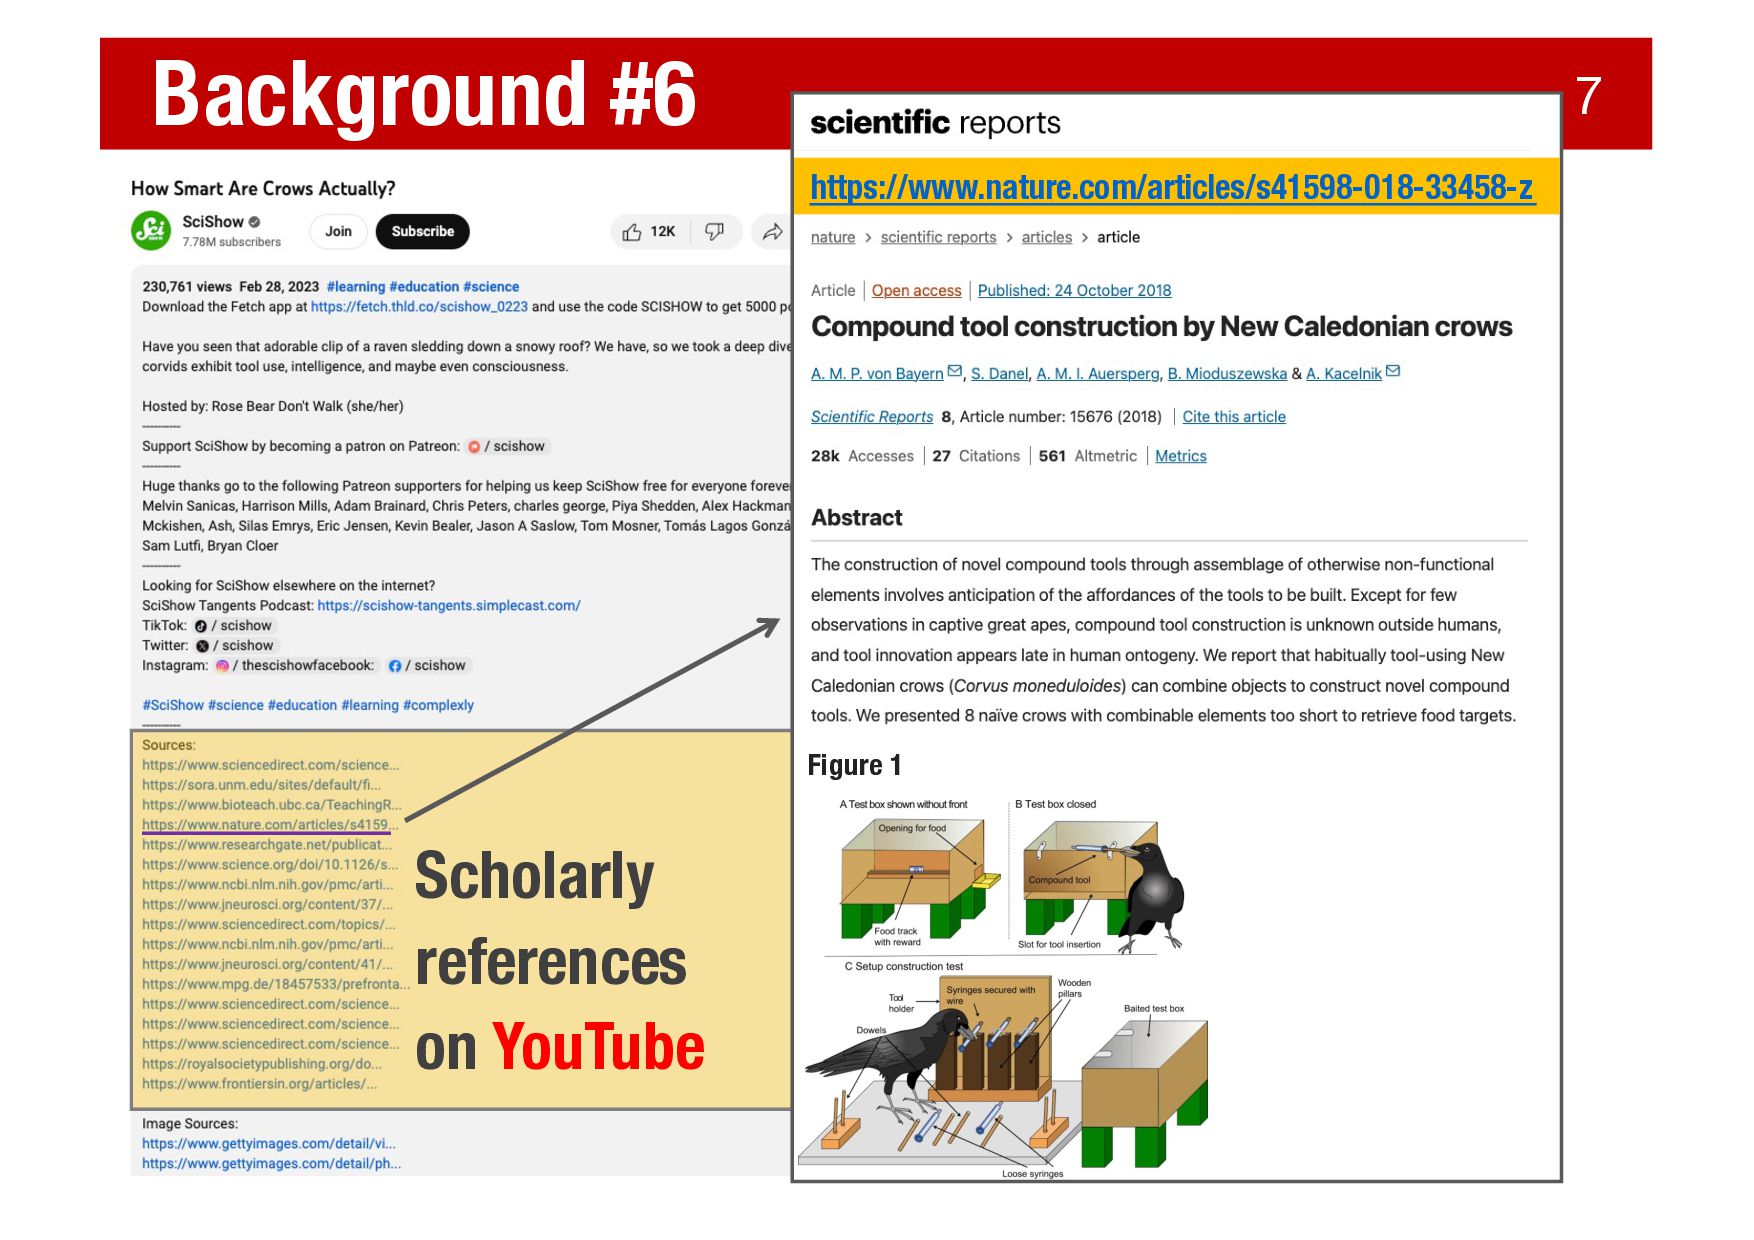
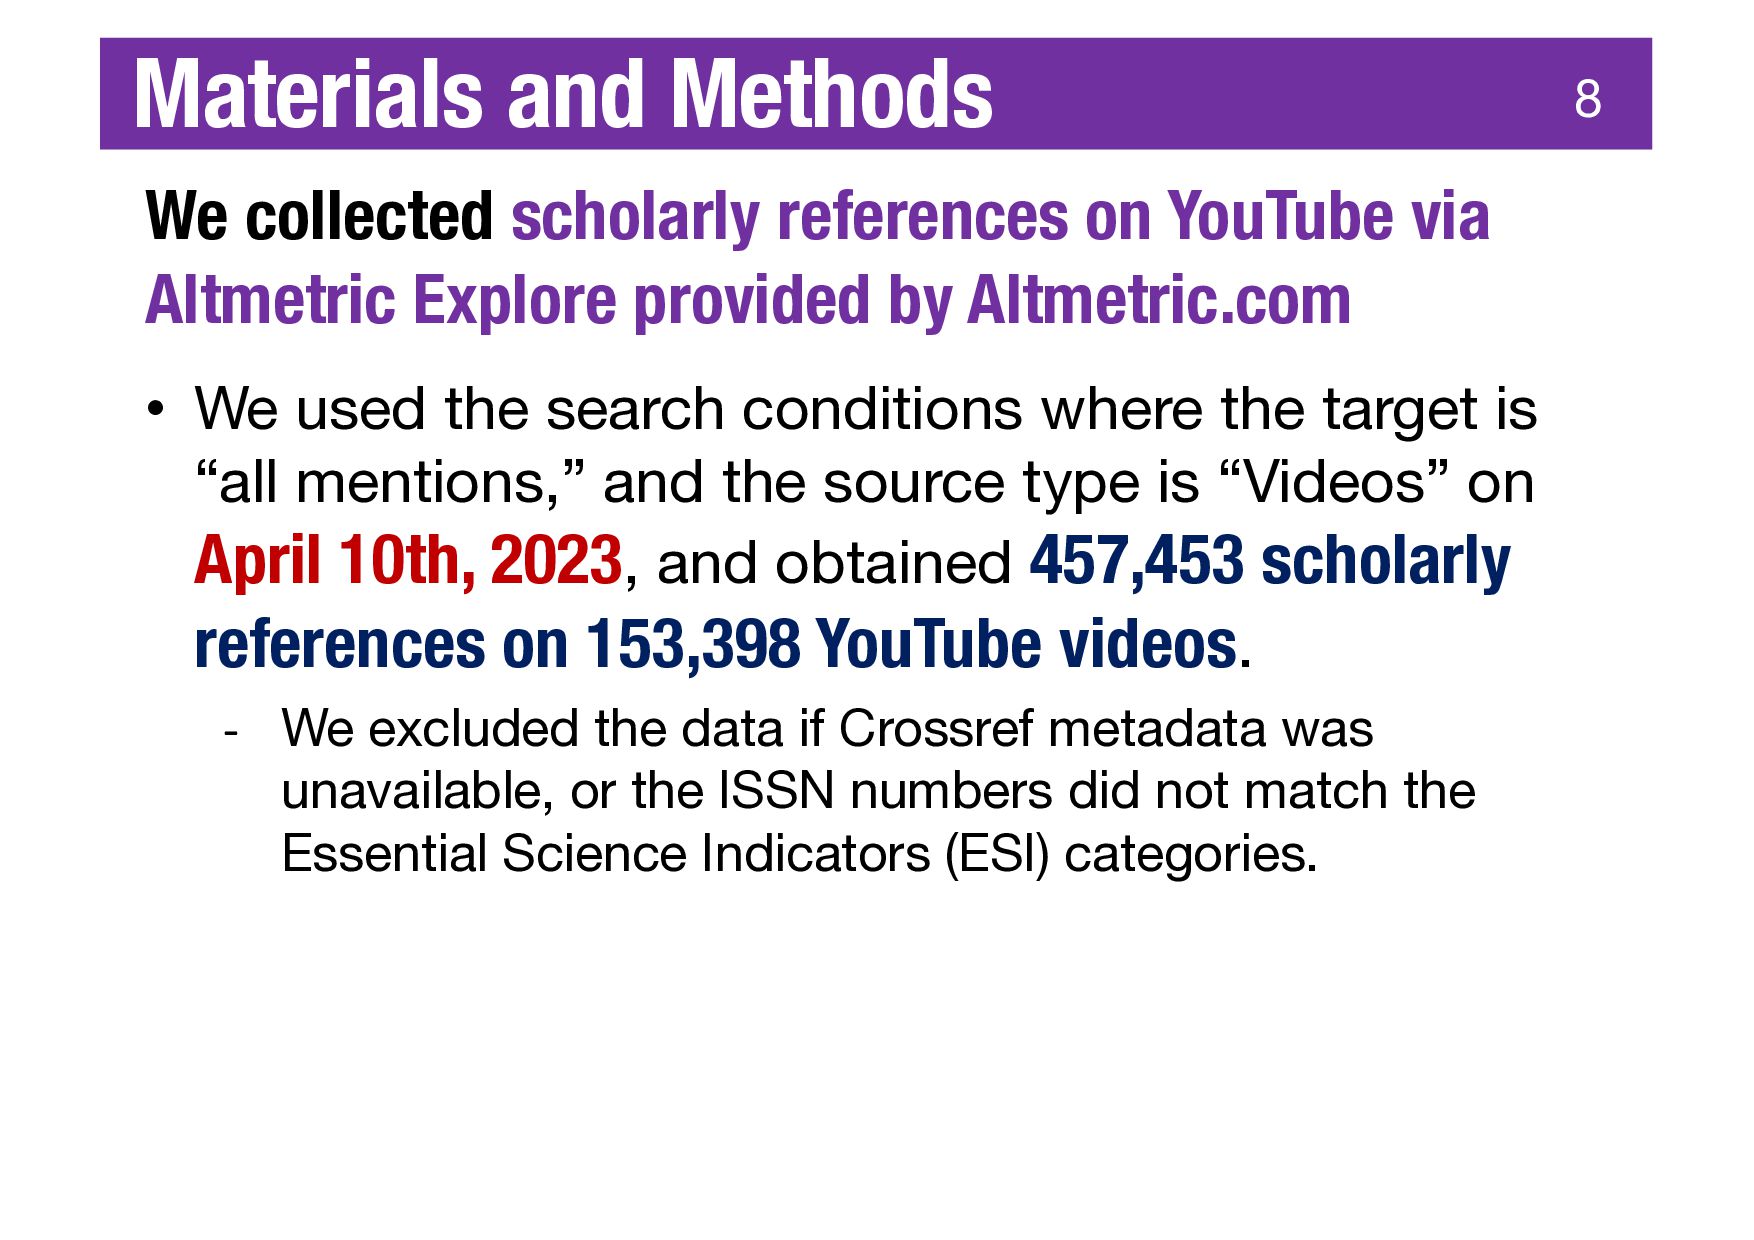
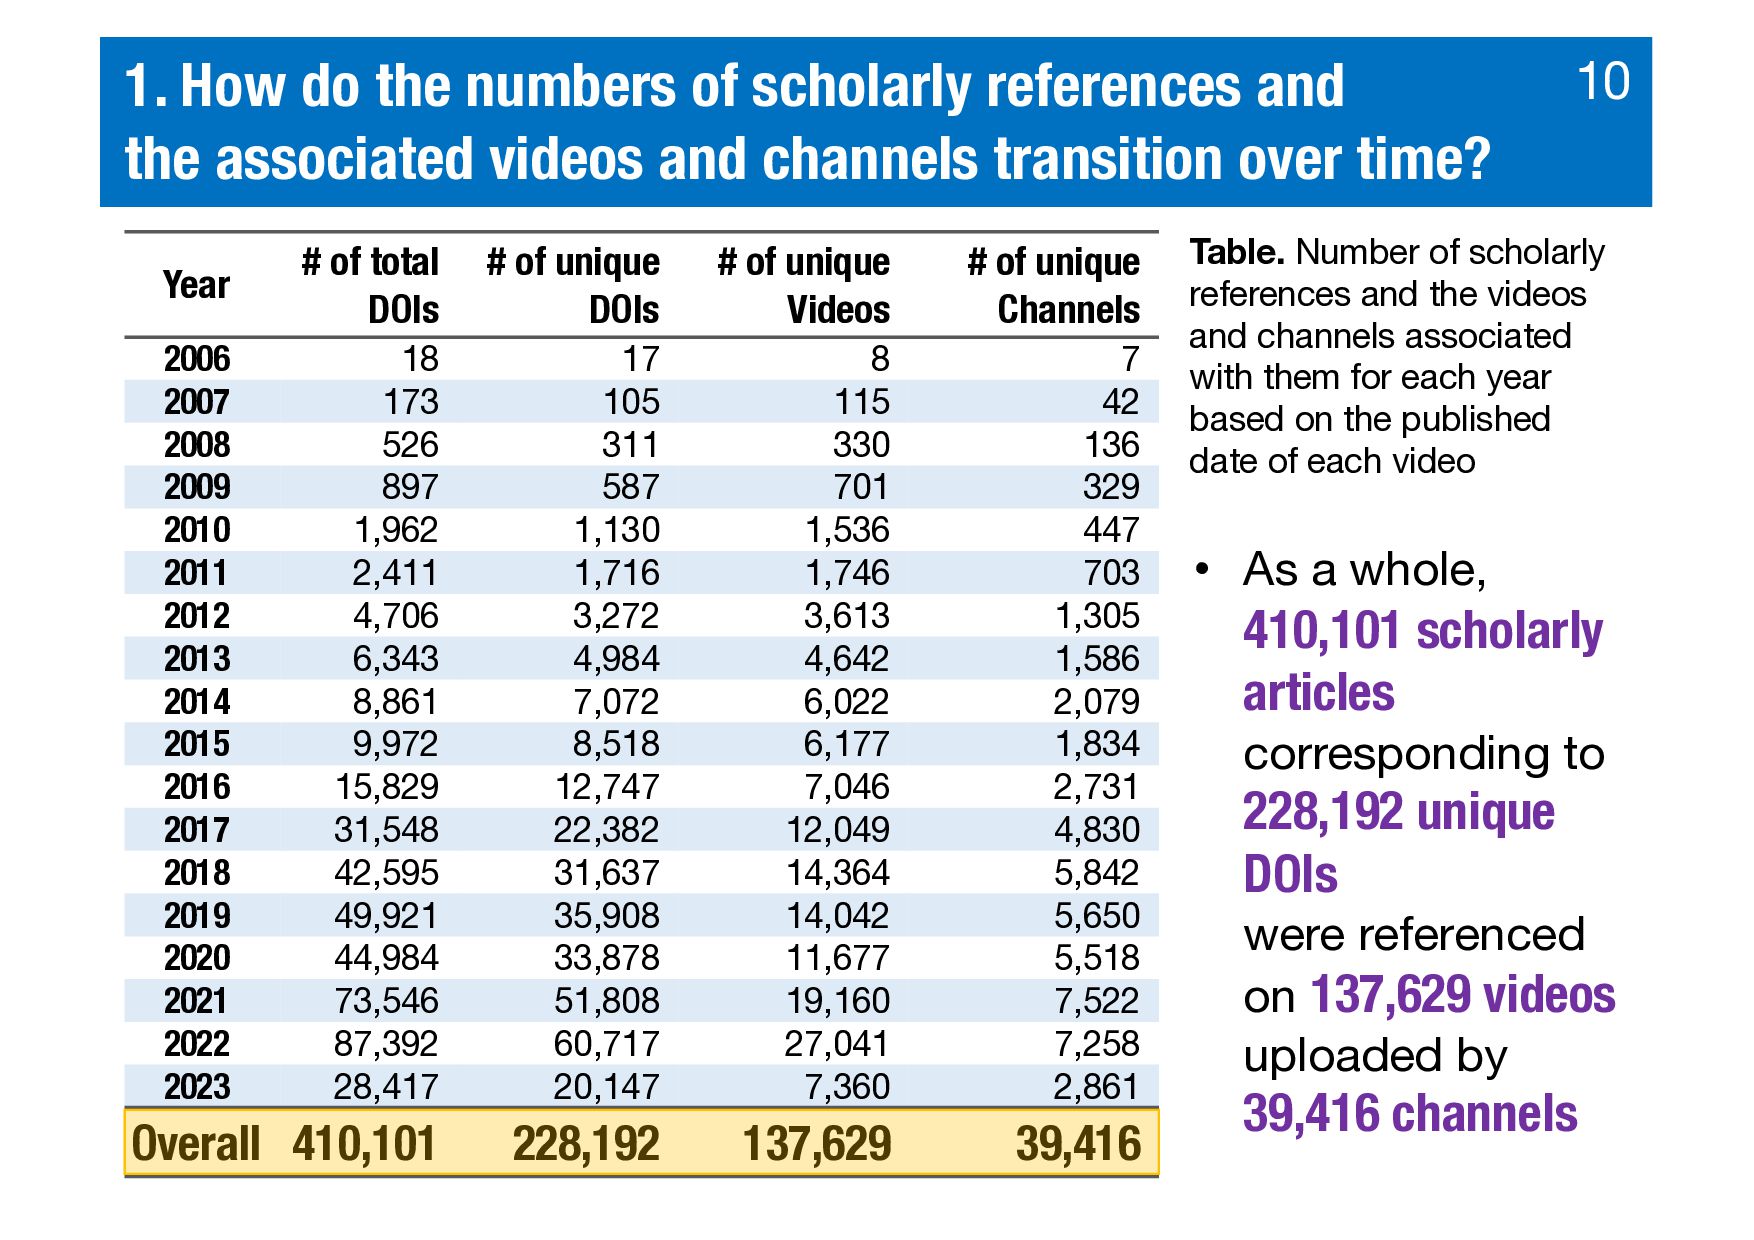
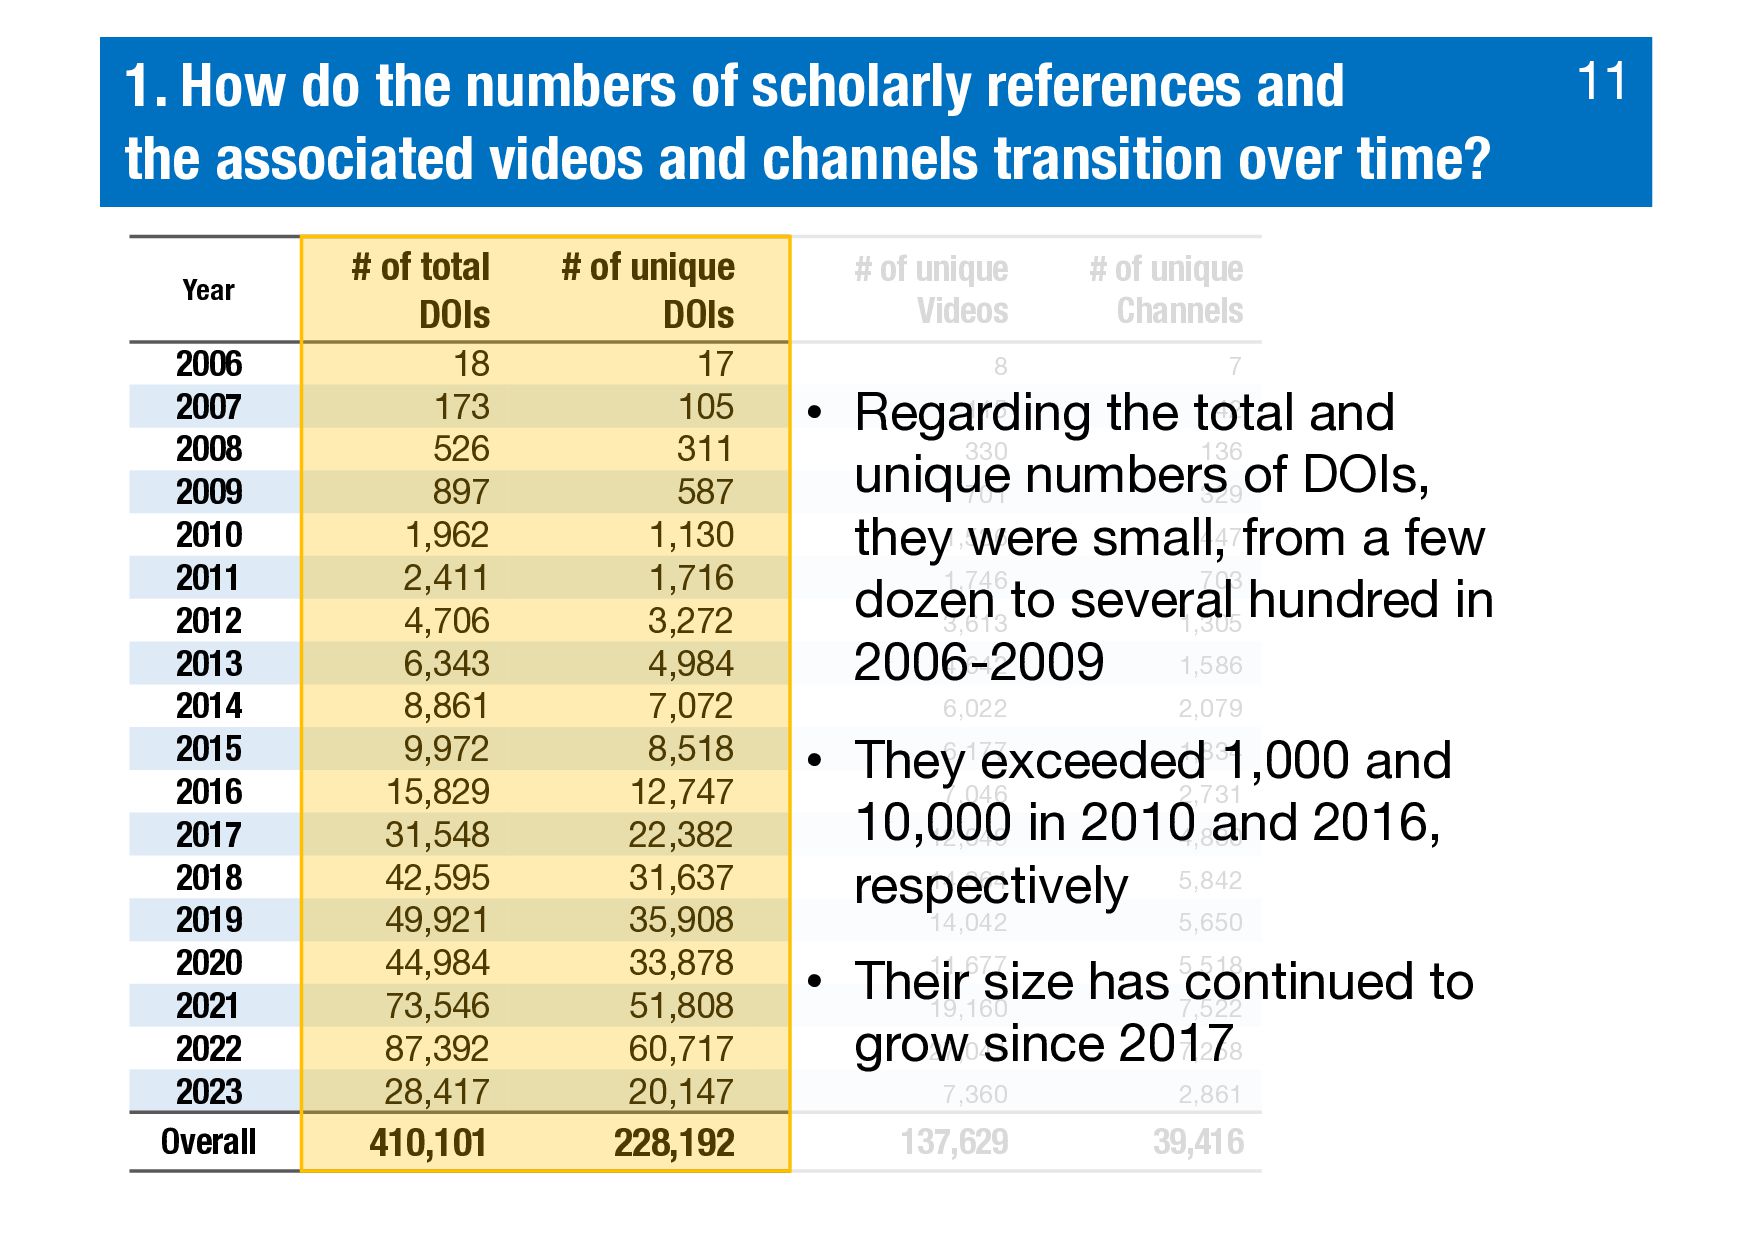
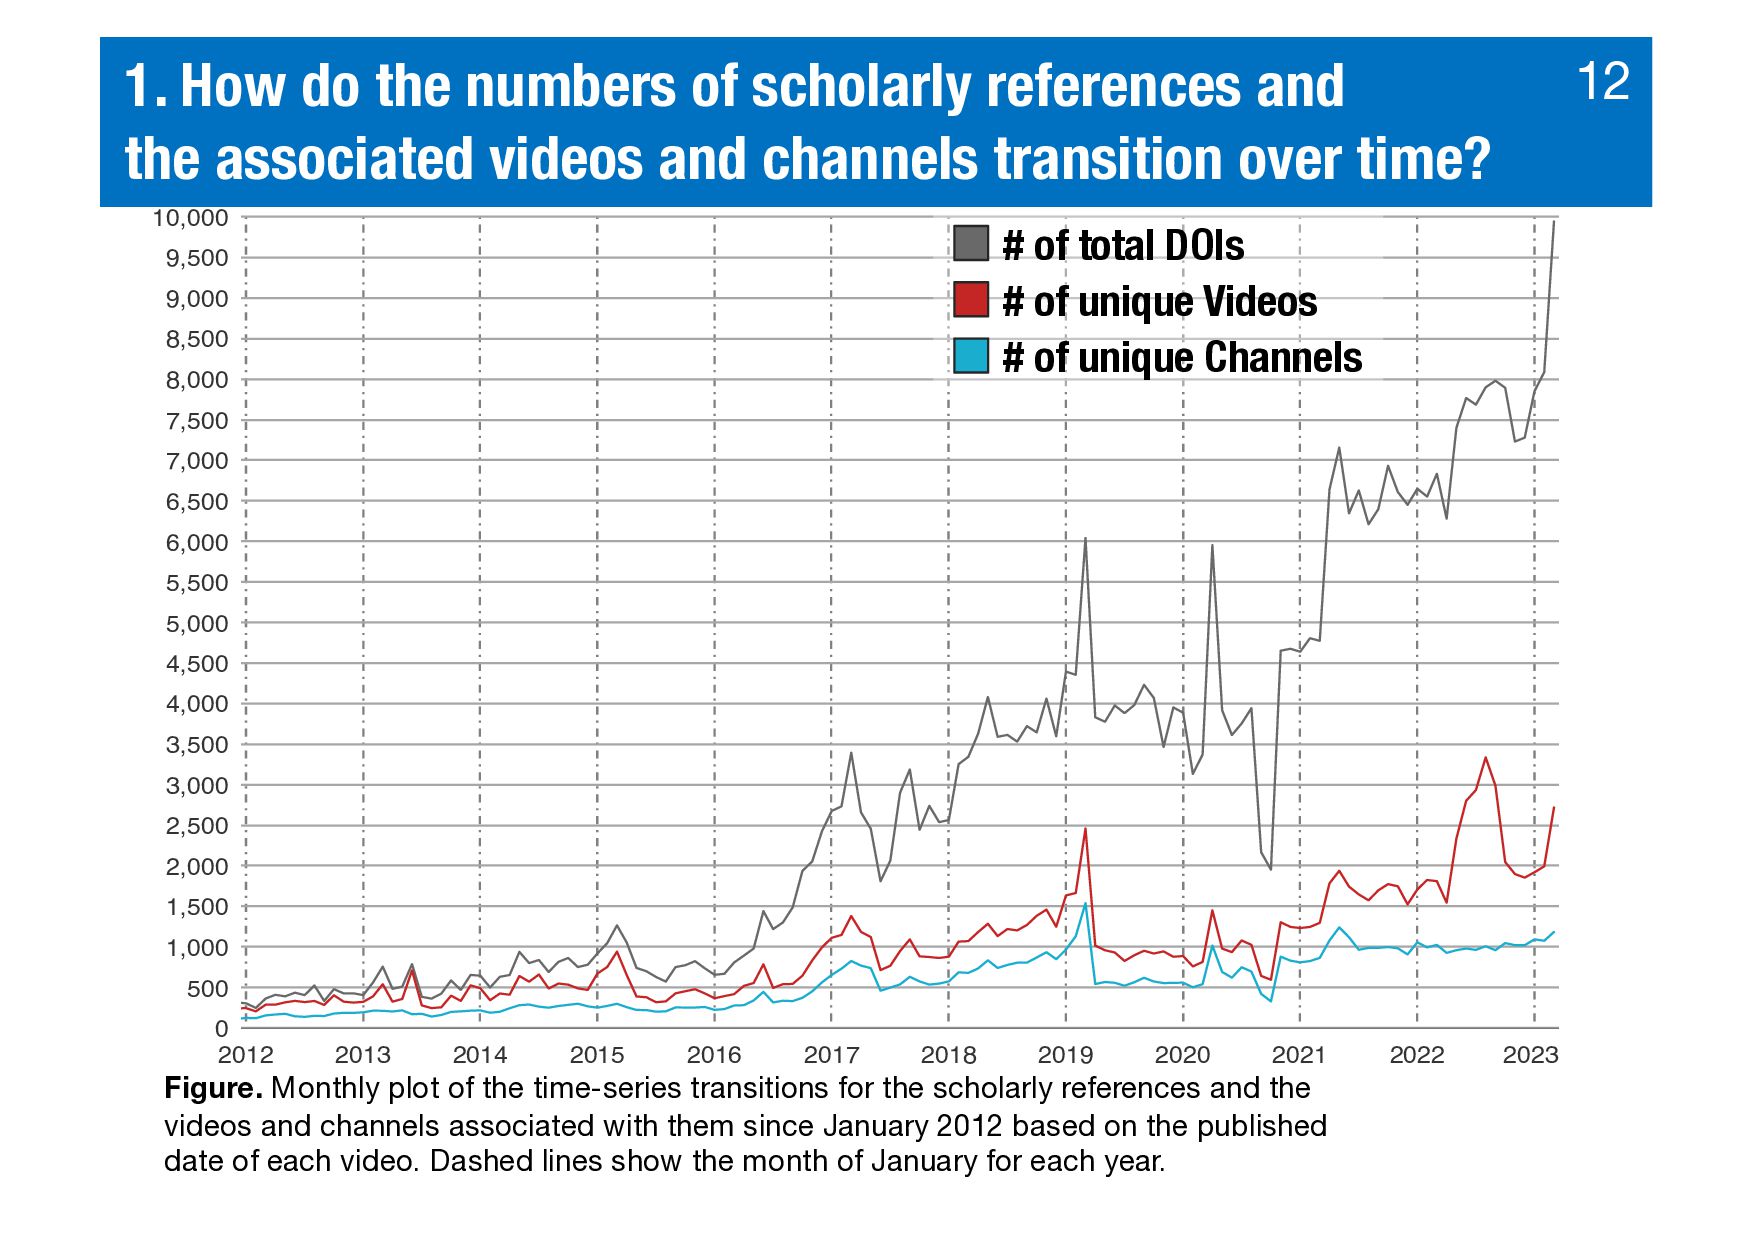
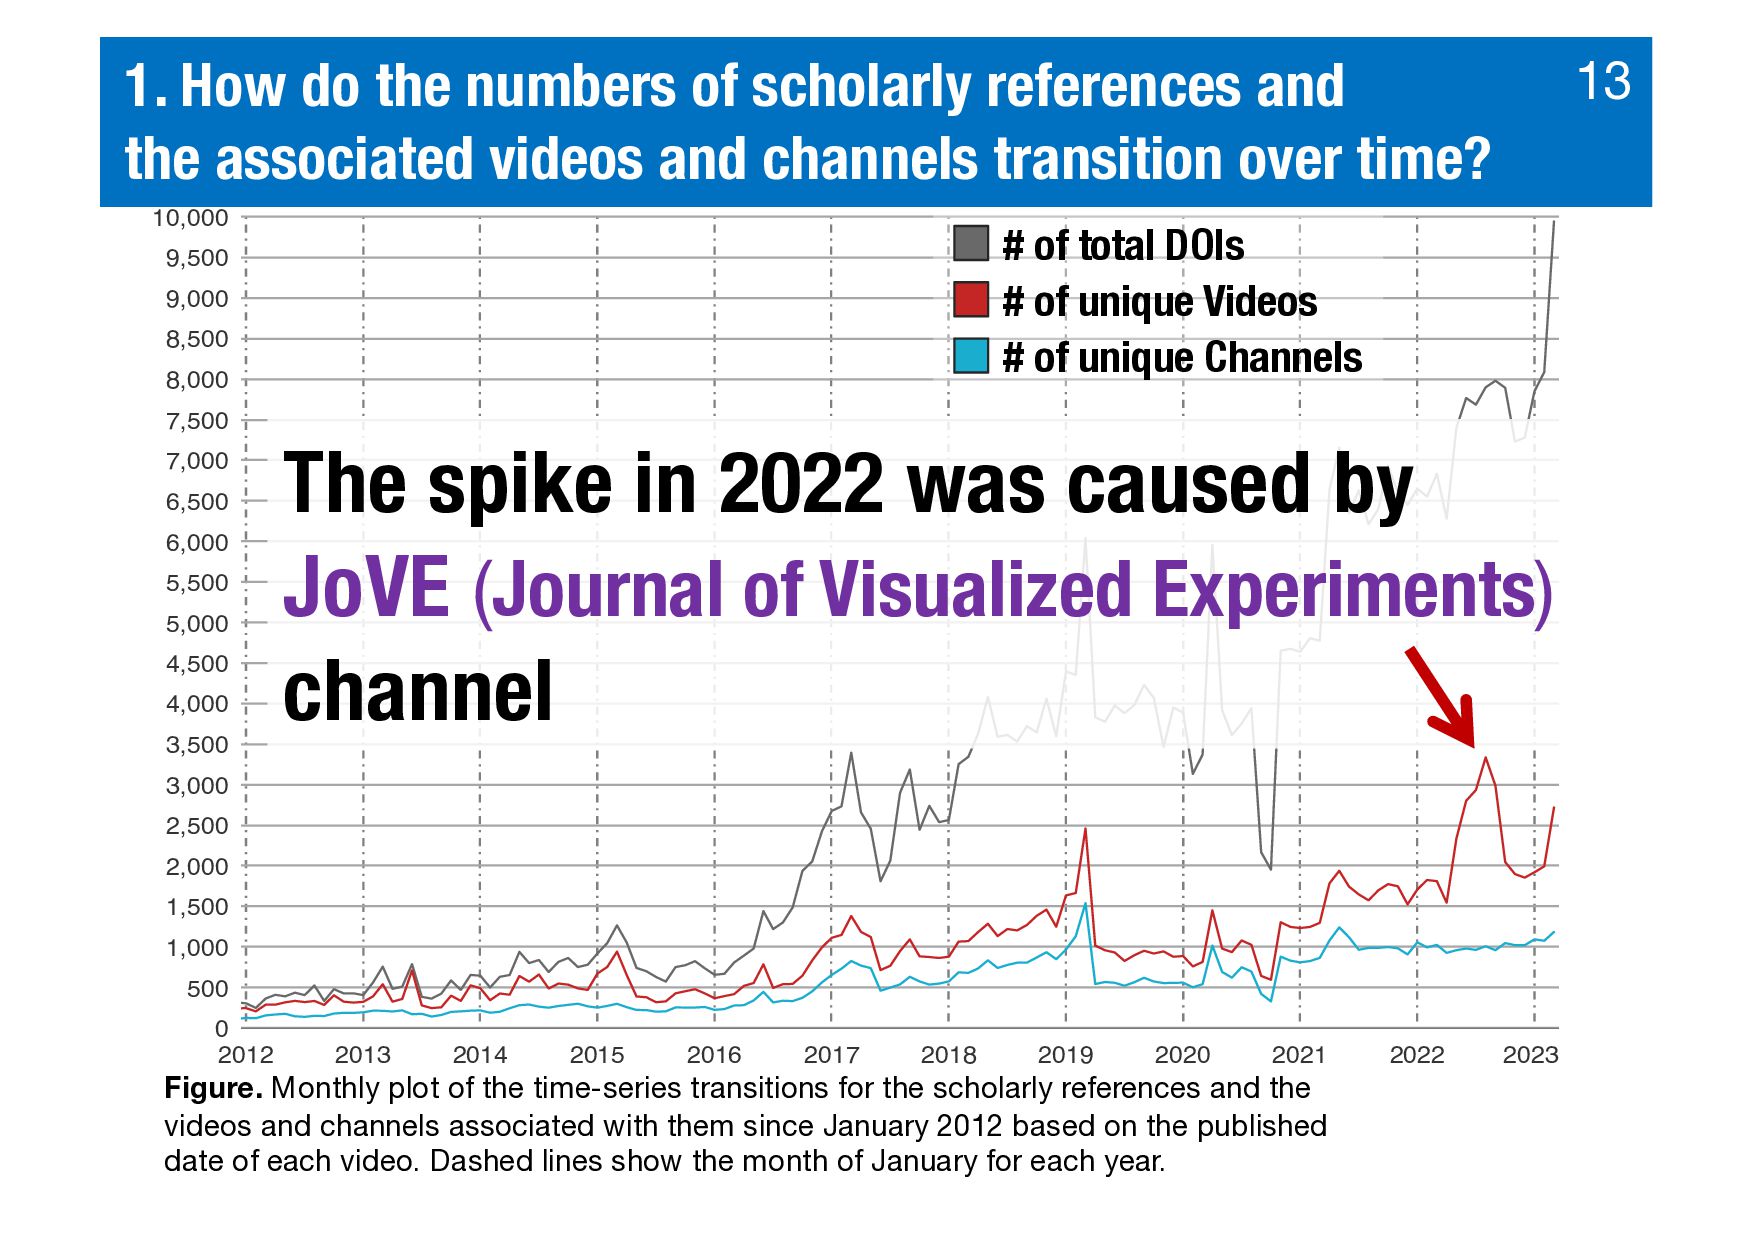
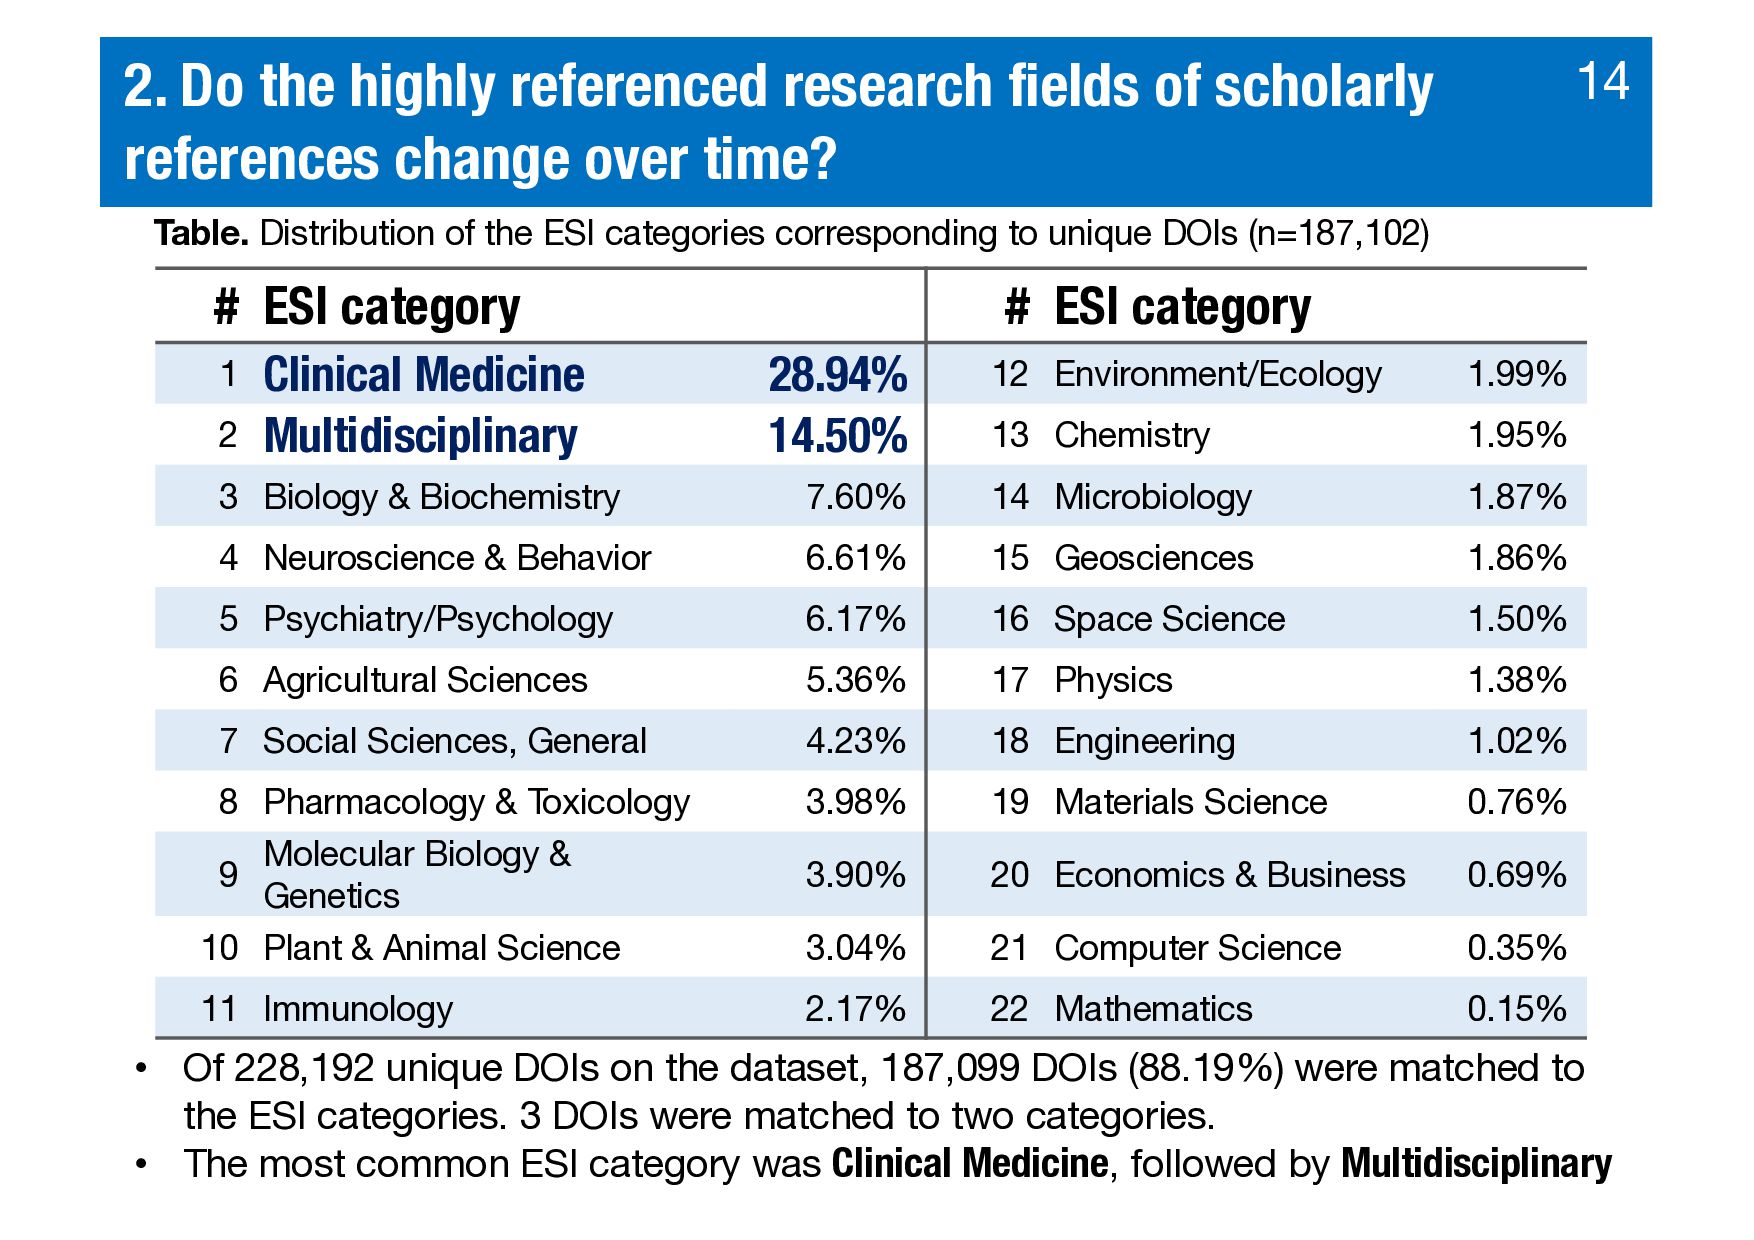
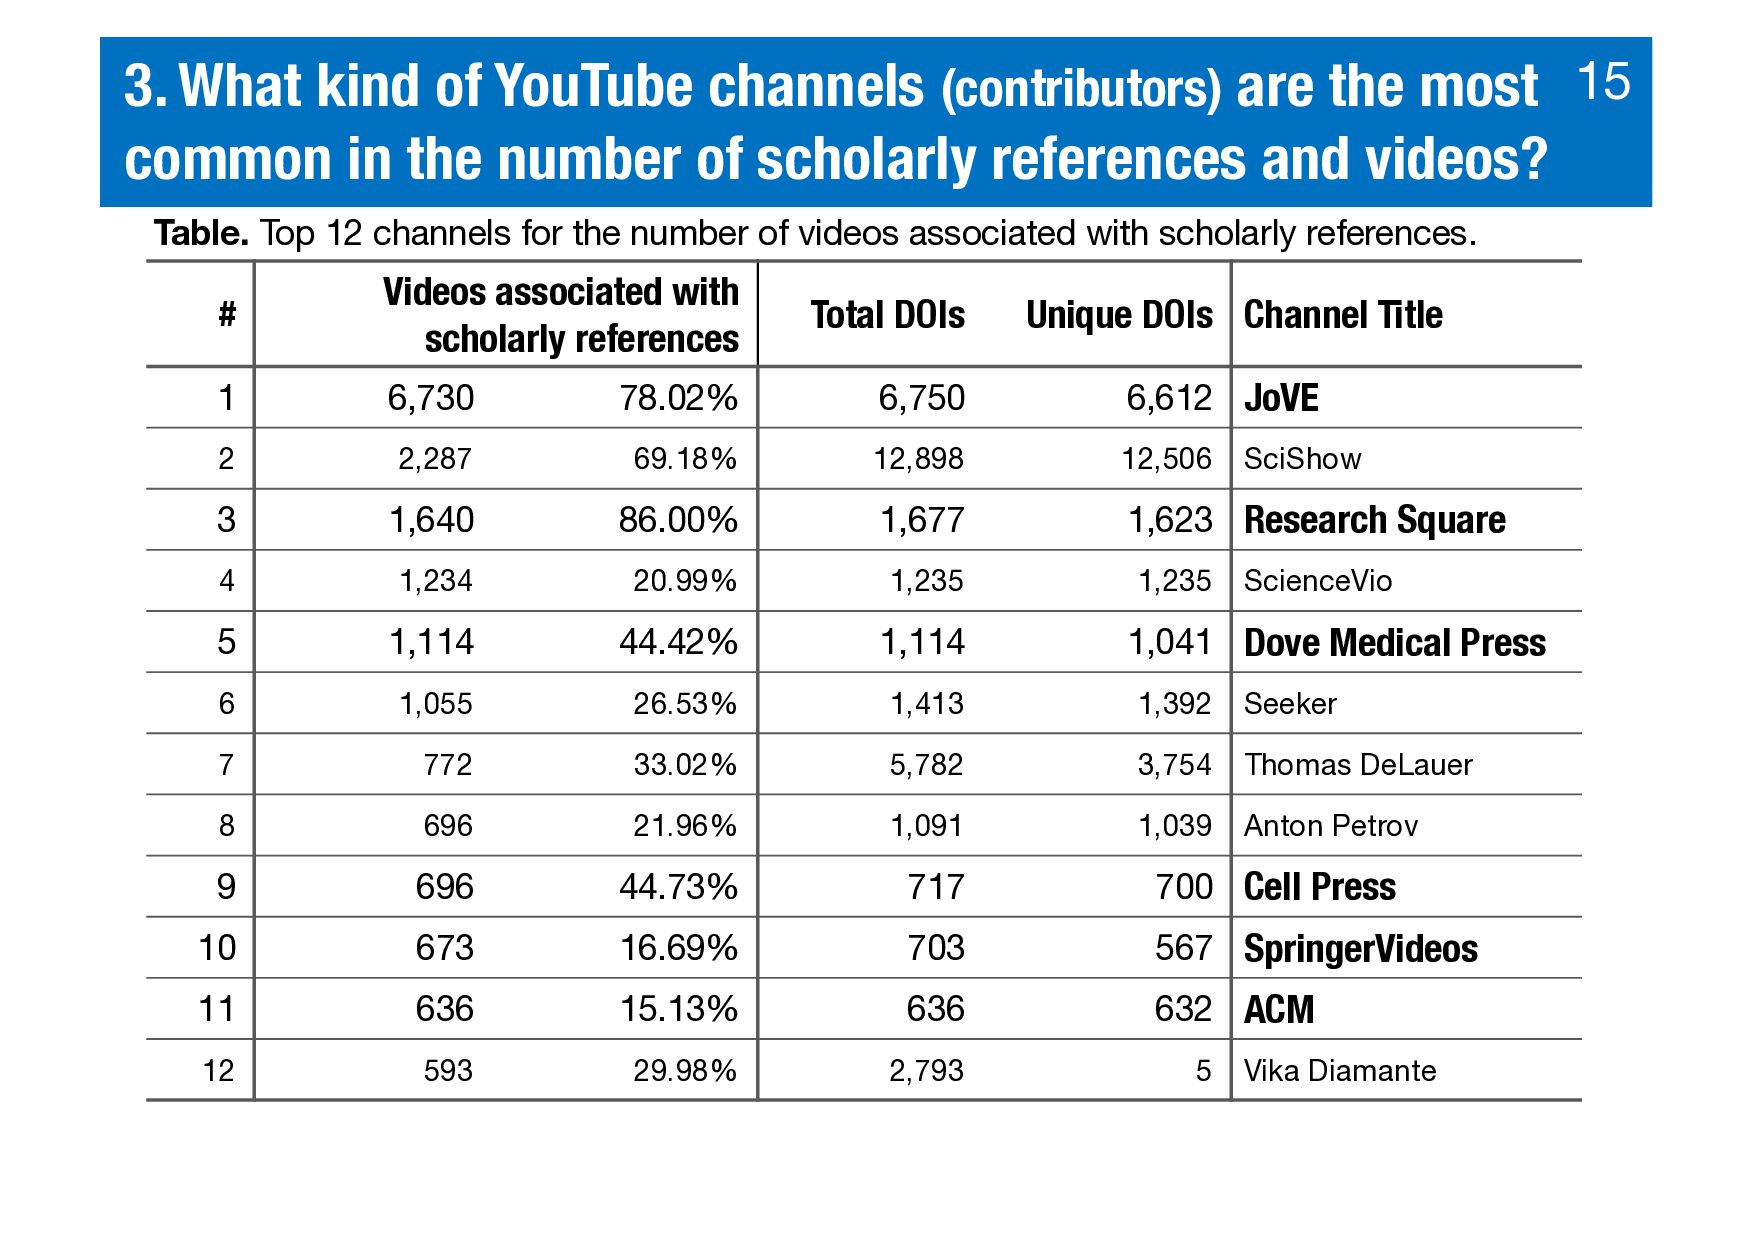
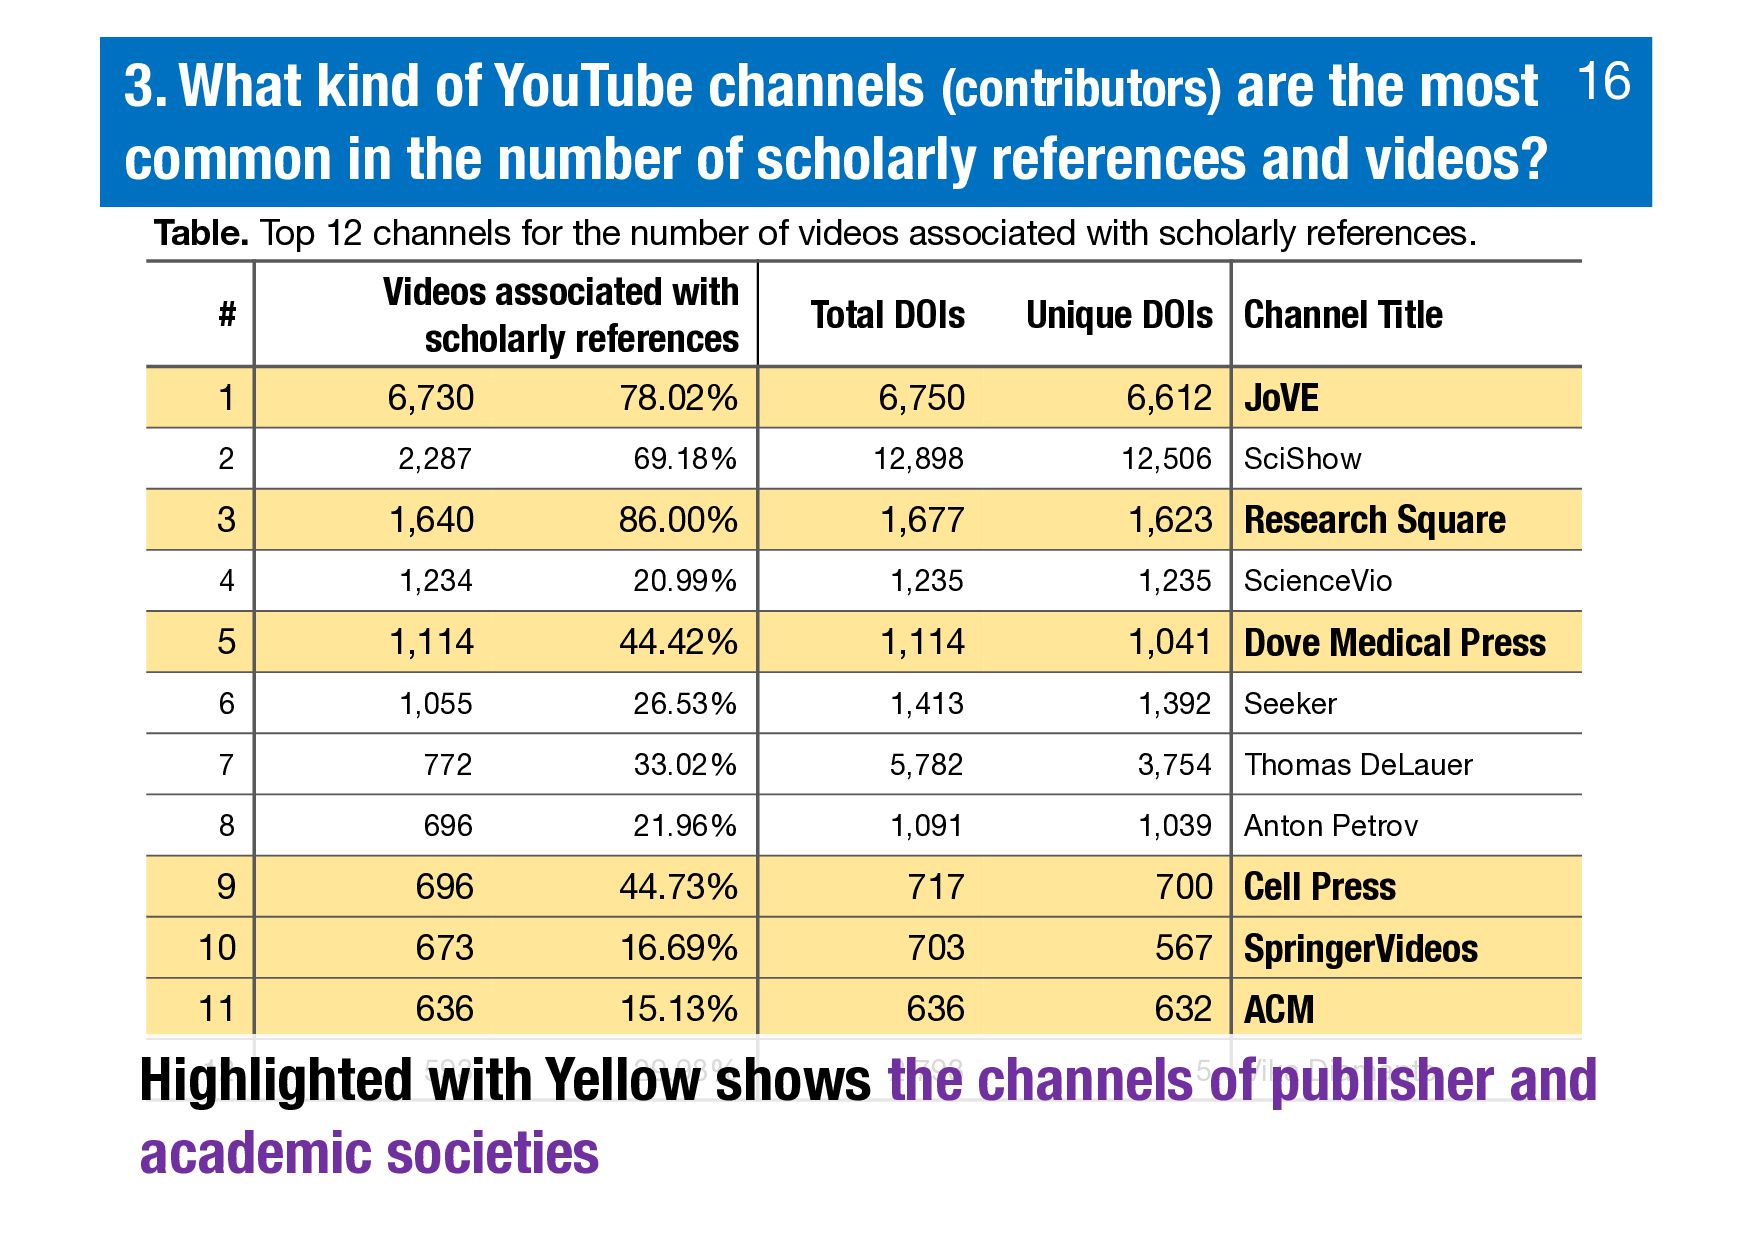
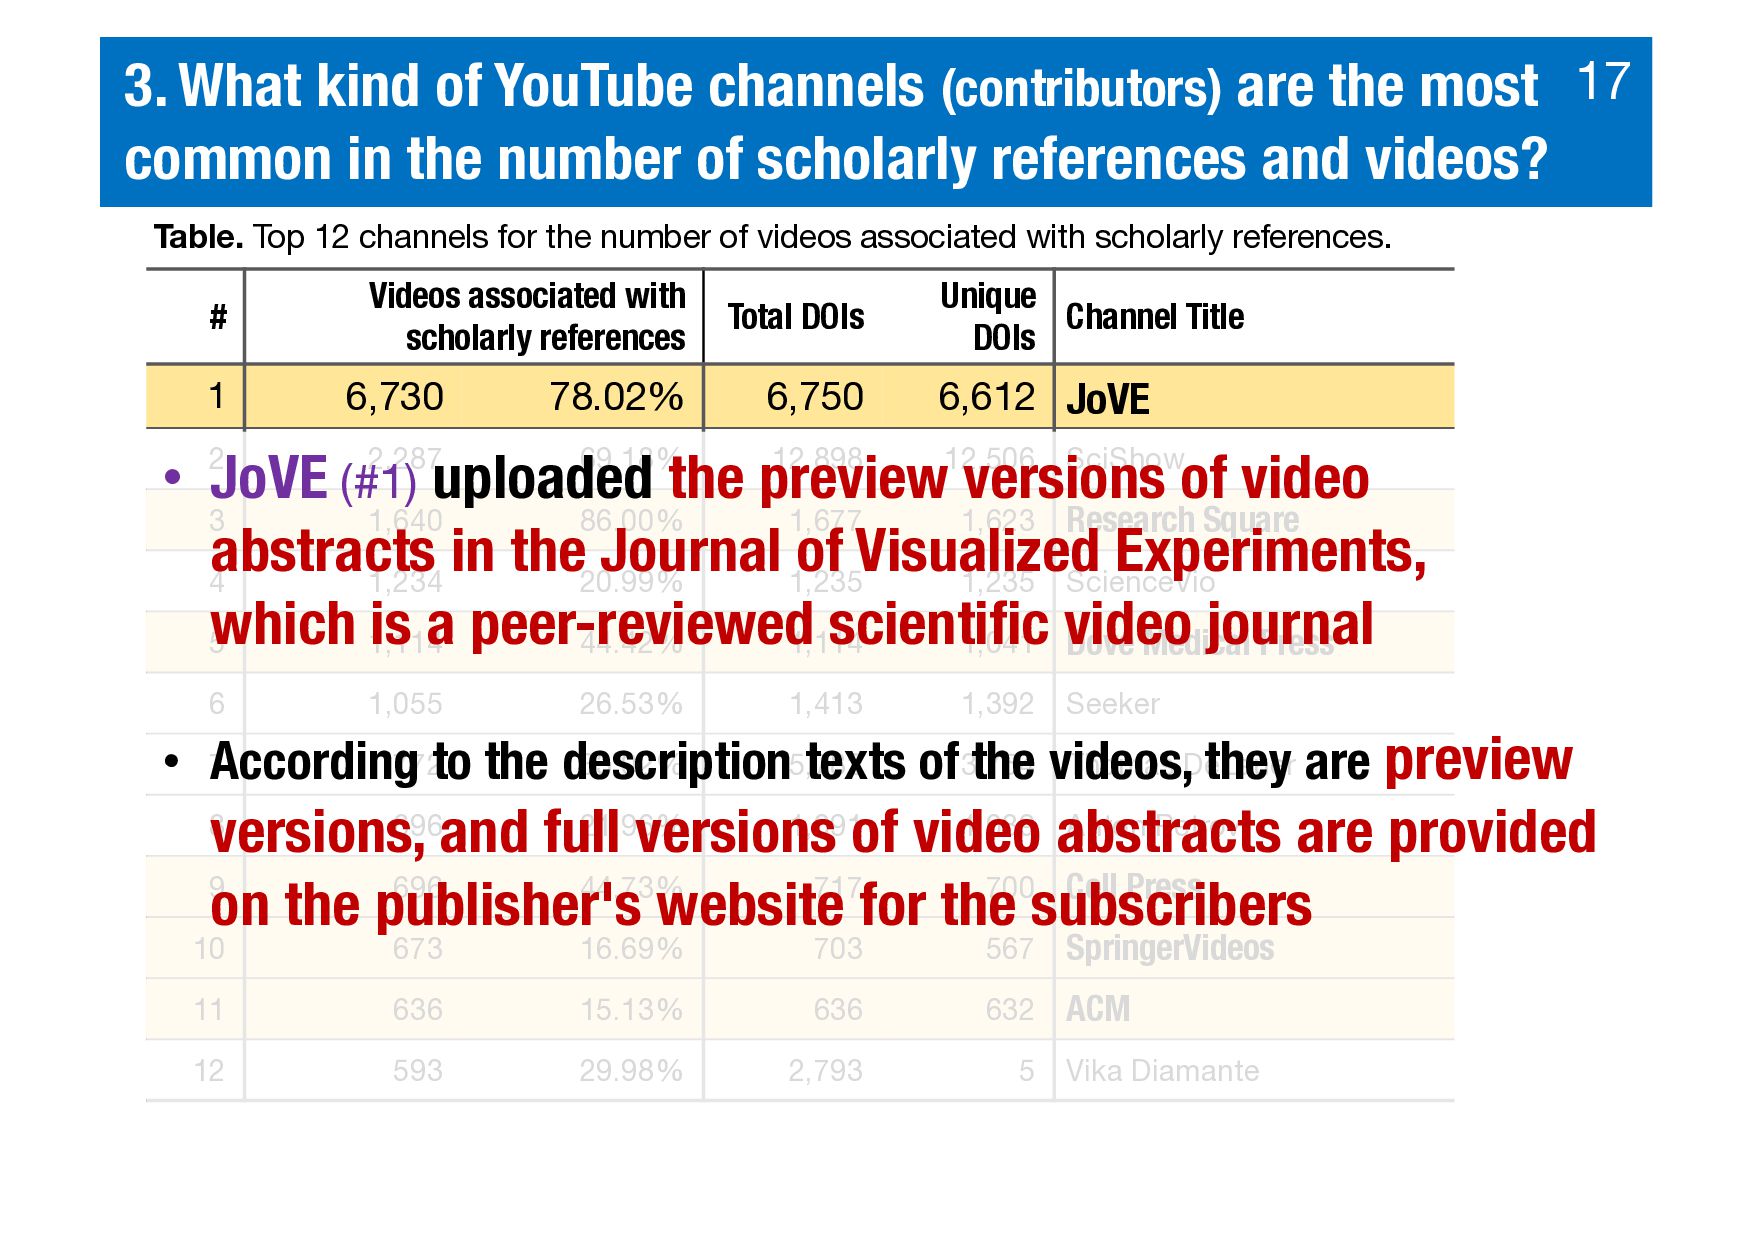
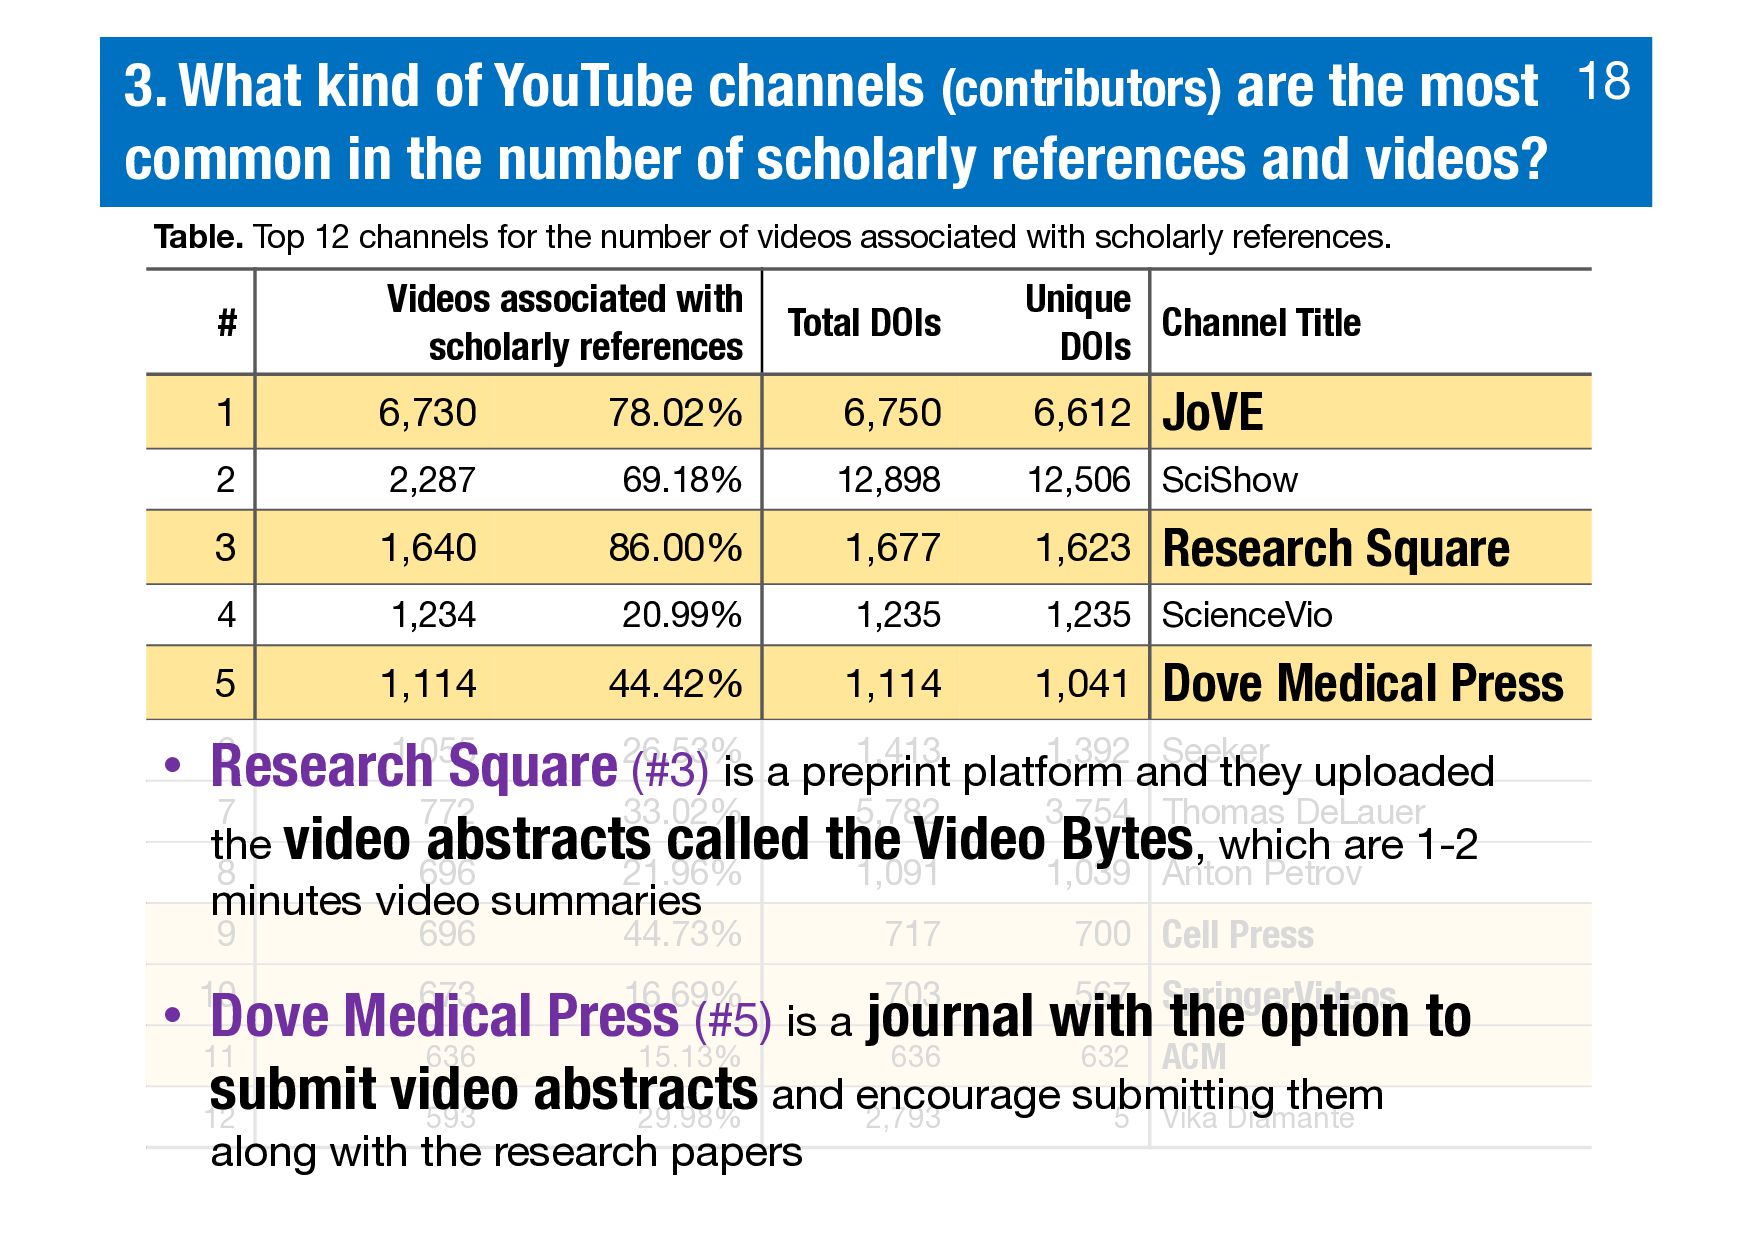
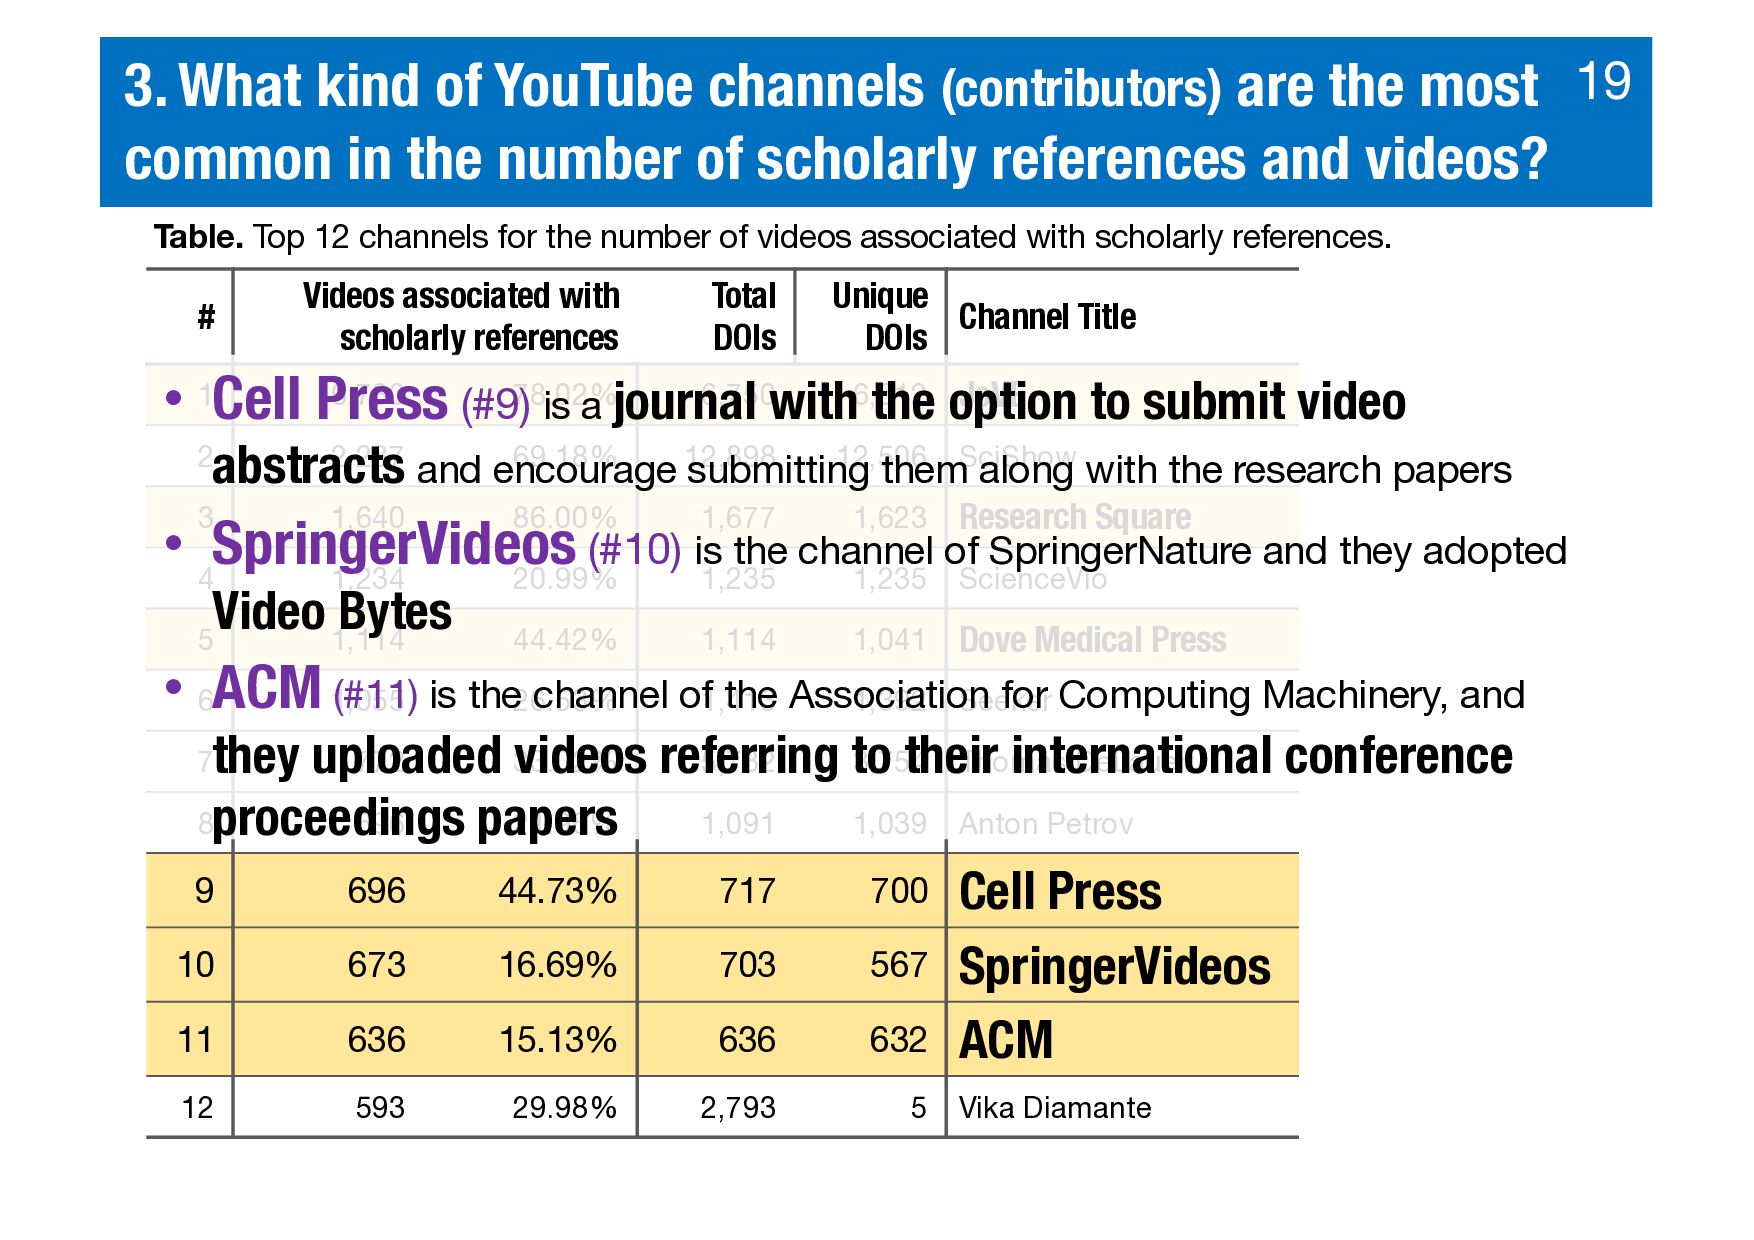
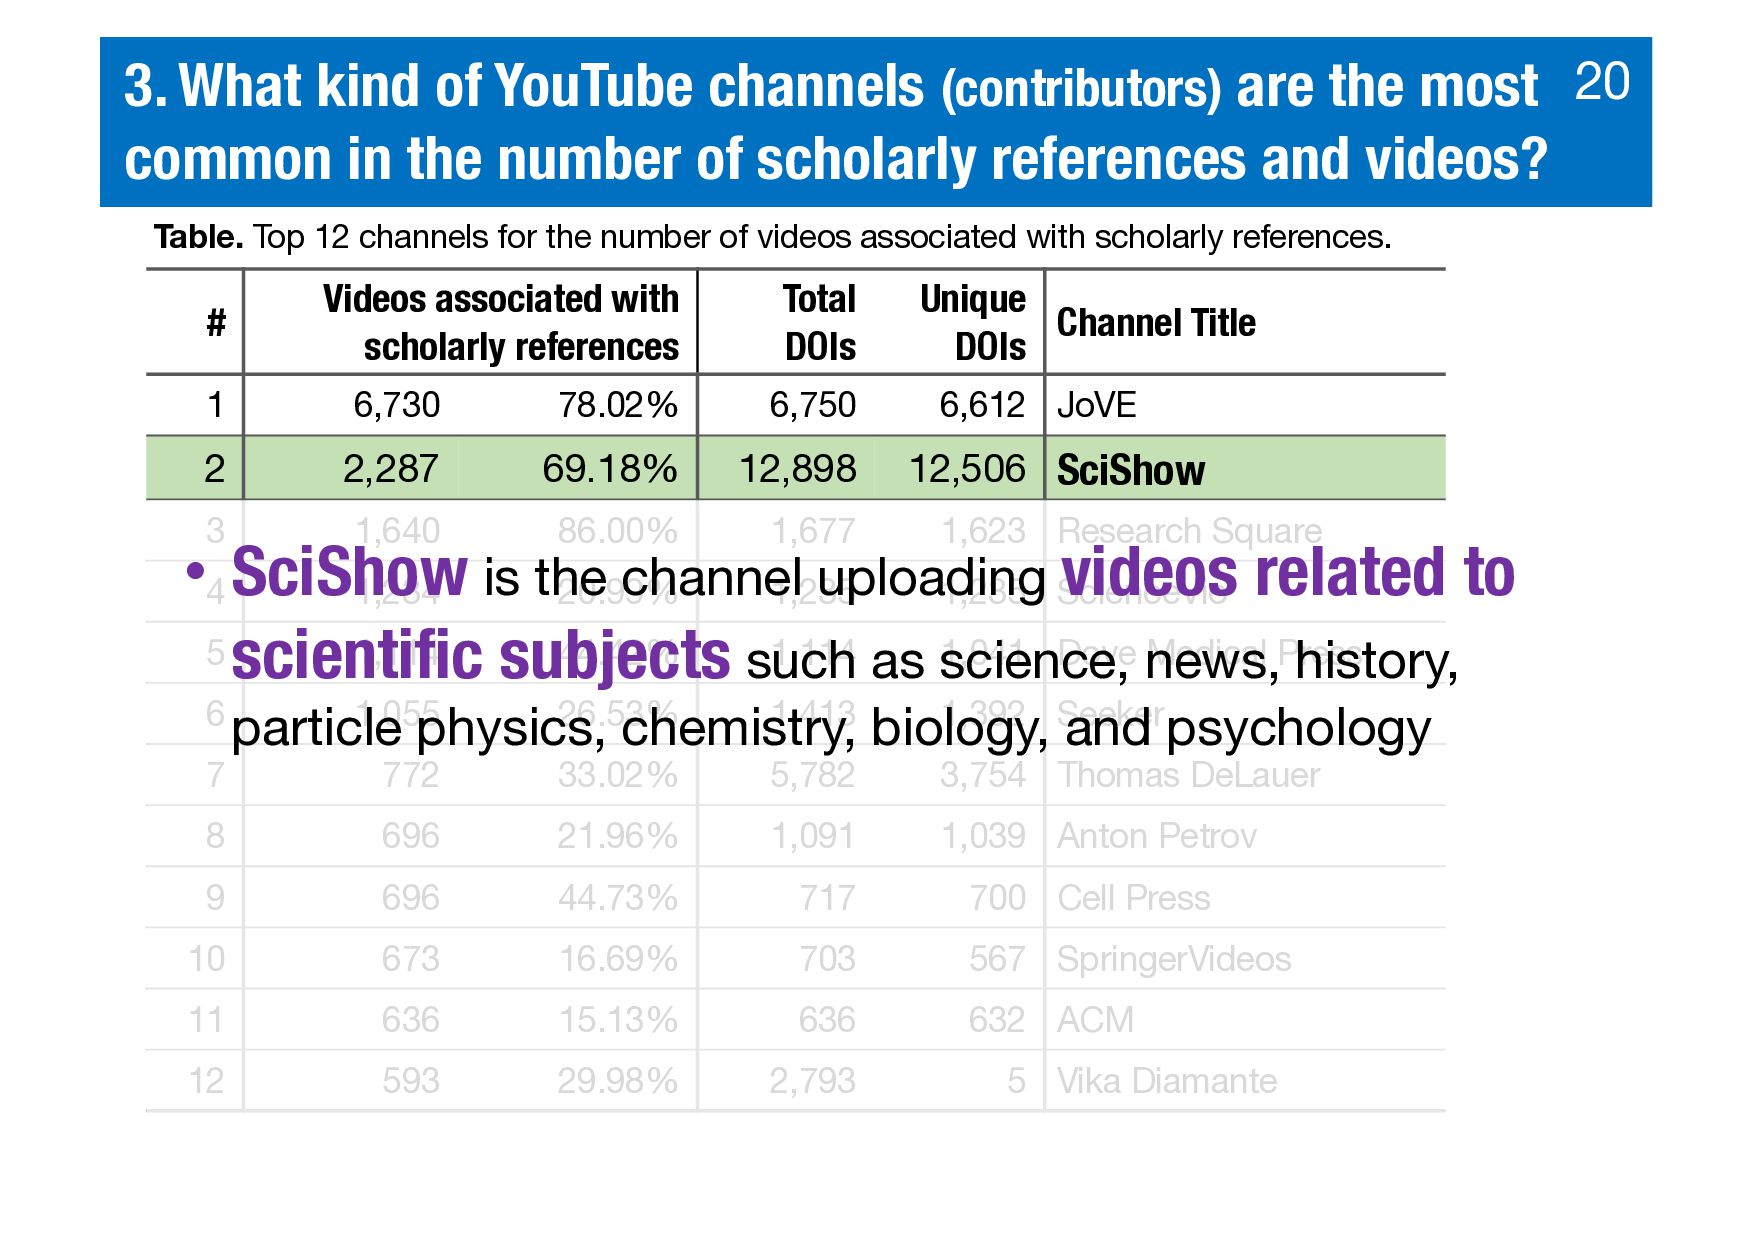
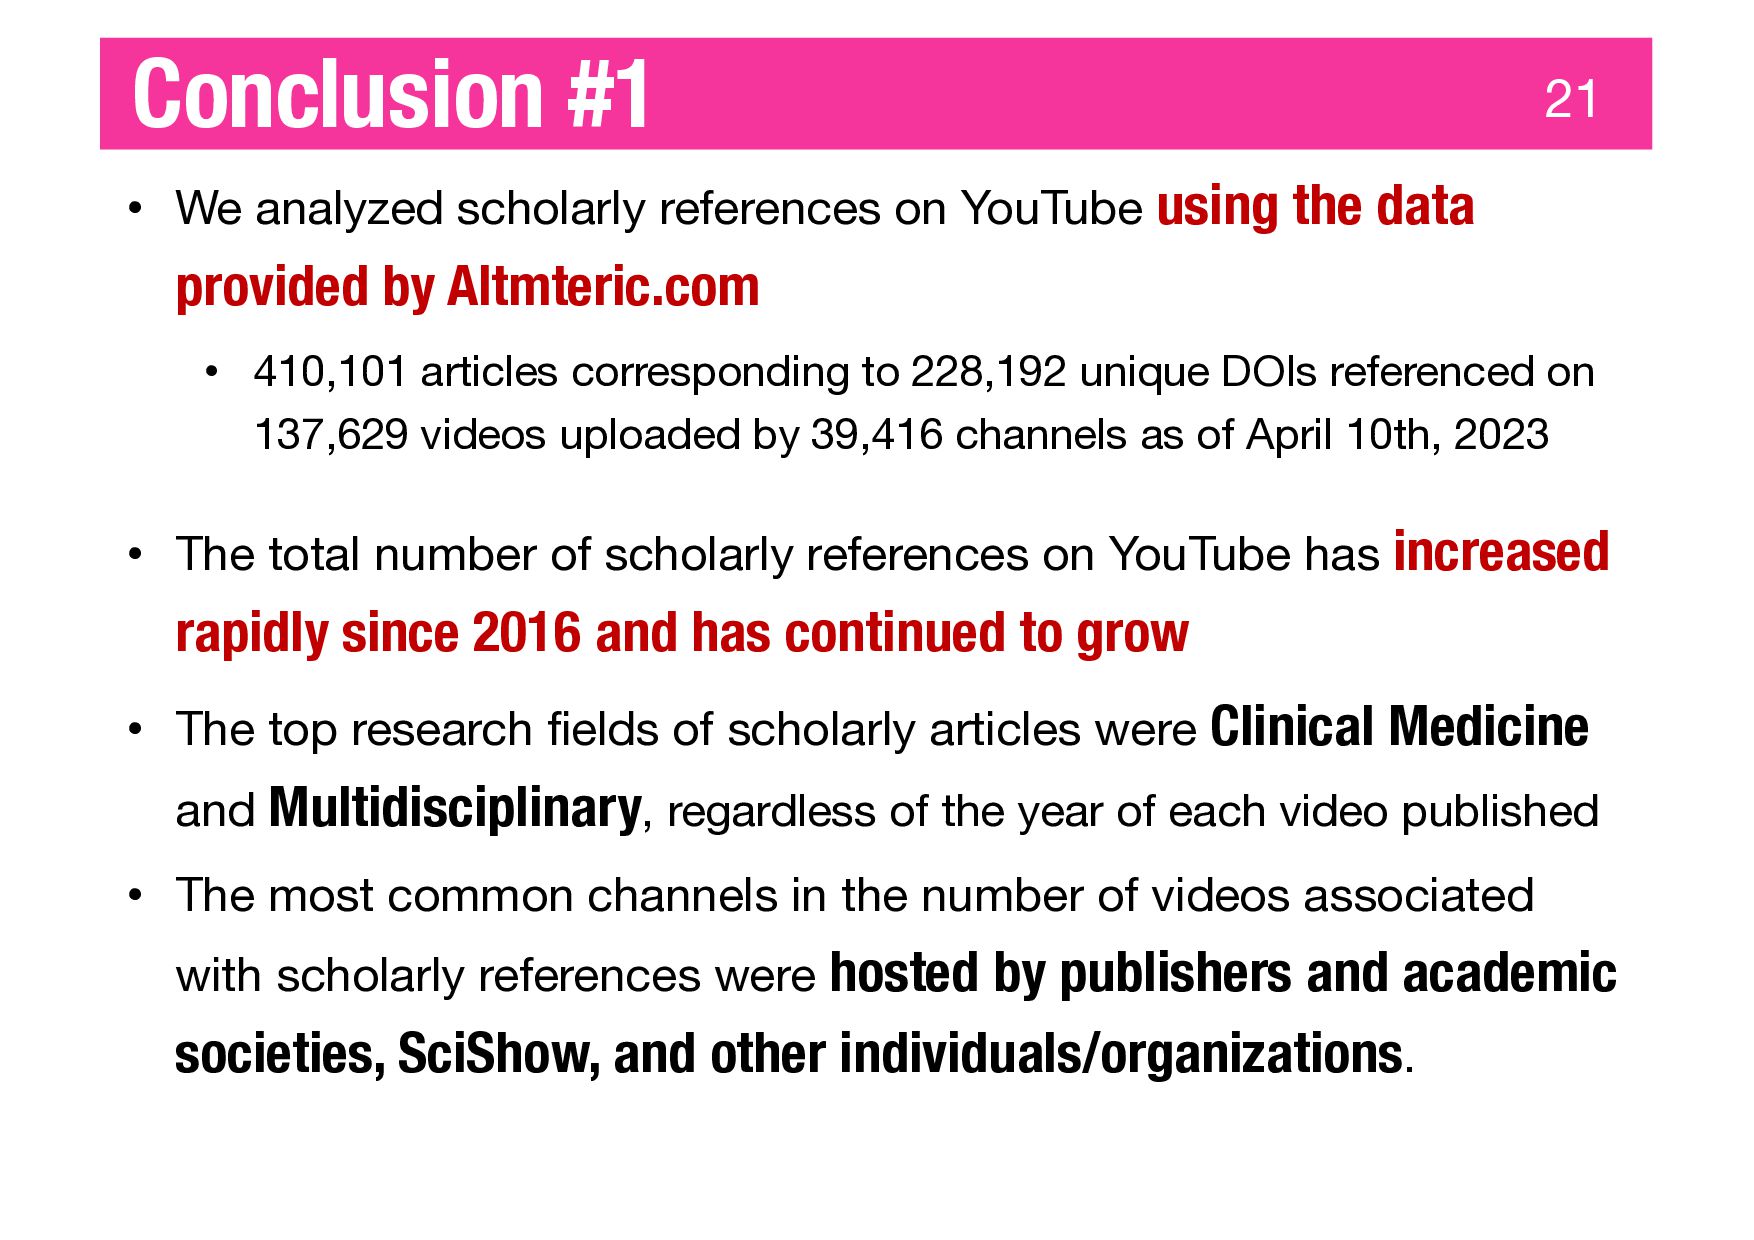
Abstract: Scholarly communication through video by various people and institutions has spread more and more in recent years and impacts the dissemination of scholarly knowledge and people’s daily lives. However, most of the previous works were conducted to measure the impacts of these research outputs as Altmetrics studies; little is known about characteristics and trends of scholarly articles and their associated videos. E.g., how many of these articles and videos are available since when?, and who has been publishing these videos? Hence, we analyzed 410,101 articles with 228,192 unique DOIs referenced in 137,629 videos uploaded by 39,416 channels, using data provided by Altmetric.com. As a result, the total number of scholarly references on YouTube has increased rapidly since 2016 and has continued to grow. The top research fields of scholarly articles were Clinical Medicine and Multidisciplinary consistently. The most common channels in the number of videos associated with scholarly references were hosted by publishers and academic societies, SciShow, and other individuals/organizations.

Jiro Kikkawa

December 01, 2023
Tweet

More Decks by Jiro Kikkawa

Other Decks in Research

Transcript

  1. Quantitative Analysis of Scholarly References on YouTube 1 ICADL2023 –

    Session 7: Social Media Analytics Jiro Kikkawa Masao Takaku Fuyuki Yoshikane { jiro, masao, fuyuki } @ slis.tsukuba.ac.jp Focusing on Their Research Fields and Contributors Institute of Library, Information and Media Science, University of Tsukuba, Japan
  2. 2 Background #1 Scholarly communication through video has spread more

    and more in recent years • Researchers are increasingly supplementing scholarly articles with video summaries to bridge the gap with society and enhance engagement with a broader audience • A number of research to measure these new impacts have been conducted as the research of Altmetrics • YouTube, the largest online video platform is used to share various videos including content related to these kinds of scholarly knowledge
  3. 3 Background #2 Scholarly communication through video has spread more

    and more in recent years • A number of research to measure these new impacts have been conducted as the research of Altmetrics • Researchers are increasingly supplementing scholarly articles with video summaries to bridge the gap with society and enhance engagement with a broader audience • YouTube, the largest online video platform is used to share various videos including content related to these kinds of scholarly knowledge However, there is a lack of investigations on the scholarly articles and their associated videos • How many of these articles and videos are available since when? • Who has been publishing these videos?
  4. 4 Background #3 Scholarly references on YouTube Source: How Smart

    Are Crows Actually? - YouTube https://www.youtube.com/watch?v=nk8-tTFIBk8
  5. 5 Background #4 Source: How Smart Are Crows Actually? -

    YouTube https://www.youtube.com/watch?v=nk8-tTFIBk8 Scholarly references on YouTube
  6. Materials and Methods 8 We collected scholarly references on YouTube

    via Altmetric Explore provided by Altmetric.com • We used the search conditions where the target is “all mentions,” and the source type is “Videos” on April 10th, 2023, and obtained 457,453 scholarly references on 153,398 YouTube videos. - We excluded the data if Crossref metadata was unavailable, or the ISSN numbers did not match the Essential Science Indicators (ESI) categories.
  7. 1. How do the numbers of scholarly references and the

    associated videos and channels transition over time? 10 Year # of total DOIs # of unique DOIs # of unique Videos # of unique Channels 2006 18 17 8 7 2007 173 105 115 42 2008 526 311 330 136 2009 897 587 701 329 2010 1,962 1,130 1,536 447 2011 2,411 1,716 1,746 703 2012 4,706 3,272 3,613 1,305 2013 6,343 4,984 4,642 1,586 2014 8,861 7,072 6,022 2,079 2015 9,972 8,518 6,177 1,834 2016 15,829 12,747 7,046 2,731 2017 31,548 22,382 12,049 4,830 2018 42,595 31,637 14,364 5,842 2019 49,921 35,908 14,042 5,650 2020 44,984 33,878 11,677 5,518 2021 73,546 51,808 19,160 7,522 2022 87,392 60,717 27,041 7,258 2023 28,417 20,147 7,360 2,861 Overall 410,101 228,192 137,629 39,416 Table. Number of scholarly references and the videos and channels associated with them for each year based on the published date of each video • As a whole, 410,101 scholarly articles corresponding to 228,192 unique DOIs were referenced on 137,629 videos uploaded by 39,416 channels
  8. 1. How do the numbers of scholarly references and the

    associated videos and channels transition over time? 11 Year # of total DOIs # of unique DOIs # of unique Videos # of unique Channels 2006 18 17 8 7 2007 173 105 115 42 2008 526 311 330 136 2009 897 587 701 329 2010 1,962 1,130 1,536 447 2011 2,411 1,716 1,746 703 2012 4,706 3,272 3,613 1,305 2013 6,343 4,984 4,642 1,586 2014 8,861 7,072 6,022 2,079 2015 9,972 8,518 6,177 1,834 2016 15,829 12,747 7,046 2,731 2017 31,548 22,382 12,049 4,830 2018 42,595 31,637 14,364 5,842 2019 49,921 35,908 14,042 5,650 2020 44,984 33,878 11,677 5,518 2021 73,546 51,808 19,160 7,522 2022 87,392 60,717 27,041 7,258 2023 28,417 20,147 7,360 2,861 Overall 410,101 228,192 137,629 39,416 • Regarding the total and unique numbers of DOIs, they were small, from a few dozen to several hundred in 2006-2009 • They exceeded 1,000 and 10,000 in 2010 and 2016, respectively • Their size has continued to grow since 2017
  9. 2023/06/21 15:42 plot_yymm_v2.html file:///Users/mona26/Dropbox/working/2023-03-08_altmetric_com/main/basic_stats/plot_yymm/plot_yymm_v2.html 1/1 2012 2013 2014 2015 2016

    2017 2018 2019 2020 2021 2022 2023 0 1,000 2,000 3,000 4,000 5,000 6,000 7,000 8,000 9,000 10,000 500 1,500 2,500 3,500 4,500 5,500 6,500 7,500 8,500 9,500 # of total DOIs # of unique Videos # of unique Channels 1. How do the numbers of scholarly references and the associated videos and channels transition over time? 12 Figure. Monthly plot of the time-series transitions for the scholarly references and the videos and channels associated with them since January 2012 based on the published date of each video. Dashed lines show the month of January for each year.
  10. 2023/06/21 15:42 plot_yymm_v2.html file:///Users/mona26/Dropbox/working/2023-03-08_altmetric_com/main/basic_stats/plot_yymm/plot_yymm_v2.html 1/1 2012 2013 2014 2015 2016

    2017 2018 2019 2020 2021 2022 2023 0 1,000 2,000 3,000 4,000 5,000 6,000 7,000 8,000 9,000 10,000 500 1,500 2,500 3,500 4,500 5,500 6,500 7,500 8,500 9,500 # of total DOIs # of unique Videos # of unique Channels 1. How do the numbers of scholarly references and the associated videos and channels transition over time? 13 The spike in 2022 was caused by JoVE (Journal of Visualized Experiments) channel Figure. Monthly plot of the time-series transitions for the scholarly references and the videos and channels associated with them since January 2012 based on the published date of each video. Dashed lines show the month of January for each year.
  11. 2. Do the highly referenced research fields of scholarly references

    change over time? 14 # ESI category # ESI category 1 Clinical Medicine 28.94% 12 Environment/Ecology 1.99% 2 Multidisciplinary 14.50% 13 Chemistry 1.95% 3 Biology & Biochemistry 7.60% 14 Microbiology 1.87% 4 Neuroscience & Behavior 6.61% 15 Geosciences 1.86% 5 Psychiatry/Psychology 6.17% 16 Space Science 1.50% 6 Agricultural Sciences 5.36% 17 Physics 1.38% 7 Social Sciences, General 4.23% 18 Engineering 1.02% 8 Pharmacology & Toxicology 3.98% 19 Materials Science 0.76% 9 Molecular Biology & Genetics 3.90% 20 Economics & Business 0.69% 10 Plant & Animal Science 3.04% 21 Computer Science 0.35% 11 Immunology 2.17% 22 Mathematics 0.15% Table. Distribution of the ESI categories corresponding to unique DOIs (n=187,102) • Of 228,192 unique DOIs on the dataset, 187,099 DOIs (88.19%) were matched to the ESI categories. 3 DOIs were matched to two categories. • The most common ESI category was Clinical Medicine, followed by Multidisciplinary
  12. 3. What kind of YouTube channels (contributors) are the most

    common in the number of scholarly references and videos? 15 # Videos associated with scholarly references Total DOIs Unique DOIs Channel Title 1 6,730 78.02% 6,750 6,612 JoVE 2 2,287 69.18% 12,898 12,506 SciShow 3 1,640 86.00% 1,677 1,623 Research Square 4 1,234 20.99% 1,235 1,235 ScienceVio 5 1,114 44.42% 1,114 1,041 Dove Medical Press 6 1,055 26.53% 1,413 1,392 Seeker 7 772 33.02% 5,782 3,754 Thomas DeLauer 8 696 21.96% 1,091 1,039 Anton Petrov 9 696 44.73% 717 700 Cell Press 10 673 16.69% 703 567 SpringerVideos 11 636 15.13% 636 632 ACM 12 593 29.98% 2,793 5 Vika Diamante Table. Top 12 channels for the number of videos associated with scholarly references.
  13. 3. What kind of YouTube channels (contributors) are the most

    common in the number of scholarly references and videos? 16 # Videos associated with scholarly references Total DOIs Unique DOIs Channel Title 1 6,730 78.02% 6,750 6,612 JoVE 2 2,287 69.18% 12,898 12,506 SciShow 3 1,640 86.00% 1,677 1,623 Research Square 4 1,234 20.99% 1,235 1,235 ScienceVio 5 1,114 44.42% 1,114 1,041 Dove Medical Press 6 1,055 26.53% 1,413 1,392 Seeker 7 772 33.02% 5,782 3,754 Thomas DeLauer 8 696 21.96% 1,091 1,039 Anton Petrov 9 696 44.73% 717 700 Cell Press 10 673 16.69% 703 567 SpringerVideos 11 636 15.13% 636 632 ACM 12 593 29.98% 2,793 5 Vika Diamante Table. Top 12 channels for the number of videos associated with scholarly references. Highlighted with Yellow shows the channels of publisher and academic societies
  14. 3. What kind of YouTube channels (contributors) are the most

    common in the number of scholarly references and videos? 17 # Videos associated with scholarly references Total DOIs Unique DOIs Channel Title 1 6,730 78.02% 6,750 6,612 JoVE 2 2,287 69.18% 12,898 12,506 SciShow 3 1,640 86.00% 1,677 1,623 Research Square 4 1,234 20.99% 1,235 1,235 ScienceVio 5 1,114 44.42% 1,114 1,041 Dove Medical Press 6 1,055 26.53% 1,413 1,392 Seeker 7 772 33.02% 5,782 3,754 Thomas DeLauer 8 696 21.96% 1,091 1,039 Anton Petrov 9 696 44.73% 717 700 Cell Press 10 673 16.69% 703 567 SpringerVideos 11 636 15.13% 636 632 ACM 12 593 29.98% 2,793 5 Vika Diamante Table. Top 12 channels for the number of videos associated with scholarly references. • JoVE (#1) uploaded the preview versions of video abstracts in the Journal of Visualized Experiments, which is a peer-reviewed scientific video journal • According to the description texts of the videos, they are preview versions, and full versions of video abstracts are provided on the publisher's website for the subscribers
  15. 3. What kind of YouTube channels (contributors) are the most

    common in the number of scholarly references and videos? 18 # Videos associated with scholarly references Total DOIs Unique DOIs Channel Title 1 6,730 78.02% 6,750 6,612 JoVE 2 2,287 69.18% 12,898 12,506 SciShow 3 1,640 86.00% 1,677 1,623 Research Square 4 1,234 20.99% 1,235 1,235 ScienceVio 5 1,114 44.42% 1,114 1,041 Dove Medical Press 6 1,055 26.53% 1,413 1,392 Seeker 7 772 33.02% 5,782 3,754 Thomas DeLauer 8 696 21.96% 1,091 1,039 Anton Petrov 9 696 44.73% 717 700 Cell Press 10 673 16.69% 703 567 SpringerVideos 11 636 15.13% 636 632 ACM 12 593 29.98% 2,793 5 Vika Diamante Table. Top 12 channels for the number of videos associated with scholarly references. • Research Square (#3) is a preprint platform and they uploaded the video abstracts called the Video Bytes, which are 1-2 minutes video summaries • Dove Medical Press (#5) is a journal with the option to submit video abstracts and encourage submitting them along with the research papers
  16. 3. What kind of YouTube channels (contributors) are the most

    common in the number of scholarly references and videos? 19 # Videos associated with scholarly references Total DOIs Unique DOIs Channel Title 1 6,730 78.02% 6,750 6,612 JoVE 2 2,287 69.18% 12,898 12,506 SciShow 3 1,640 86.00% 1,677 1,623 Research Square 4 1,234 20.99% 1,235 1,235 ScienceVio 5 1,114 44.42% 1,114 1,041 Dove Medical Press 6 1,055 26.53% 1,413 1,392 Seeker 7 772 33.02% 5,782 3,754 Thomas DeLauer 8 696 21.96% 1,091 1,039 Anton Petrov 9 696 44.73% 717 700 Cell Press 10 673 16.69% 703 567 SpringerVideos 11 636 15.13% 636 632 ACM 12 593 29.98% 2,793 5 Vika Diamante Table. Top 12 channels for the number of videos associated with scholarly references. • Cell Press (#9) is a journal with the option to submit video abstracts and encourage submitting them along with the research papers • SpringerVideos (#10) is the channel of SpringerNature and they adopted Video Bytes • ACM (#11) is the channel of the Association for Computing Machinery, and they uploaded videos referring to their international conference proceedings papers
  17. 3. What kind of YouTube channels (contributors) are the most

    common in the number of scholarly references and videos? 20 # Videos associated with scholarly references Total DOIs Unique DOIs Channel Title 1 6,730 78.02% 6,750 6,612 JoVE 2 2,287 69.18% 12,898 12,506 SciShow 3 1,640 86.00% 1,677 1,623 Research Square 4 1,234 20.99% 1,235 1,235 ScienceVio 5 1,114 44.42% 1,114 1,041 Dove Medical Press 6 1,055 26.53% 1,413 1,392 Seeker 7 772 33.02% 5,782 3,754 Thomas DeLauer 8 696 21.96% 1,091 1,039 Anton Petrov 9 696 44.73% 717 700 Cell Press 10 673 16.69% 703 567 SpringerVideos 11 636 15.13% 636 632 ACM 12 593 29.98% 2,793 5 Vika Diamante Table. Top 12 channels for the number of videos associated with scholarly references. • SciShow is the channel uploading videos related to scientific subjects such as science, news, history, particle physics, chemistry, biology, and psychology
  18. • We analyzed scholarly references on YouTube using the data

    provided by Altmteric.com • 410,101 articles corresponding to 228,192 unique DOIs referenced on 137,629 videos uploaded by 39,416 channels as of April 10th, 2023 • The total number of scholarly references on YouTube has increased rapidly since 2016 and has continued to grow • The top research fields of scholarly articles were Clinical Medicine and Multidisciplinary, regardless of the year of each video published • The most common channels in the number of videos associated with scholarly references were hosted by publishers and academic societies, SciShow, and other individuals/organizations. Conclusion #1 21
  19. Limitations and Future works • In this study, we were

    unable to analyze the scholarly references on YouTube not covered by Altmetric.com • YouTube channels tracked by Altmetric.com are curated • Considering this matter, - We are working to build a more comprehensive dataset of scholarly references on YouTube by searching videos directly via YouTube Data API, supported by the YouTube Researcher Program Acknowledgments • This work was partially supported by JSPS KAKENHI Grant Numbers JP22K18147, JP21K12592, and JP23K11761 • We are grateful to Altmetric.com (https://www.altmetric.com/) for providing valuable data through the researcher data access program Conclusion #2 22
  20. Quantitative Analysis of Scholarly References on YouTube 23 ICADL2023 –

    Session 7: Social Media Analytics Jiro Kikkawa Masao Takaku Fuyuki Yoshikane { jiro, masao, fuyuki } @ slis.tsukuba.ac.jp Focusing on Their Research Fields and Contributors Institute of Library, Information and Media Science, University of Tsukuba, Japan