Upgrade to Pro — share decks privately, control downloads, hide ads and more …

Using big data to detect hardware manufacturing defects

Dale Humby
February 23, 2016

Using big data to detect hardware manufacturing defects

How Nomanini reduces manufacturing defects by statistically analysing all components on our printed circuit board assemblies (PCBA's) in the factory.

Dale Humby

February 23, 2016
Tweet

More Decks by Dale Humby

Other Decks in Programming

Transcript

  1. GDE Using big data to detect hardware manufacturing defects Dale

    Humby CTO, Nomanini Google Developer Expert for Cloud Platform
  2. GDE

  3. GDE

  4. GDE Reduce hardware costs • Design: Use commodity parts •

    Supply chain: Volume purchasing, negotiation, 30-90 day terms • Cheap to assemble (30% cost from assembly) • Low failure rate
  5. GDE Bed of nails Test jig v2.0 PCBA Multiplexer Power

    supply Measurement equipment Test jig software
  6. JSON GDE Test results POST /manufacturing/pcbas/{imei}/tests { "valid_time": "2015-10-10T18:00:00+00:00", "has_passed":

    true, "test_results": { "test_VUSB": { "measurements": [{ "type": "VoltageDC", "result": 4.9020582 }], "result": "PASS" }, …… } }
  7. GDE { "valid_time": "2015-10-10T18:00:00+00:00", "has_passed": true, "test_results": { "test_time": "2016-02-18T18:30:42.724823",

    "tests": { "test_R127": { "measurements": [{ "alias": “R127[TP46_TP65]", "line": 625, "type": “Resistance", "result": 860.55917 }], "result": “PASS" }, "test_R111": { "measurements": [{ "alias": “BAT-GND[TP68]", "line": 618, "type": “Resistance", "result": 0 }], "result": “PASS" }, ... x 100’s of tests ... } SELECT * FROM [MANUFACTURE.pcba_test_results_flattened] Flatten JSON with User Defined Fnct
  8. GDE Top failing tests Top failing tests 724 % test_FUSE_2V5

    92 13% test_R5_R6_divider 72 23% test_VBUS_CHARGE 70 32% test_VUSB_PROT 43 38% test_VDDANA 43 44% test_L3 40 50% test_VSYS 39 55% test_VDDIODDR 39 60% test_can_the_circuit_power_up 39 66% test_VDDCORE 39 71% test_R6 28 75% test_R128 18 78% test_R37 15 80%
  9. SQL GDE Stats of all the tests SELECT test_name, alias,

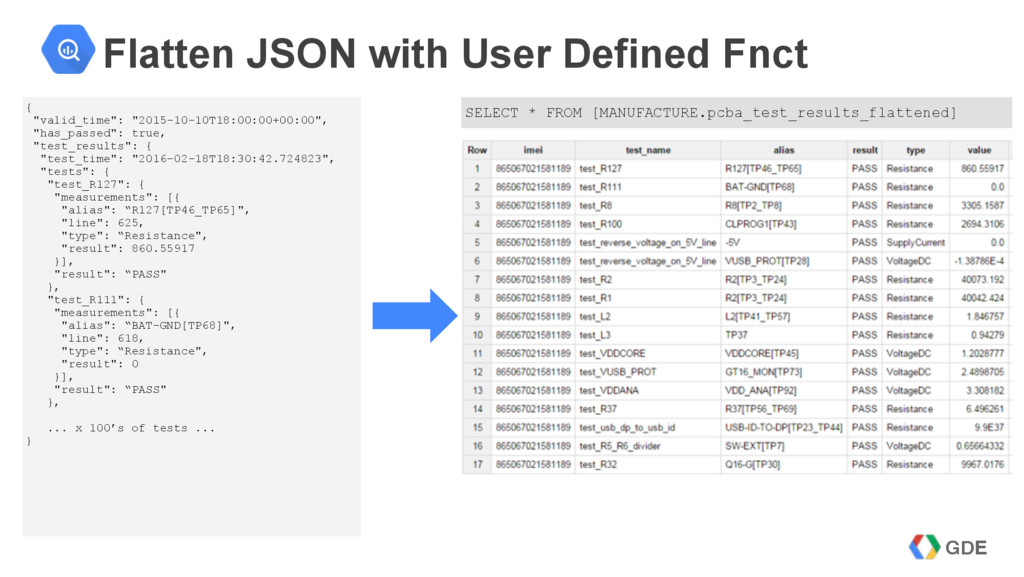
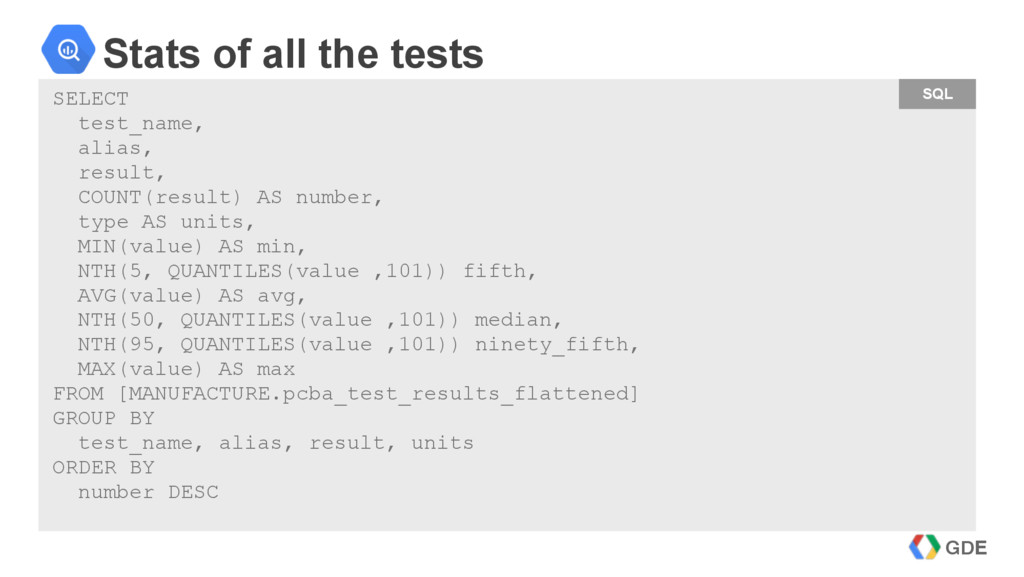
    result, COUNT(result) AS number, type AS units, MIN(value) AS min, NTH(5, QUANTILES(value ,101)) fifth, AVG(value) AS avg, NTH(50, QUANTILES(value ,101)) median, NTH(95, QUANTILES(value ,101)) ninety_fifth, MAX(value) AS max FROM [MANUFACTURE.pcba_test_results_flattened] GROUP BY test_name, alias, result, units ORDER BY number DESC
  10. GDE Analysis of R32 test_name result numberunits min fifth avg

    median ninety_fifth max test_R32 PASS 542 Resistance 9880.428 9896.257 9929.666 9929.325 9959.646 9996.525 test_R32 FAIL 9 Resistance 0 0 7.70E+37 9.90E+37 9.90E+37 9.90E+37 % Error 1.20% 1.04% 0.70% 0.71% 0.40% 0.03%
  11. GDE Vsys (3V3) test_name result numberunits min fifth avg median

    ninety_fifth max test_VSYS P A S S 512 VoltageDC 3.281589 3.287578 3.297513 3.297278 3.307268 3.317785 test_VSYS FAIL 39 VoltageDC -0.00198 -0.00163 0.065324 0.075967 0.082376 0.082787 % Error -0.56% -0.38% -0.08% -0.08% 0.22% 0.54%
  12. R GDE Shift in production process > t.test(r32$old, r32$new) Welch

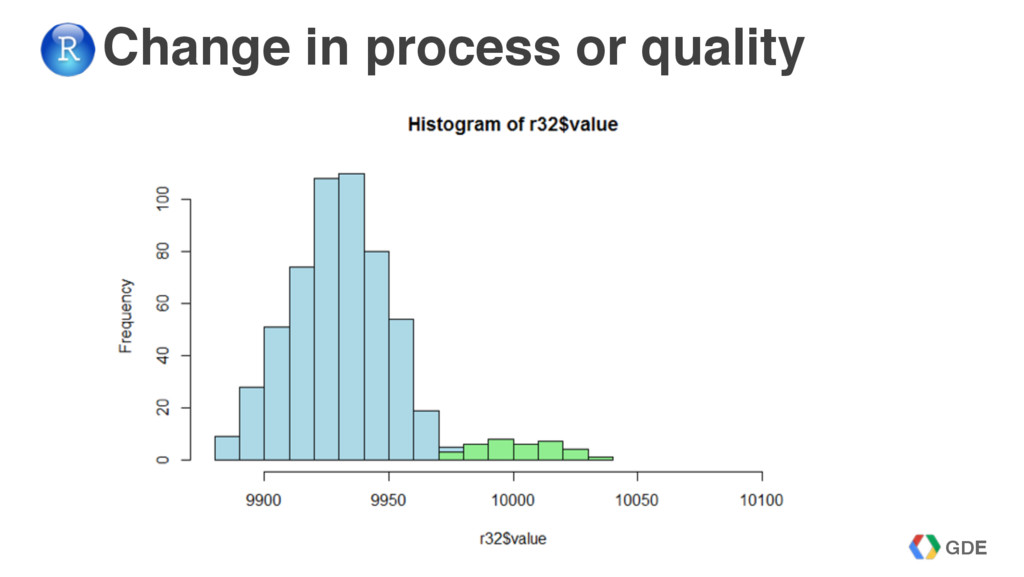
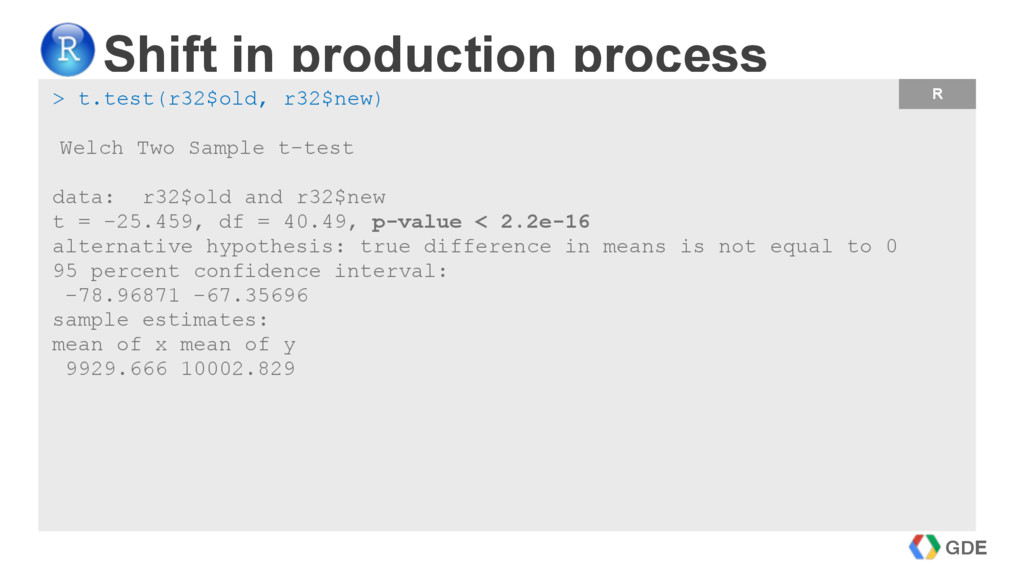
    Two Sample t-test data: r32$old and r32$new t = -25.459, df = 40.49, p-value < 2.2e-16 alternative hypothesis: true difference in means is not equal to 0 95 percent confidence interval: -78.96871 -67.35696 sample estimates: mean of x mean of y 9929.666 10002.829
  13. GDE