Upgrade to Pro — share decks privately, control downloads, hide ads and more …

From 1 release a month to 6 per day

From 1 release a month to 6 per day

Slides from my talk at the Cape Town Scrum Users Group (SUGSA) on Nomanini's lessons from Scrum, Kanban & Continuous Delivery.

Dale Humby

April 02, 2015
Tweet

More Decks by Dale Humby

Other Decks in Technology

Transcript

  1. From 1 release a month to 6 per day Lessons

    from Scrum, Kanban & Continuous Delivery Dale Humby CTO, Nomanini
  2. Why Continuous Delivery? • Product discovery • Start-up = Limited

    cash runway • Small team • Fintech hotly contested market • Established competition, years ahead
  3. “Move fast and break things” Week 1: 80% Week 2:

    80% Week 3: 80% Week 1: Week 2: 95% Week 3:
  4. “Move fast and break things” Week 1: 80% Week 2:

    80% Week 3: 80% Week 4: 80% Week 1: Week 2: 95% Week 3: Week 4: 95%
  5. “Move fast and break things” Week 1: 80% Week 2:

    80% Week 3: 80% Week 4: 80% Week 1: Week 2: 95% Week 3: Week 4: 95% 99.84% 99.75%
  6. 2011: Scrum board: Sep - Nov Release Story Support Tech

    debt Planned In progress Done Fix bugs ? ?
  7. 2011: Scrum metrics 37 49 15 0 25 24 28

    29 16 29 23 13 12 25 18 18 16 19 0 38 9 9 5 20 0 5 10 15 20 25 30 35 40 45 50 01-Mar 08-Mar 15-Mar 22-Mar 29-Mar 05-Apr 12-Apr 19-Apr 26-Apr 03-May 10-May 17-May 24-May 31-May 07-Jun 14-Jun 21-Jun 28-Jun 05-Jul 12-Jul 19-Jul 26-Jul 02-Aug 09-Aug 16-Aug 23-Aug 30-Aug 06-Sep 13-Sep 20-Sep 27-Sep 04-Oct 11-Oct 18-Oct 25-Oct 01-Nov 08-Nov 15-Nov 22-Nov 29-Nov 06-Dec 13-Dec 20-Dec 27-Dec 03-Jan 10-Jan Team points per week Ave +1σ -1σ
  8. Kanban Dev Demo Analysis α Dev Plan Stbl A/B β

    Dev Demo Analysis α Dev Plan Stbl A/B β
  9. Classes of Work Dev Demo Analysis α Dev Plan Stbl

    A/B β Fast-track Fixed delivery date Standard Background
  10. Classes of Work: SLA’s Dev Demo Analysis α Dev Plan

    Stbl A/B β Fast-track Fixed delivery date Standard Background 2 days by date 5 days 5 days
  11. Reducing lead time 4 16 16 21 21 25 0

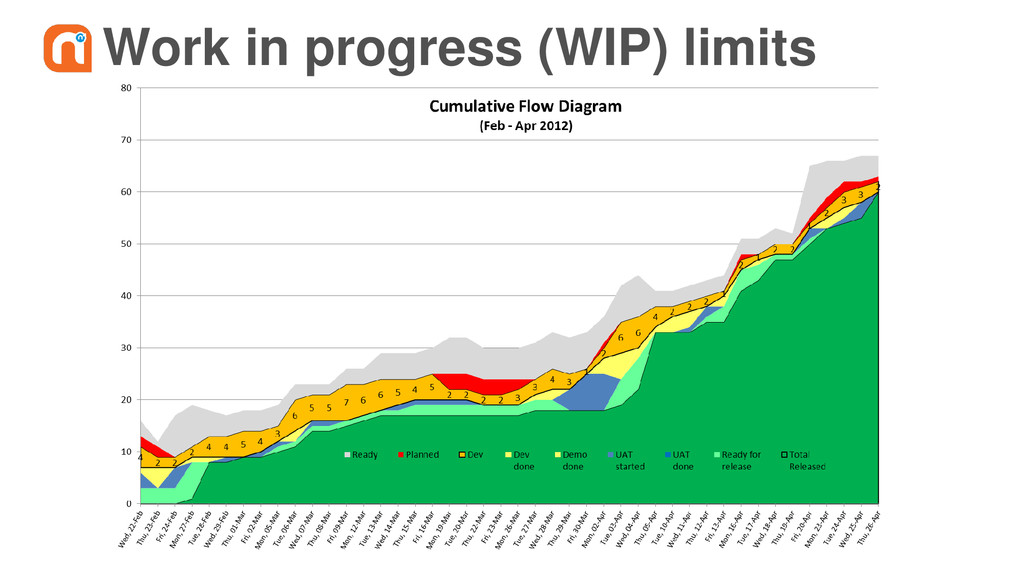
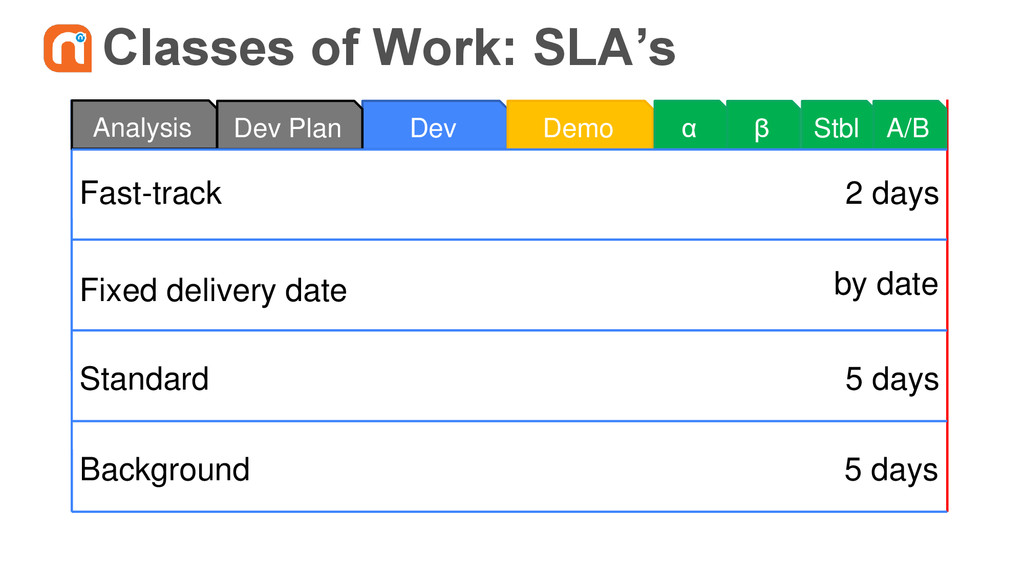
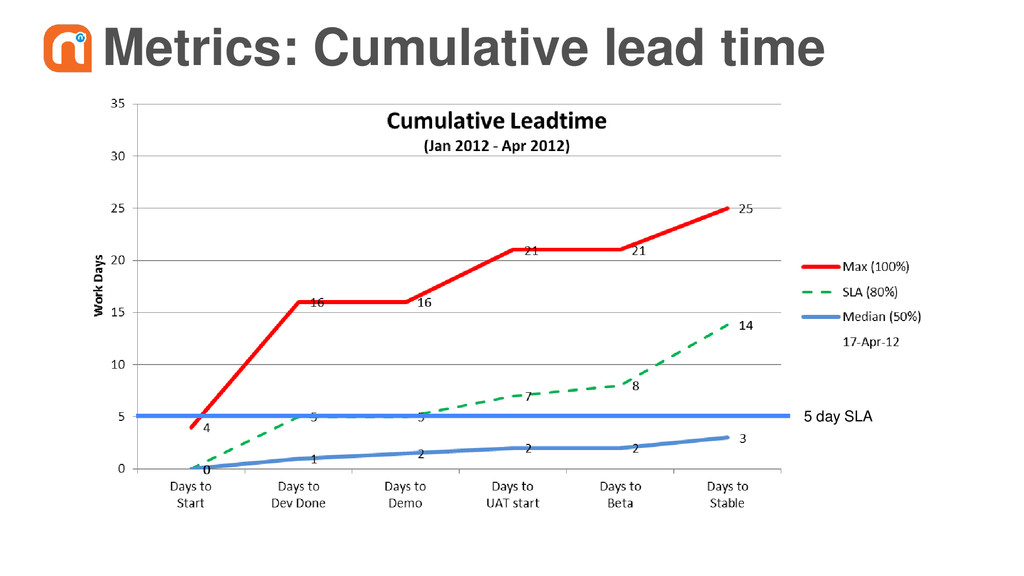
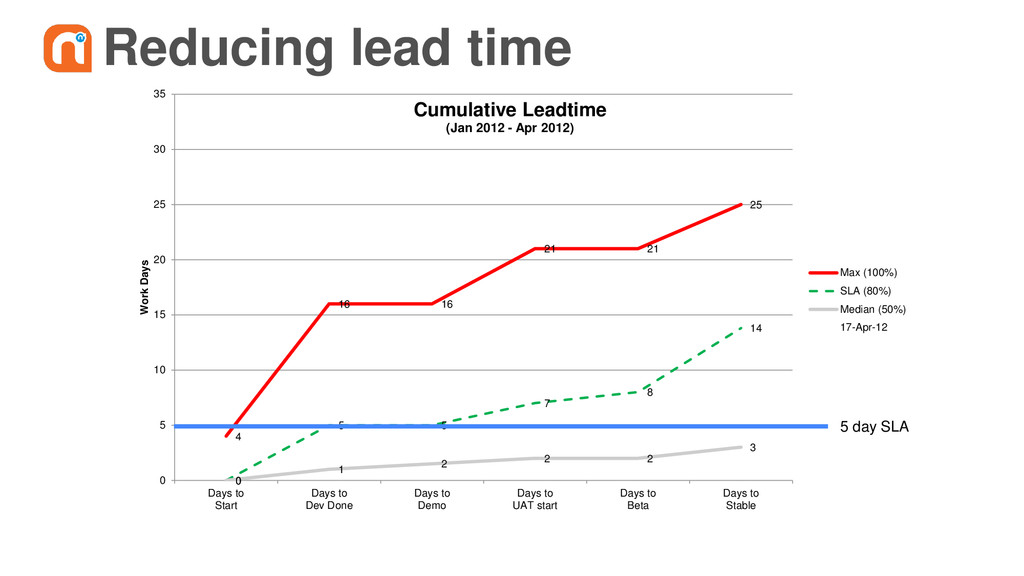
    5 5 7 8 14 0 1 2 2 2 3 0 5 10 15 20 25 30 35 Days to Start Days to Dev Done Days to Demo Days to UAT start Days to Beta Days to Stable Work Days Cumulative Leadtime (Jan 2012 - Apr 2012) Max (100%) SLA (80%) Median (50%) 17-Apr-12 5 day SLA
  12. Estimation 11% 21% 41% 60% 63% 70% 70% 79% 83%

    87% 95% 95% 95% 95% 97% 97% 97% 97% 98% 98% 98% 100% 0% 10% 20% 30% 40% 50% 60% 70% 80% 90% 100% 0 5 10 15 20 25 30 35 40 45 50 55 60 65 70 75 80 85 90 95 100 0 1 2 3 4 5 6 7 8 9 10 11 12 13 14 15 16 17 18 19 >=20 Cumulative distribution Occurences Number of days from Planning to Beta Leadtime Distribution (Standard stories) 1 Sep '14 - 28 Feb '15 Released in SLA Released outside SLA
  13. Release planning Roadmap planning Standard stories per month, previous 6

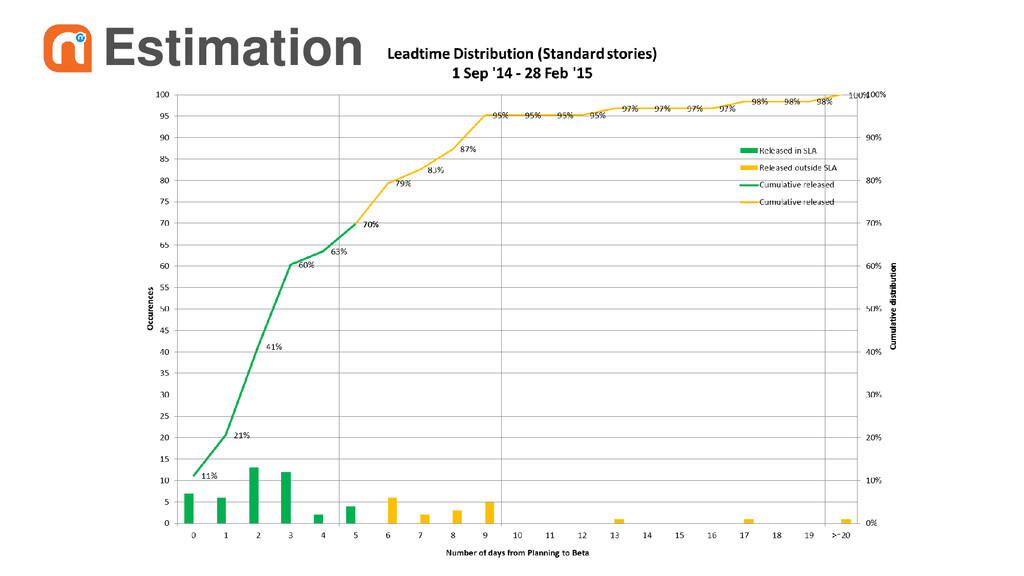
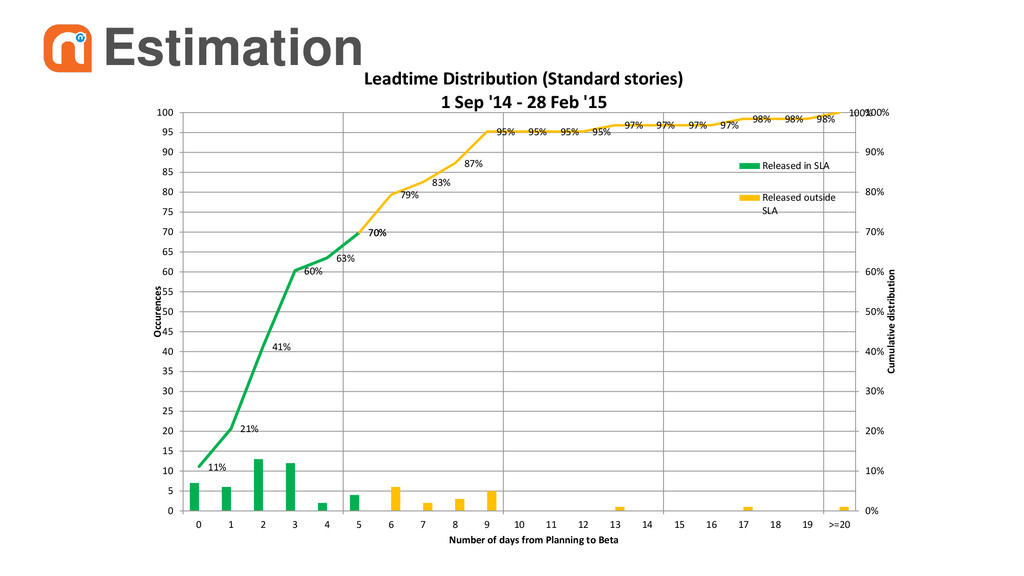
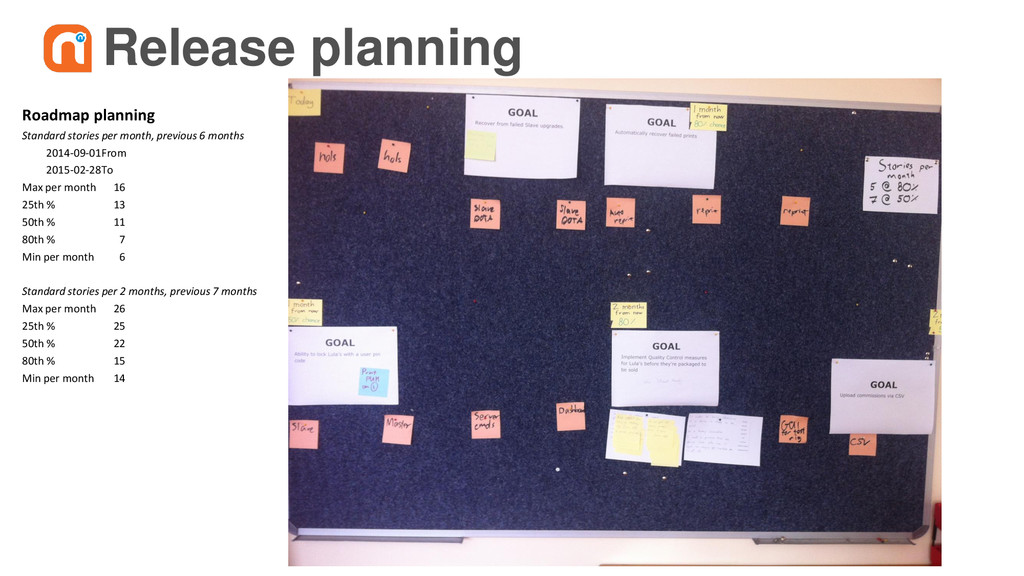
    months 2014-09-01 From 2015-02-28 To Max per month 16 25th % 13 50th % 11 80th % 7 Min per month 6 Standard stories per 2 months, previous 7 months Max per month 26 25th % 25 50th % 22 80th % 15 Min per month 14
  14. Building tools 2011 • Scrum, 0 – 50 devices •

    Automated tests run on desktop • Devices in office to upgrade 2012 • Kanban, 50 – 150 devices • CI, Jenkins • Bootloader, Manual DOTA • Automated provisioning (by hand, 45 min) • Runtime hardware/firmware config • Feature flags on master 2013 • 150 - 200 devices, 3 international clients • Parallel tests • Promote, dependency analysis • Semi-automated DOTA 2014 • 200-1000 devices, 7 international clients • Alpha, beta, stable groups • Automated rollout, remote provisioning • Valgrind, cpputest, x86 • Factory testing • Monitoring 2015 • 1k - 10k devices • ROI monitoring • Professional services • 3rd party integrations, API’s, • ROI/Validation metrics
  15. Reducing tech debt: 1story=2tasks Dev Demo Analysis α Dev Plan

    Stbl A/B β Fast-track Fixed delivery date Standard Background 2 days by date 5 days 5 days Story T T