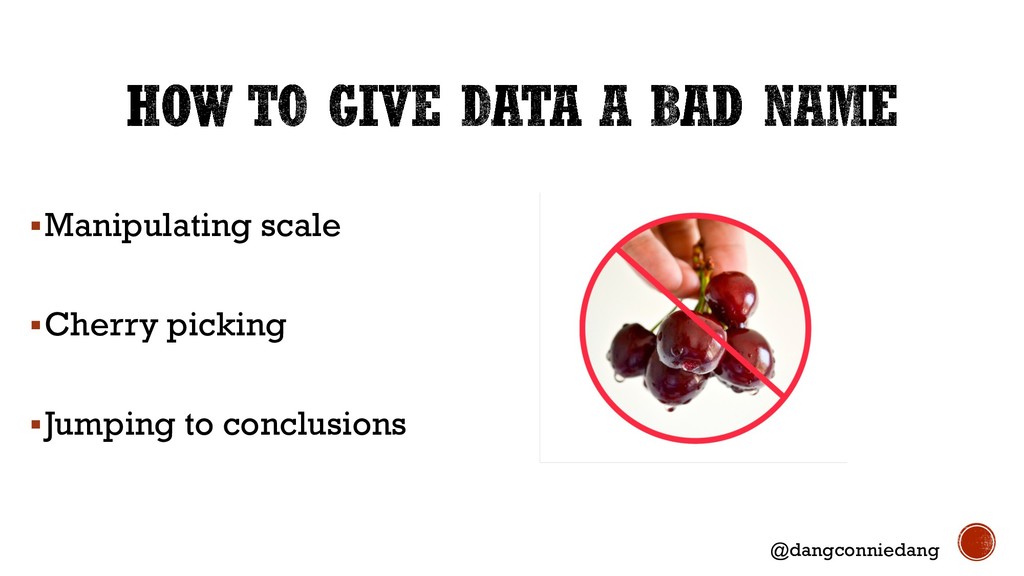
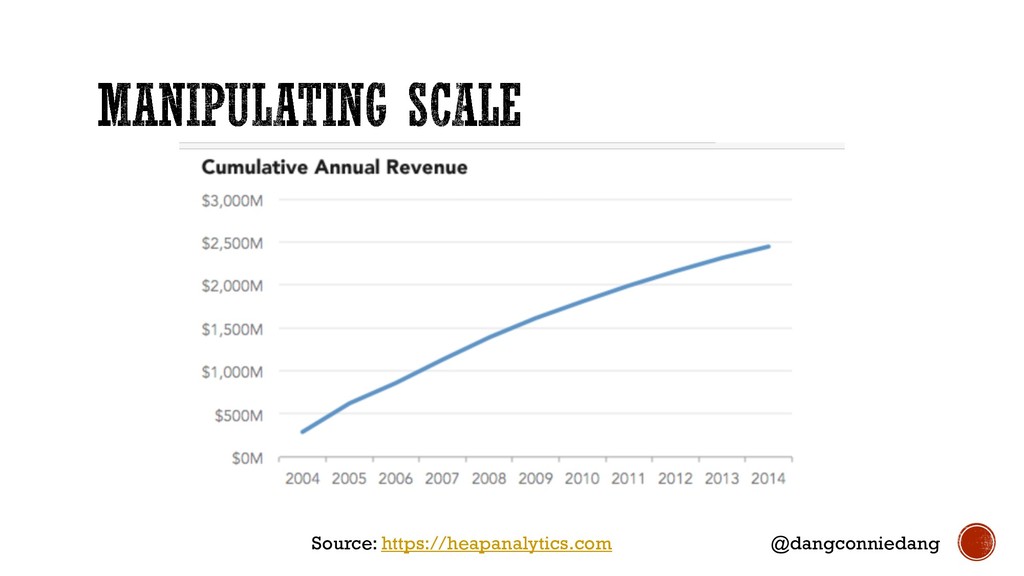
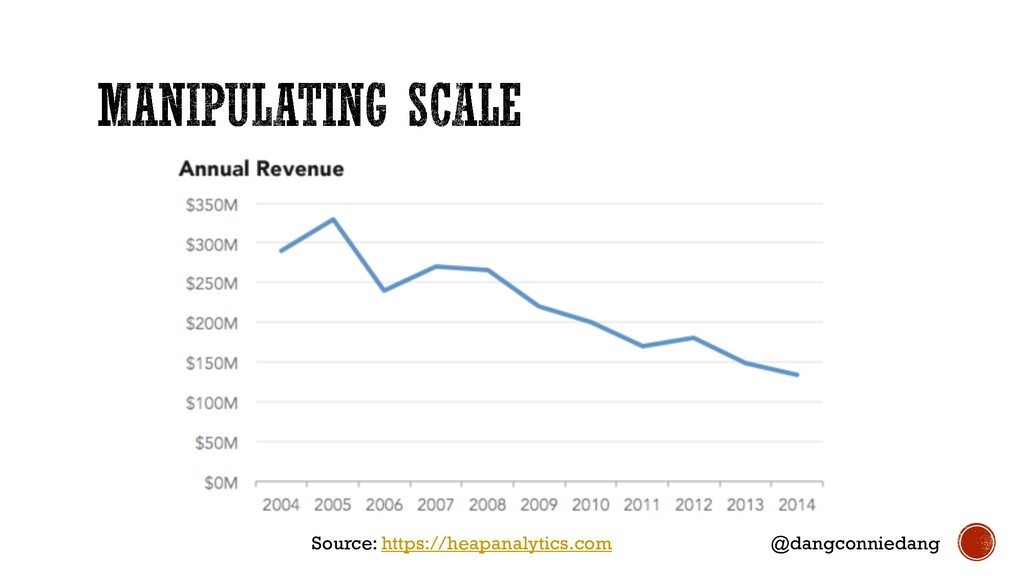
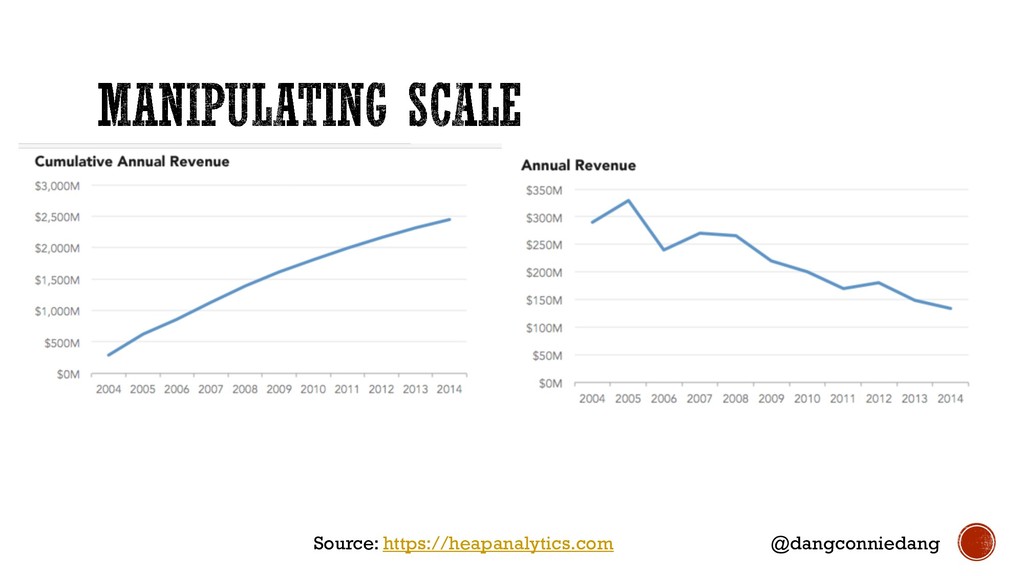
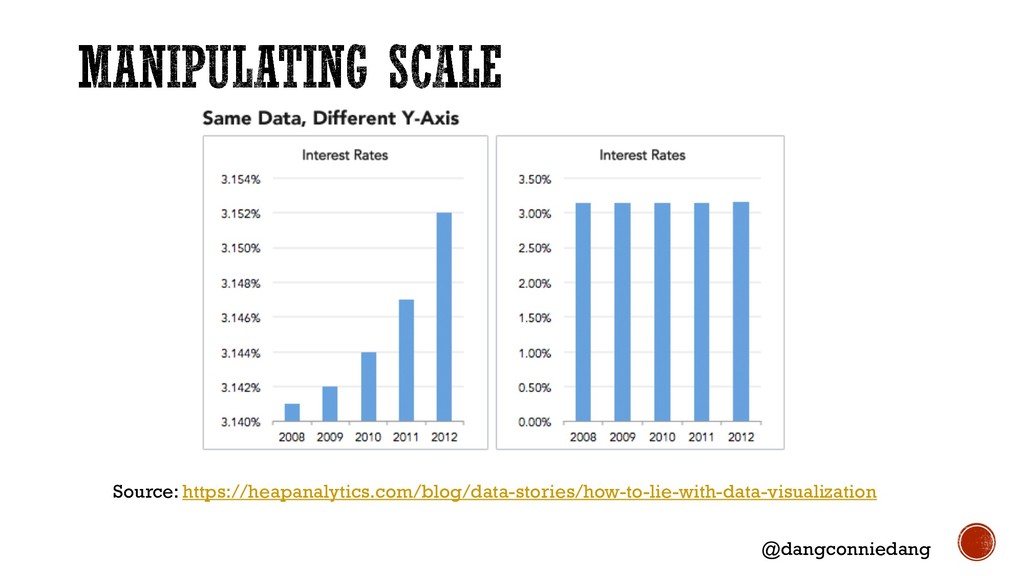
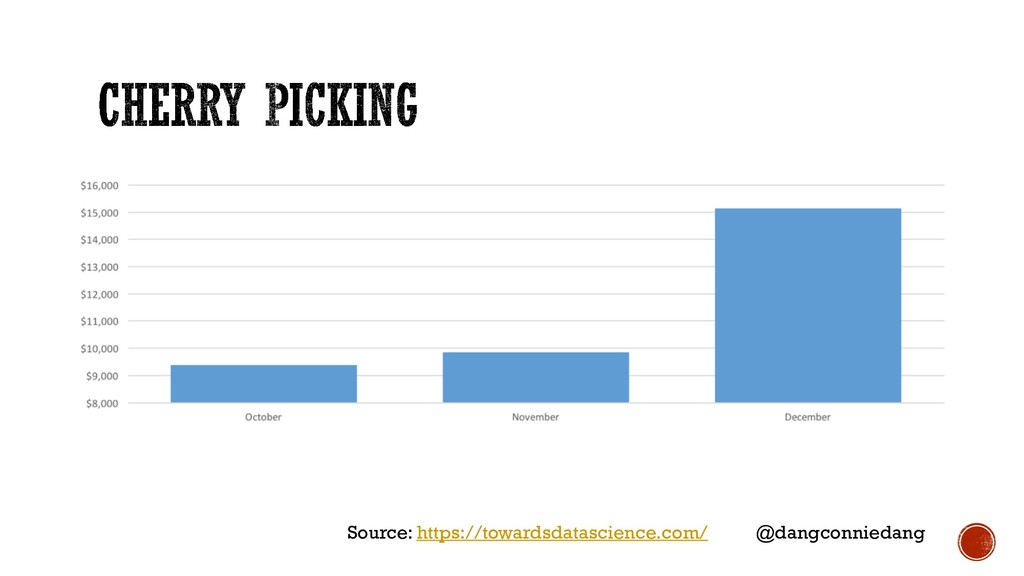
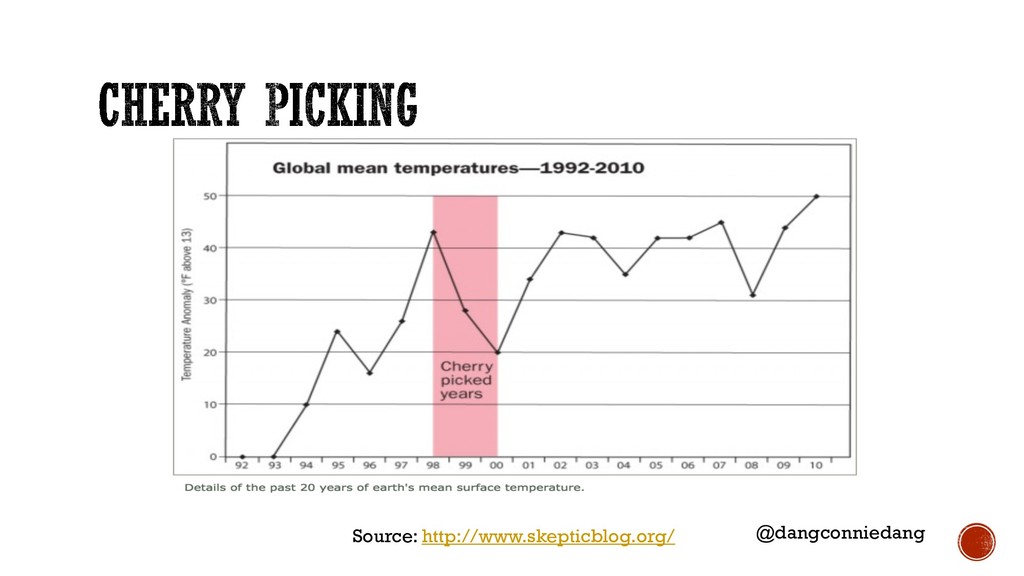
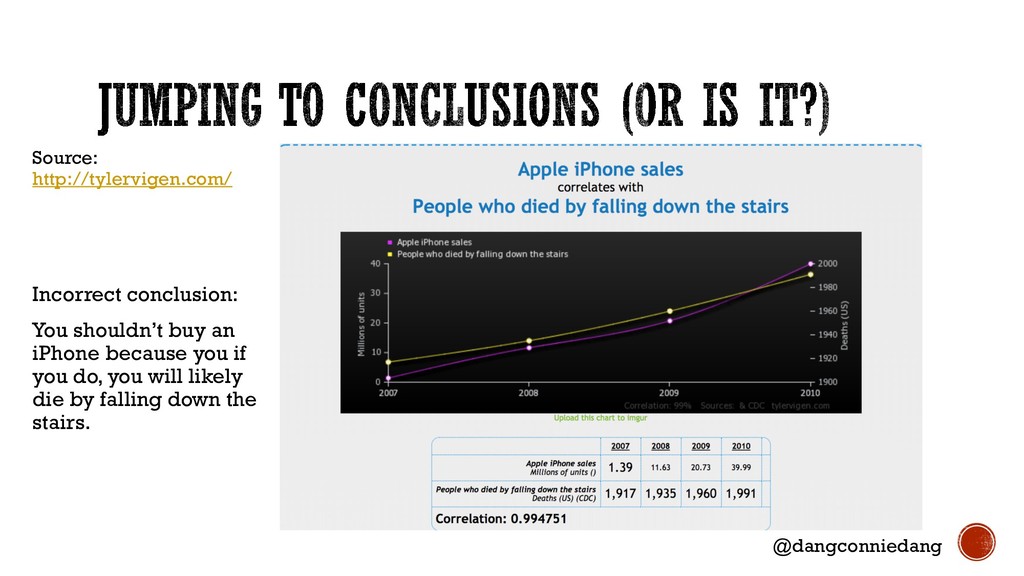
When we present data, we go through an arduous process of collecting, cleaning and extracting what we need. Yet when we skew data, we manipulate what we want others to see presenting an inaccurate representation of our data’s story. How do you know when data has been fudged?


 yu23ki14
 terurou
 codmoninc
 kakehashi
 kizawa2020
 makocchi
 kentarofujii
 y0hgi
 persolserverworks
 endonanana
 jtakeda
 moznion
 jonoalderson
 marktimemedia
 davetheseo
 davidcarrasco
 keithpitt
 helenjbeal
 axbom
 aleyda
 tammyeverts
 palkan
 retrage
 auna