Project: Estimating Scenarios for Domestic Water Demand Under Drought Conditions in the UK: Application of a Microsimulation Model) Dr. Despina Manouseli, Dr. Ben Anderson & Dr. Magesh Nagarajan Sustainable Energy Research Group Energy & Climate Change Division, Faculty of Engineering & Environment
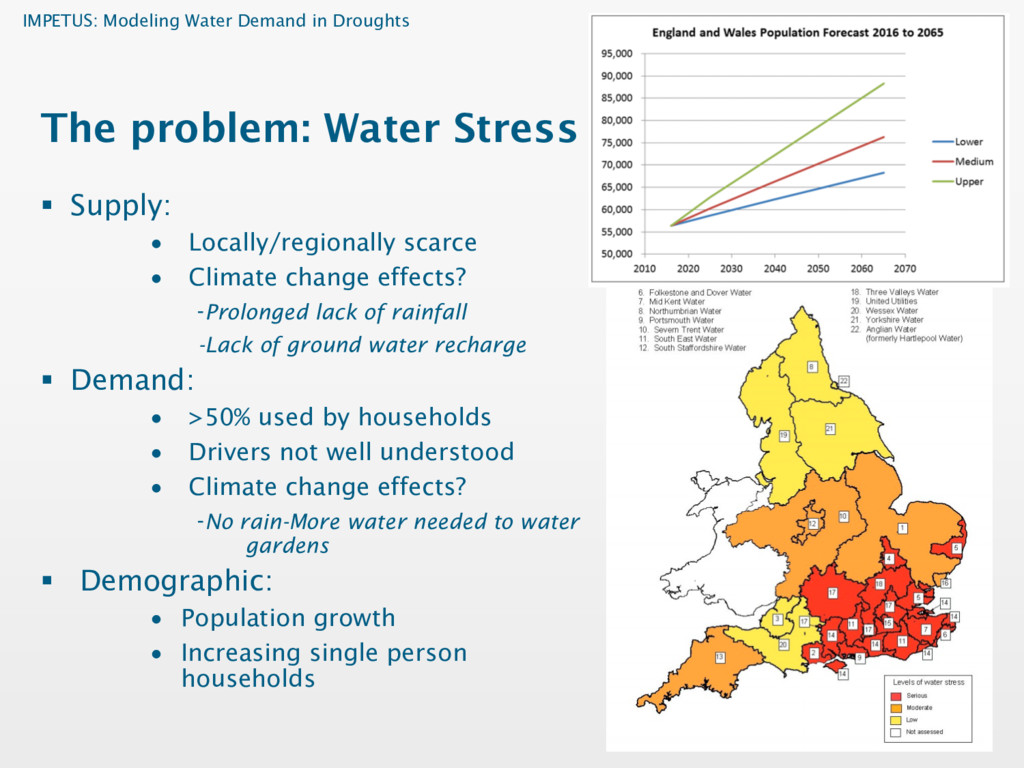
4 § Supply: • Locally/regionally scarce • Climate change effects? -Prolonged lack of rainfall -Lack of ground water recharge § Demand: • >50% used by households • Drivers not well understood • Climate change effects? -No rain-More water needed to water gardens § Demographic: • Population growth • Increasing single person households
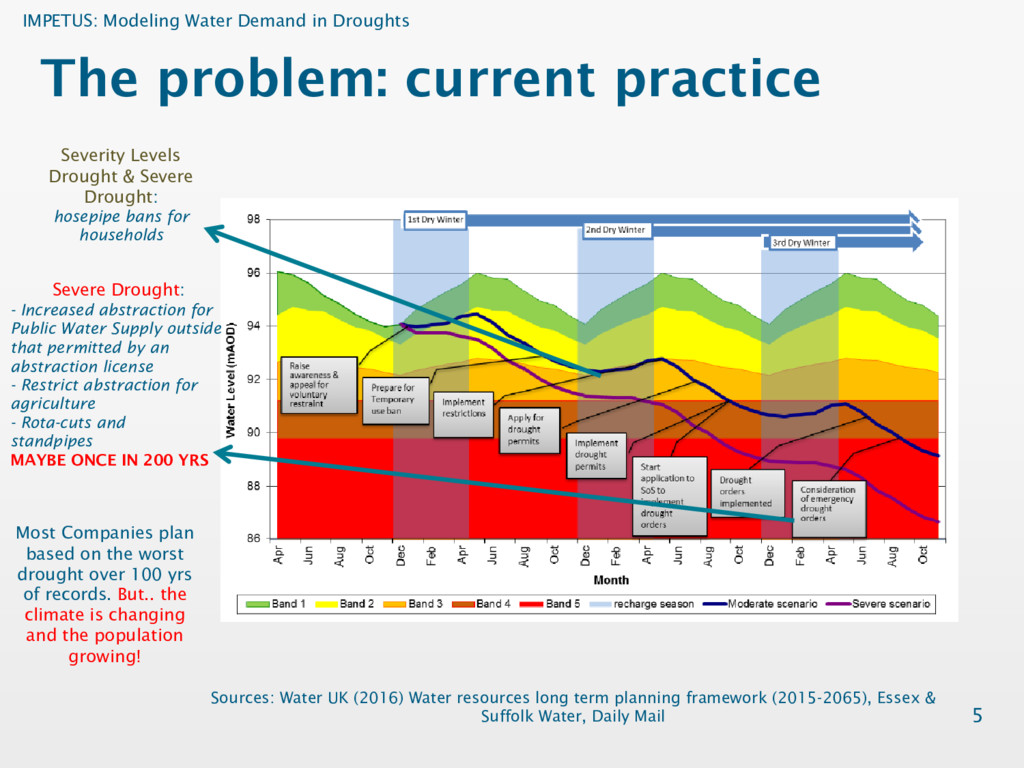
5 Sources: Water UK (2016) Water resources long term planning framework (2015-2065), Essex & Suffolk Water, Daily Mail Water Resources Long Term Planning Framework Water UK Figure 3-4 Illustration of typical sequence of drought interventions (taken from the Affinity Water Drought Plan) Example diagram of a drought trigger-response system. The purple and blue lines represent theoretical monitored groundwater levels during a two or three year event respectively. The green, yellow, orange and red bands represent ‘thresholds’ that are based on an analysis of historic records, and are used to help inform the company when it is making decisions on the level of demand restrictions and supply side interventions to take. The y-axis in this indicative diagram, presents the groundwater level (in metres above ordnance datum, mAOD). Severity Levels Drought & Severe Drought: hosepipe bans for households Severe Drought: - Increased abstraction for Public Water Supply outside that permitted by an abstraction license - Restrict abstraction for agriculture - Rota-cuts and standpipes MAYBE ONCE IN 200 YRS Most Companies plan based on the worst drought over 100 yrs of records. But.. the climate is changing and the population growing!
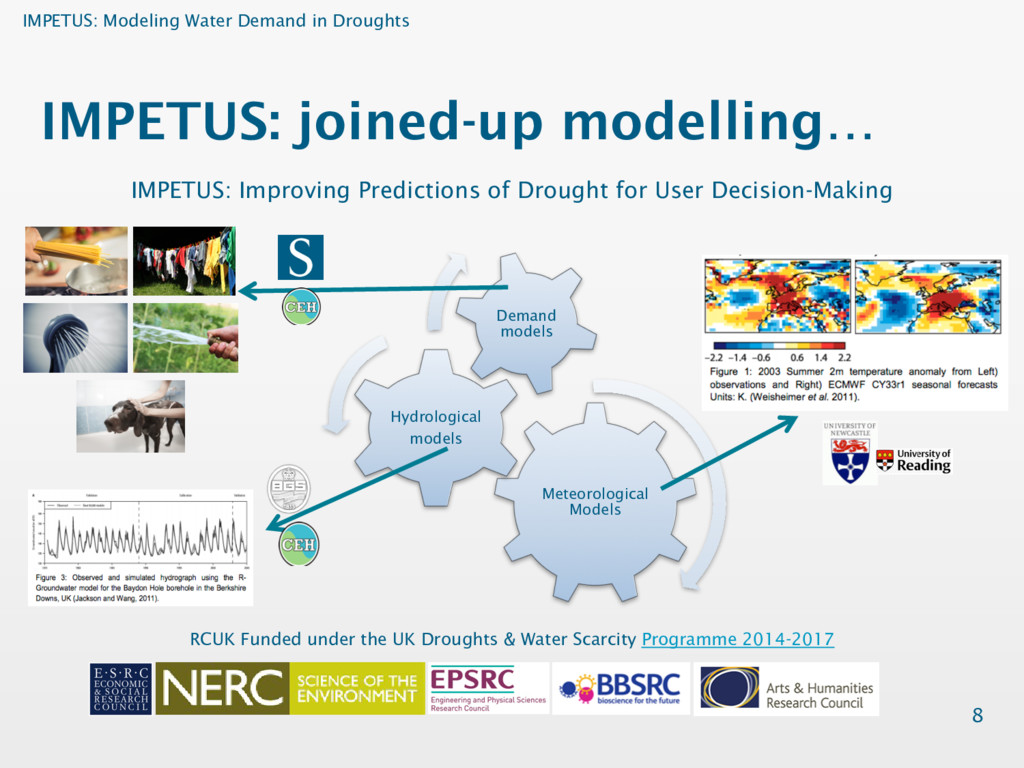
RCUK Funded under the UK Droughts & Water Scarcity Programme 2014-2017 IMPETUS: Improving Predictions of Drought for User Decision-Making Meteorological Models Hydrological models Demand models
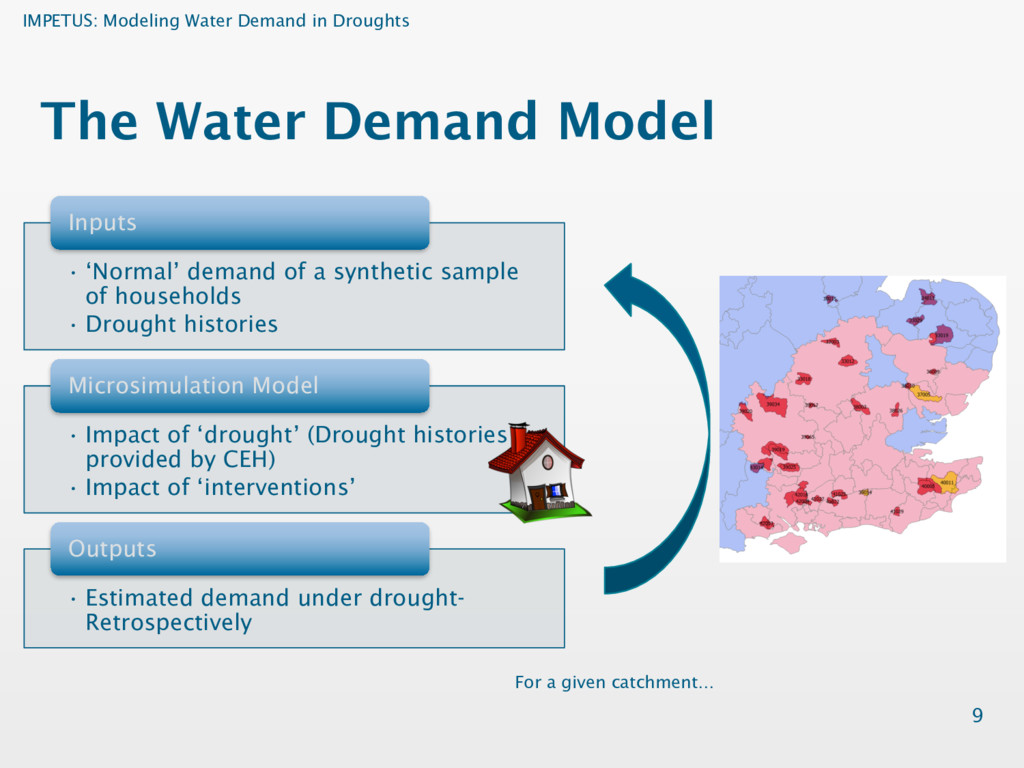
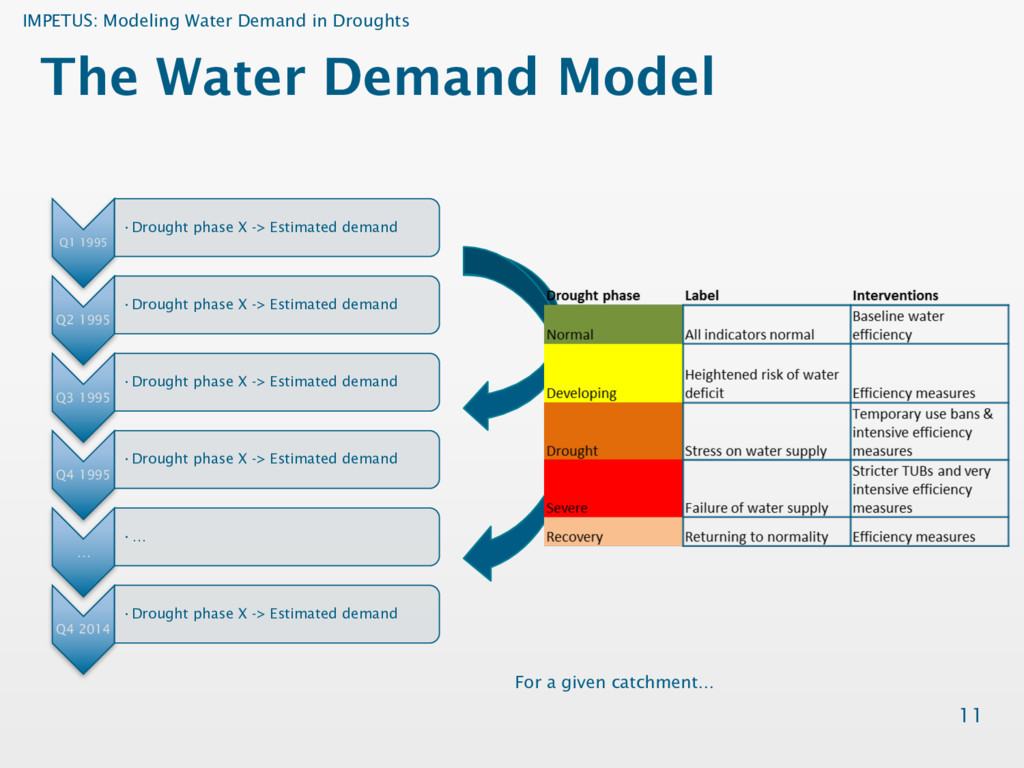
9 • ‘Normal’ demand of a synthetic sample of households • Drought histories Inputs • Impact of ‘drought’ (Drought histories provided by CEH) • Impact of ‘interventions’ Microsimulation Model • Estimated demand under drought- Retrospectively Outputs For a given catchment…
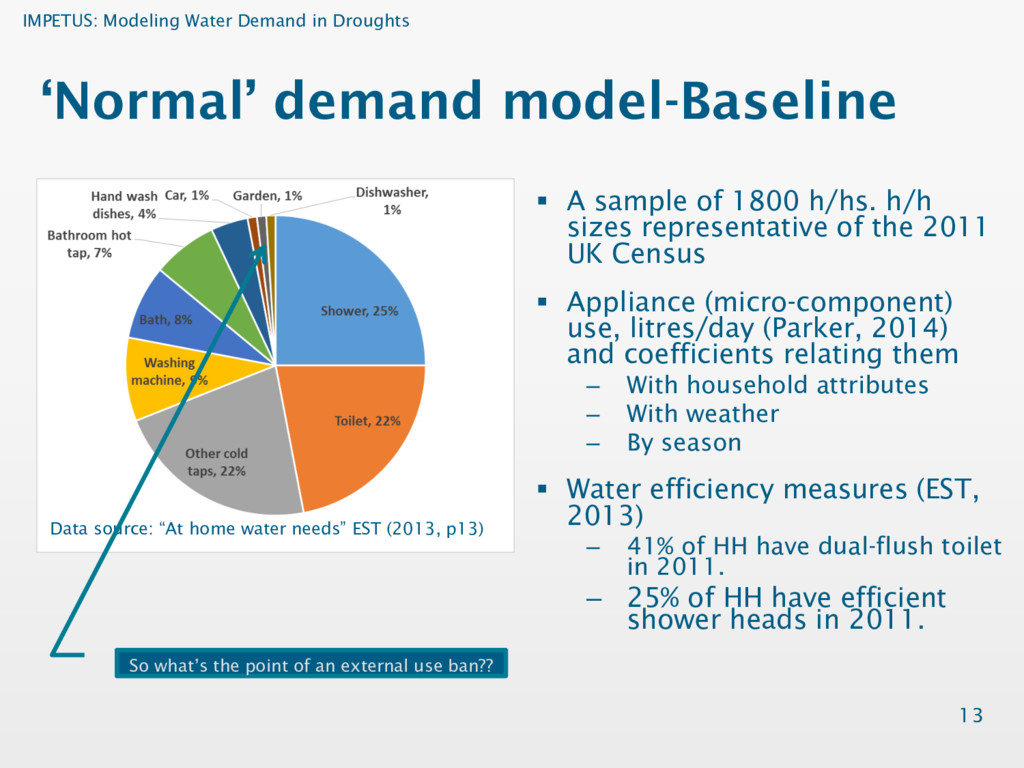
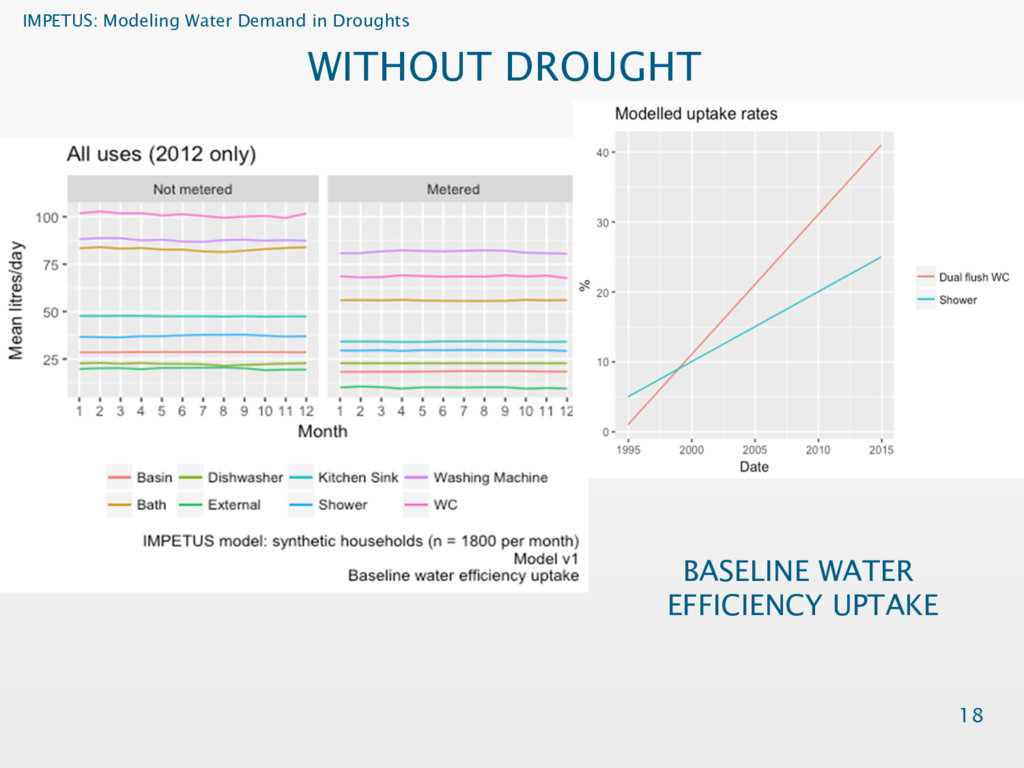
A sample of 1800 h/hs. h/h sizes representative of the 2011 UK Census § Appliance (micro-component) use, litres/day (Parker, 2014) and coefficients relating them – With household attributes – With weather – By season § Water efficiency measures (EST, 2013) – 41% of HH have dual-flush toilet in 2011. – 25% of HH have efficient shower heads in 2011. 13 Data source: “At home water needs” EST (2013, p13) So what’s the point of an external use ban??
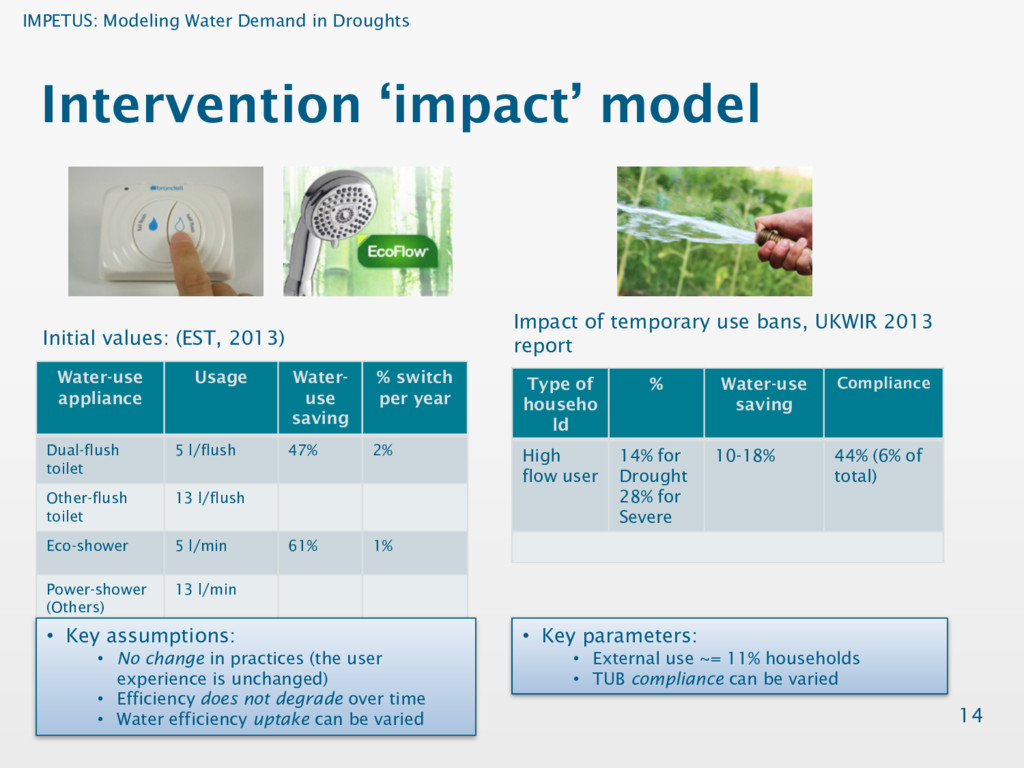
of temporary use bans, UKWIR 2013 report 14 Water-use appliance Usage Water- use saving % switch per year Dual-flush toilet 5 l/flush 47% 2% Other-flush toilet 13 l/flush Eco-shower 5 l/min 61% 1% Power-shower (Others) 13 l/min Initial values: (EST, 2013) • Key assumptions: • No change in practices (the user experience is unchanged) • Efficiency does not degrade over time • Water efficiency uptake can be varied • Key parameters: • External use ~= 11% households • TUB compliance can be varied Type of househo ld % Water-use saving Compliance High flow user 14% for Drought 28% for Severe 10-18% 44% (6% of total)
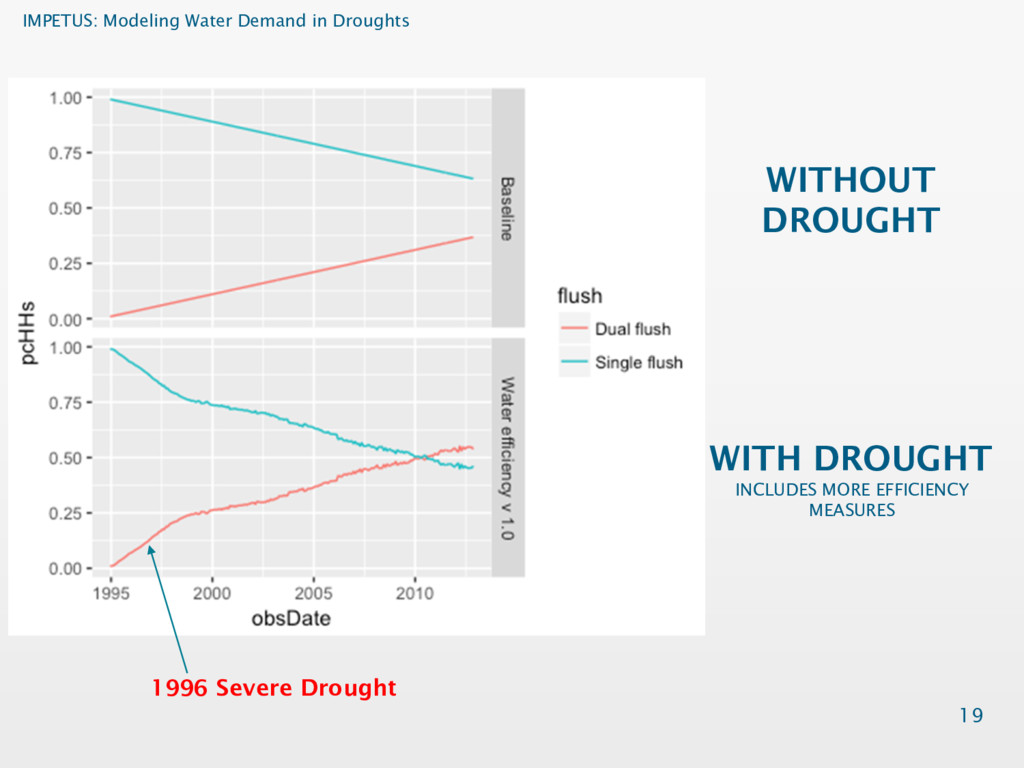
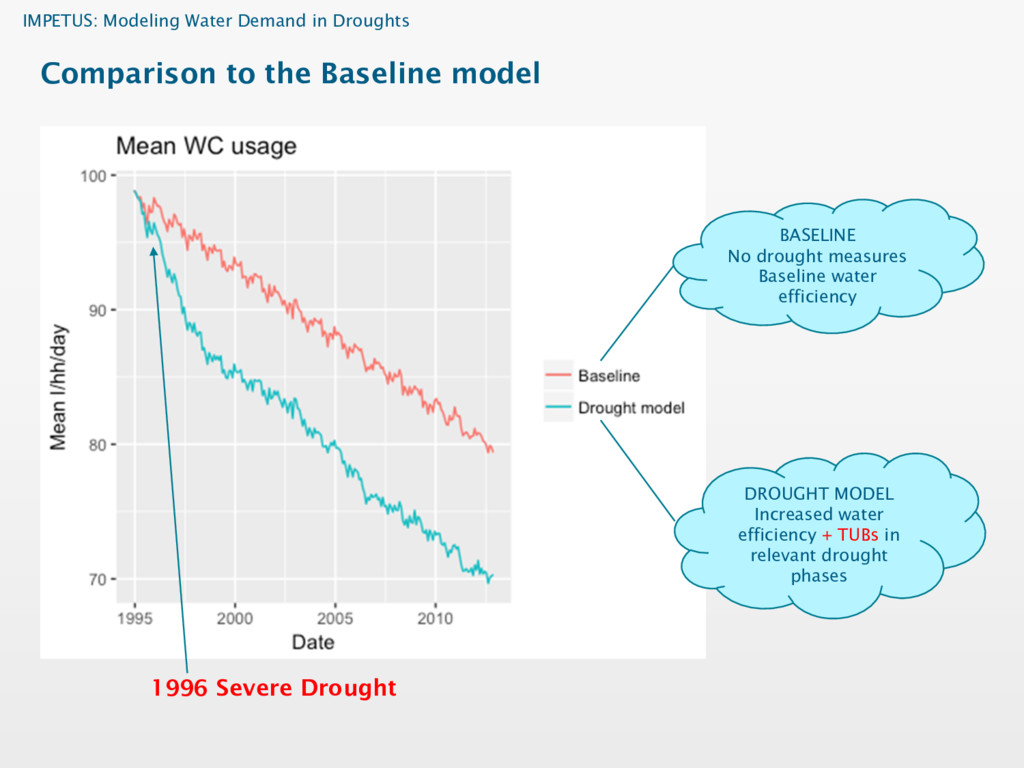
model 1996 Severe Drought BASELINE No drought measures Baseline water efficiency DROUGHT MODEL Increased water efficiency + TUBs in relevant drought phases
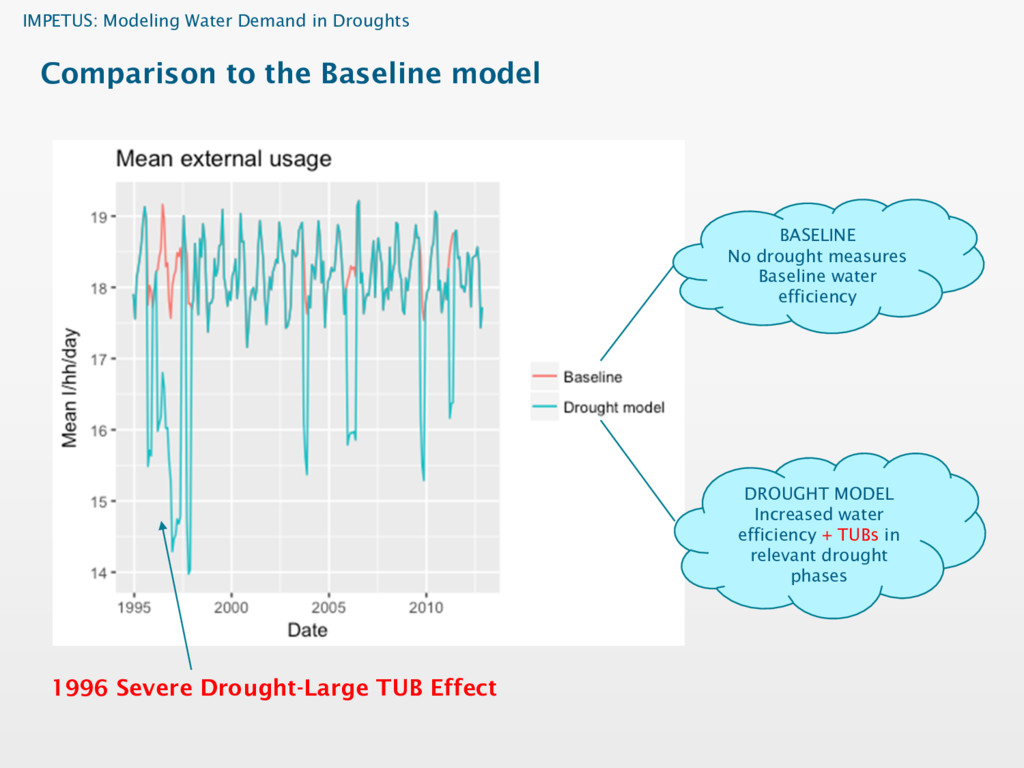
model 1996 Severe Drought-Large TUB Effect BASELINE No drought measures Baseline water efficiency DROUGHT MODEL Increased water efficiency + TUBs in relevant drought phases
![IMPETUS: Modeling Water Demand in Droughts Thank you! § [email protected]](https://files.speakerdeck.com/presentations/8f65b78636a1485583908cdd9c6d0710/slide_23.jpg)