Upgrade to Pro — share decks privately, control downloads, hide ads and more …

Rasmus Christiansen - Visualizing ecom data: M...

DataViz CPH
June 13, 2019
36

Rasmus Christiansen - Visualizing ecom data: Meet impact extend

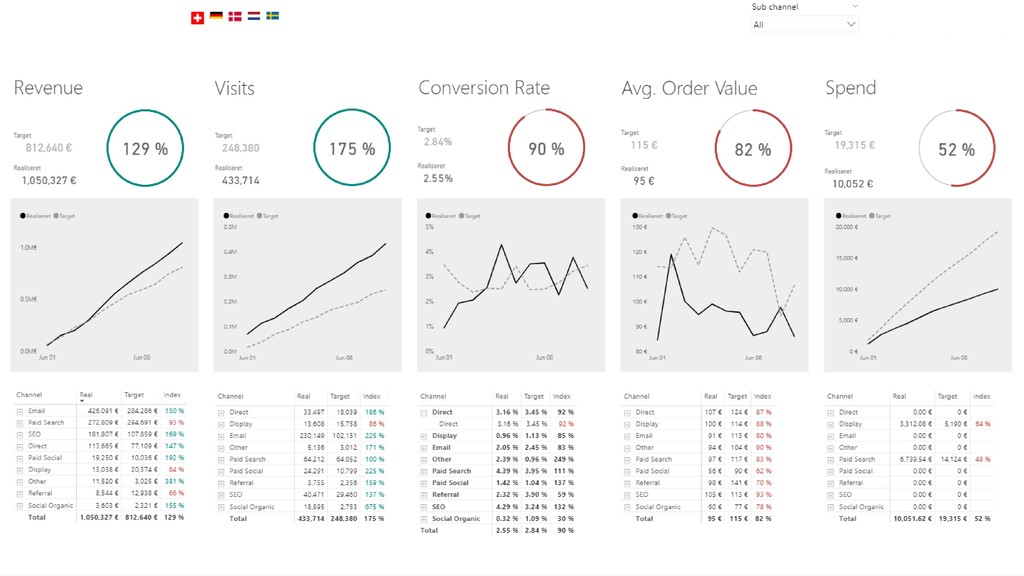
Rasmus will talk about “data cockpits” - dashboards combining various sources of data in one place, visualised in effective ways to allows marketing managers to make more informed, effective decisions towards reaching their goals

DataViz CPH

June 13, 2019
Tweet

Transcript

  1. ME Rasmus Bøgelund Christiansen From Denmark, Copenhagen Measure Camp London

    (R Course) Rome (Data visualization Course) IMPACT Extend A/S 2018 – Now | Implementation and Data Strategist IIH Nordic 2017 – 2018 | Analytics Specialist Asseco Denmark 2016 – 2017 | Sales And Marketing Representative IBM Denmark 2015 – 2016 | Project Manager for SME Team
  2. E C O M M E R C E S

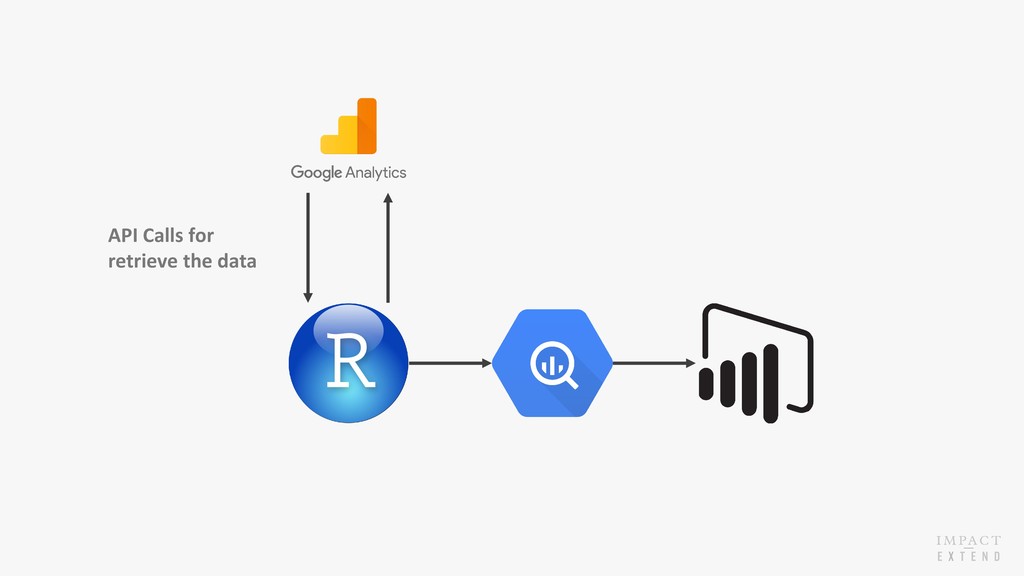
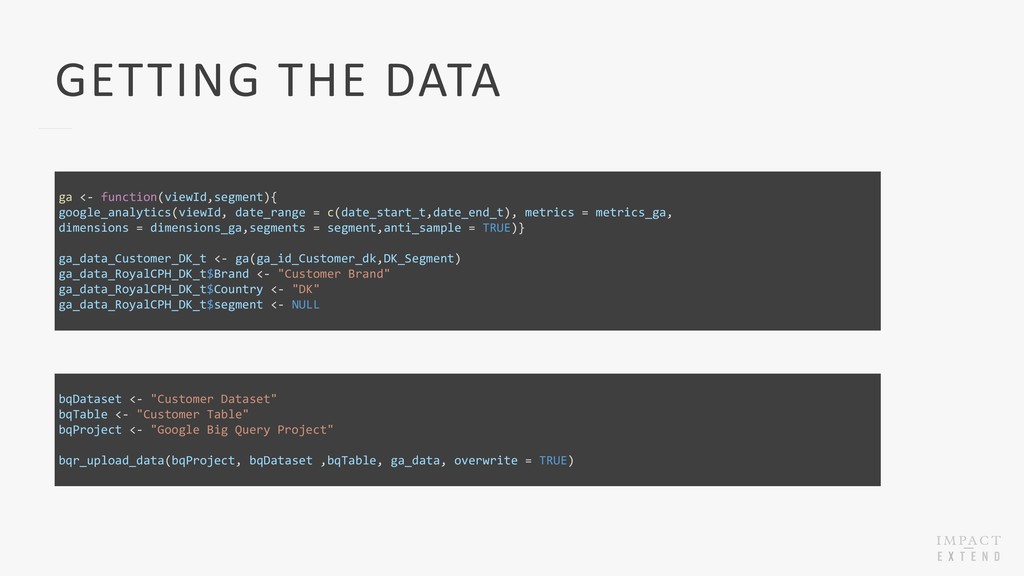
    H O P S IMPACT Extend is working with large brands to ensure revenue growth working across channels K N O W I N G T H E I R K P I S When working with eCommerce and the CMO there are normally clear KPI on which we can report C O L L E C T D ATA Using R we can fairly easy get data from Google Analytics and push it to a database from which we can connect V I S U A L I Z E Using PowerBI the customer data is visualized, updated daily, and maintained. AGENDA
  3. PROCESS FOR TRACKING IMPLEMENTATION Scoping and development of datalayer Setting

    up Google Tag Manager Setting up Google Analytics Testing and validating setup Moving and publishing new setup
  4. PRODUCT LIST CLICKS Måler kliks på produktlister (inklusiv Raptor karusseller)

    dataLayer.push({ 'event': 'productClick', 'ecommerce': { 'currencyCode': 'DKK', 'click': { 'products': [{ 'id': '63495710', 'name': 'Arbejdsbuks Erlangen', 'price': '59.75', 'brand': 'MASCOT', 'category': 'Underdele', 'position': 0, 'list': 'Underdele' }] } } });
  5. GETTING THE DATA ga <- function(viewId,segment){ google_analytics(viewId, date_range = c(date_start_t,date_end_t),

    metrics = metrics_ga, dimensions = dimensions_ga,segments = segment,anti_sample = TRUE)} ga_data_Customer_DK_t <- ga(ga_id_Customer_dk,DK_Segment) ga_data_RoyalCPH_DK_t$Brand <- "Customer Brand" ga_data_RoyalCPH_DK_t$Country <- "DK" ga_data_RoyalCPH_DK_t$segment <- NULL bqDataset <- "Customer Dataset" bqTable <- "Customer Table" bqProject <- "Google Big Query Project" bqr_upload_data(bqProject, bqDataset ,bqTable, ga_data, overwrite = TRUE)