Upgrade to Pro — share decks privately, control downloads, hide ads and more …

Data Visualisation & Data Management - Experiences & Lessons

Data Visualisation & Data Management - Experiences & Lessons

Edited version of a presentation given to the BuSK (Building Shared Knowledge) project partners at NUI Galway, May, 2017.

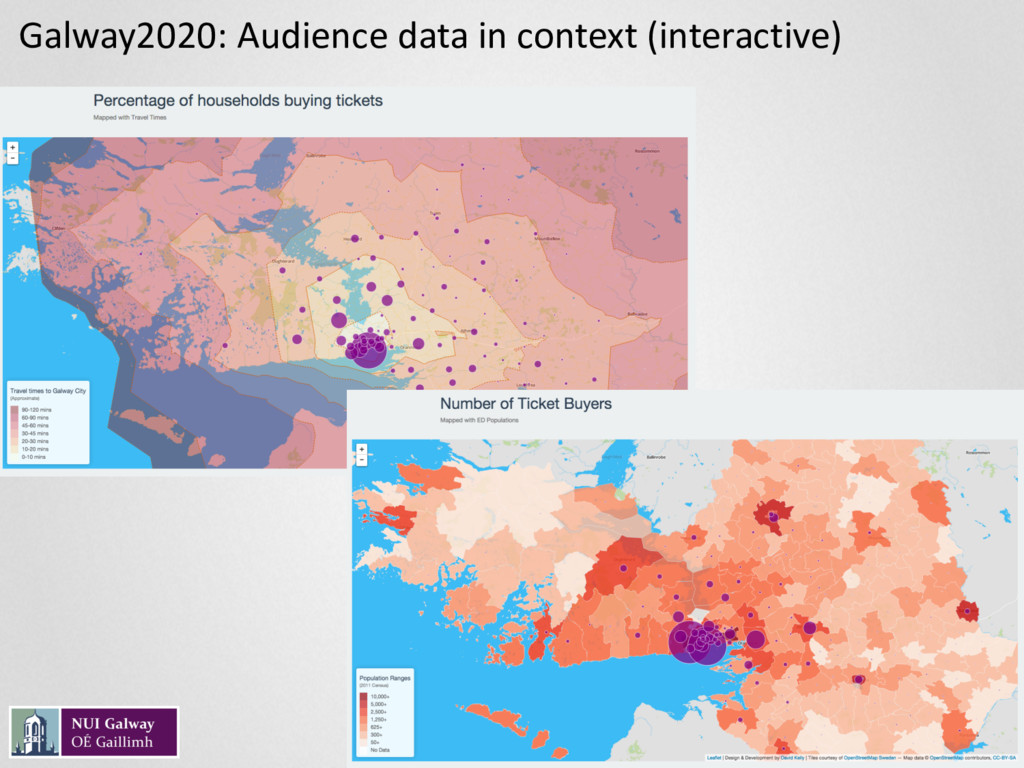
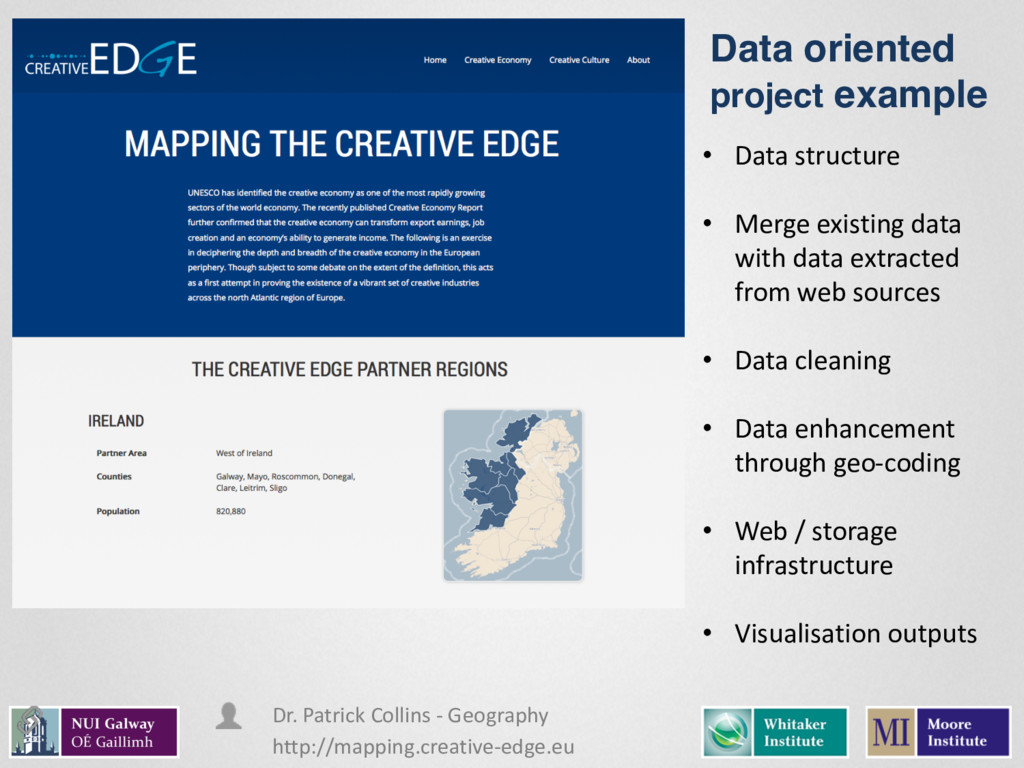
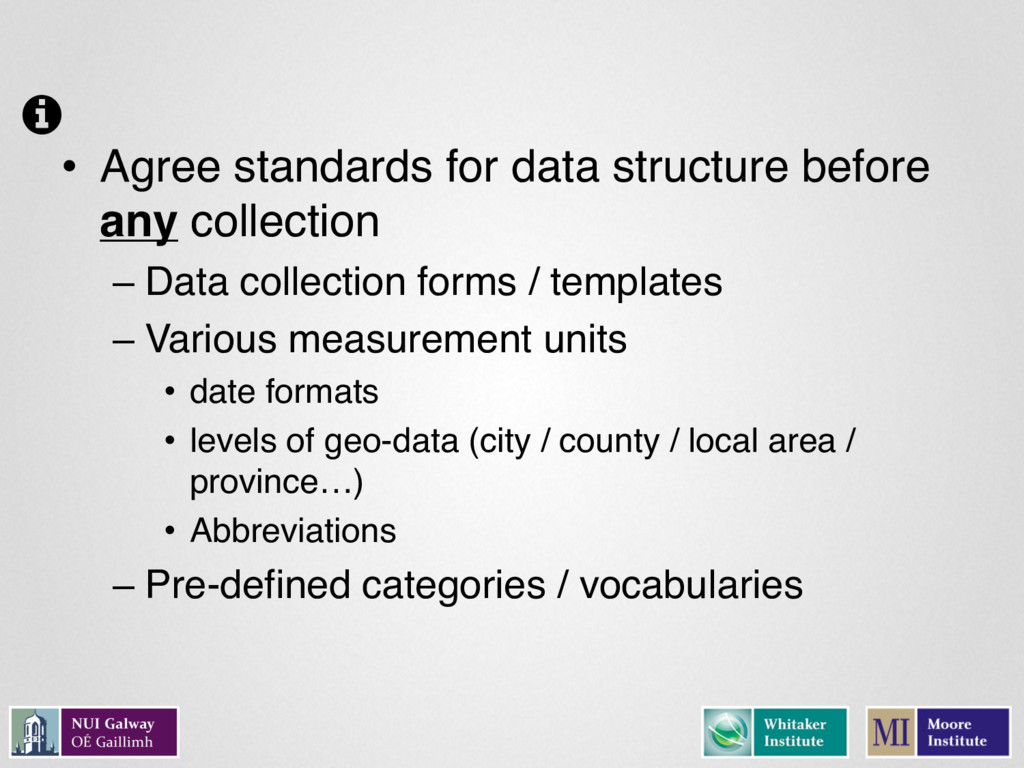
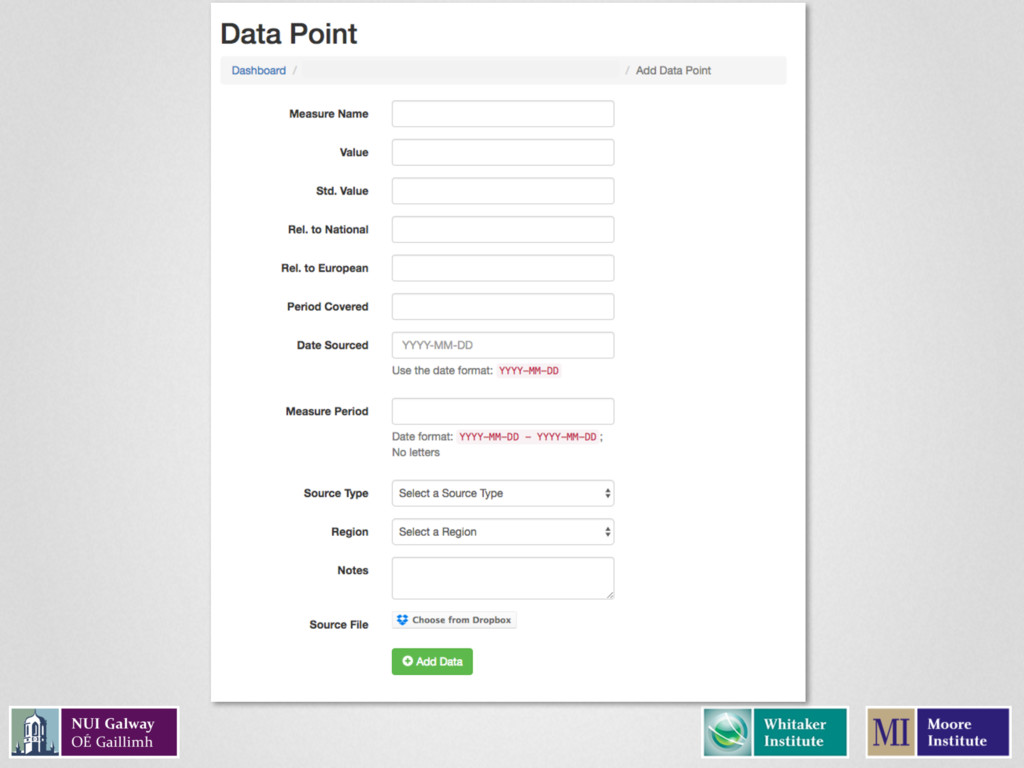
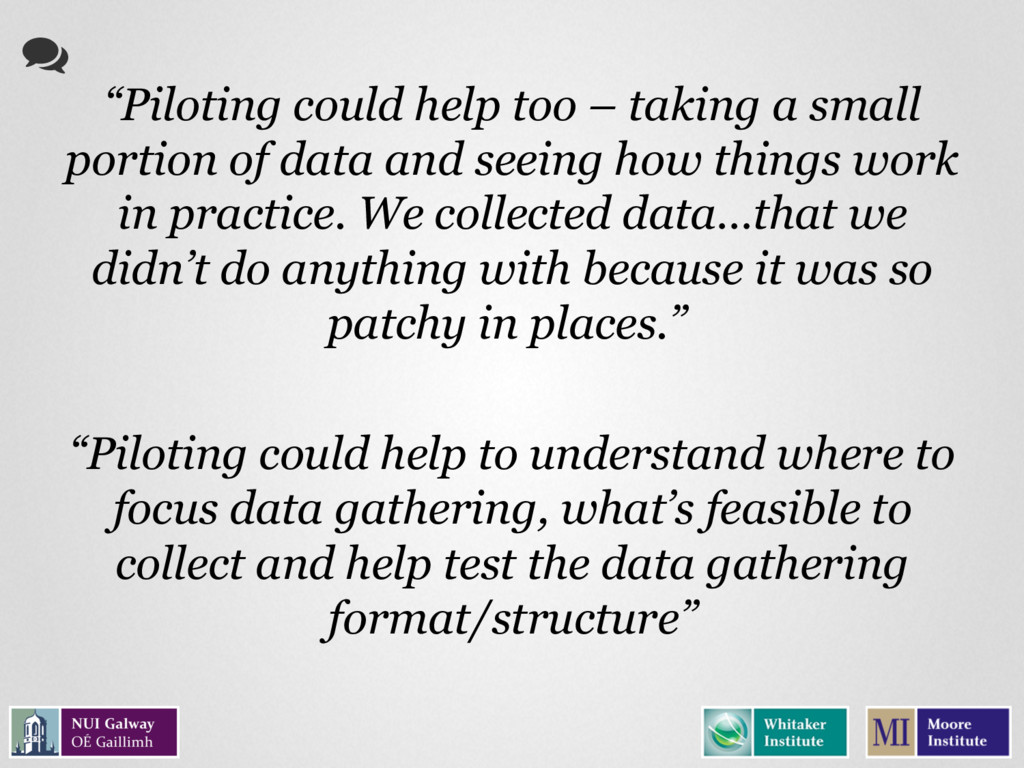
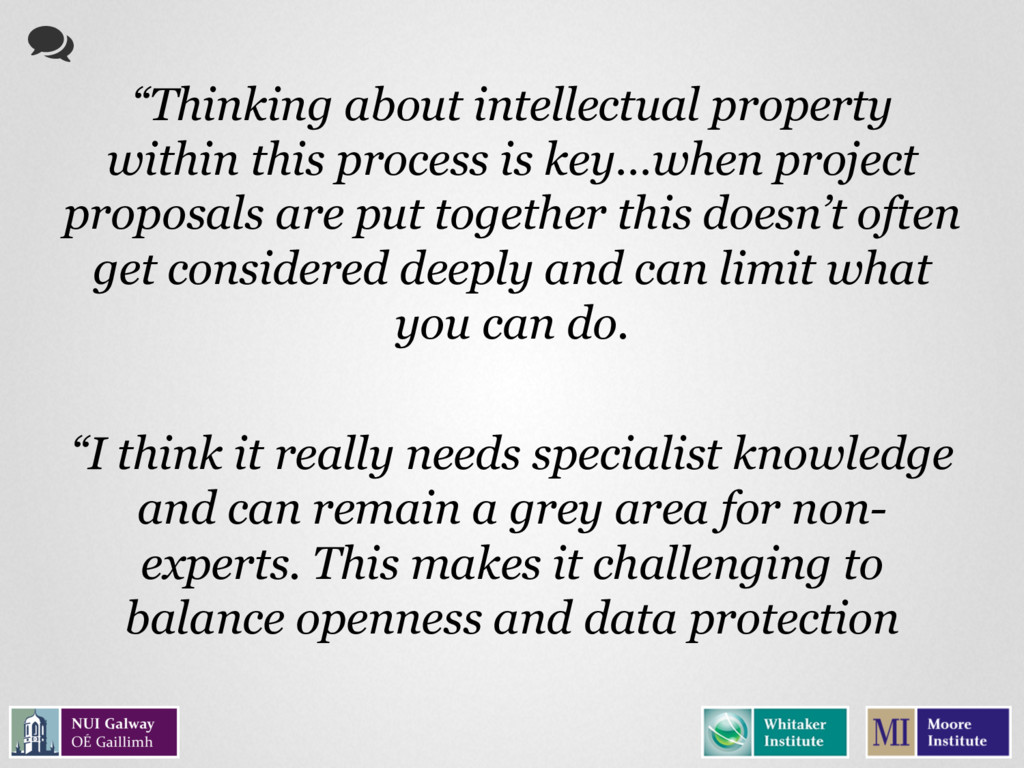
The presentation outlines, with examples, experiences and lessons learned in the development of research projects from the social sciences that focus on data collection, management and visualisation.

Dave Kelly

May 24, 2017
Tweet

More Decks by Dave Kelly

Other Decks in Education

Transcript

  1. Overview • Data Visualisation – Selected examples from Whitaker Institute

    projects • Data collection & management – Experiences & Lessons
  2. GalwayDashboard.ie Includes data from: CSO Galway City Council Galway County

    Council Enterprise Ireland IDA Údarás WDC PRTB EPA Póbal Economic Baseline Assessment for Galway City & County Prof. James Cunningham, Galway City Council, Galway County Council
  3. Cultural Networks Data from interviews with cultural practitioners: • Demographic

    • Funding • Relationship types • Geographic data Dr. Patrick Collins - Geography
  4. • Data structure • Merge existing data with data extracted

    from web sources • Data cleaning • Data enhancement through geo-coding • Web / storage infrastructure • Visualisation outputs http://mapping.creative-edge.eu Dr. Patrick Collins - Geography Data oriented project example
  5. “Crucially, plan ahead and get technical input early on. Raise

    awareness among partners of the importance of planning and structure so there’s a will to cooperate” !
  6. Talk to developers / designers as early as possible –

    preferably prior to data collection "
  7. “Because we collected the data in Excel it…left quite a

    bit of room for inconsistences in structure across the data collected” !
  8. • Agree standards for data structure before any collection –

    Data collection forms / templates – Various measurement units • date formats • levels of geo-data (city / county / local area / province…) • Abbreviations – Pre-defined categories / vocabularies "
  9. “Piloting could help too – taking a small portion of

    data and seeing how things work in practice. We collected data…that we didn’t do anything with because it was so patchy in places.” “Piloting could help to understand where to focus data gathering, what’s feasible to collect and help test the data gathering format/structure” !
  10. • Pilot collection of same data in more than one

    region – Identify potential inconsistencies early • Experiment with output formats for different stakeholders – User test with stakeholders "
  11. “Having a structure around data collection linked to outputs and

    visualisation is key.” “The exact nature of the desired end-product might not be clear from the start. The structure could need to be re-visited at different stages of development.” “If this kind of process was built in it could also help to establish a clearer idea about the end output and how to achieve it” !
  12. • Think about outputs for different audiences – Presentation format

    – static / interactive, narrative, video, animation, raw data. (Or mixed?) – Formats for open data; are visual outputs downloadable / shareable? – Meta-data associated with various outputs (original sources, years, etc) • Work forward from research plan and backwards from desired outputs – Will you have the data you need, in the format you need, to produce the outputs you want? "
  13. Display the high-level overview Allow user to explore based on

    their interests http://mapping.creative-edge.eu/business
  14. “Thinking about intellectual property within this process is key…when project

    proposals are put together this doesn’t often get considered deeply and can limit what you can do. “I think it really needs specialist knowledge and can remain a grey area for non- experts. This makes it challenging to balance openness and data protection !
  15. • Engage with subject matter specialist early in the planning

    process • Consider data sources being used, and the impact they may have later in the project "
  16. • Plan beyond the life of the project – How

    (or is) the data updated? – Plans for data preservation? – Plans for infrastructure maintenance? "