Upgrade to Pro — share decks privately, control downloads, hide ads and more …

Web Maps and Data Visualisation

Web Maps and Data Visualisation

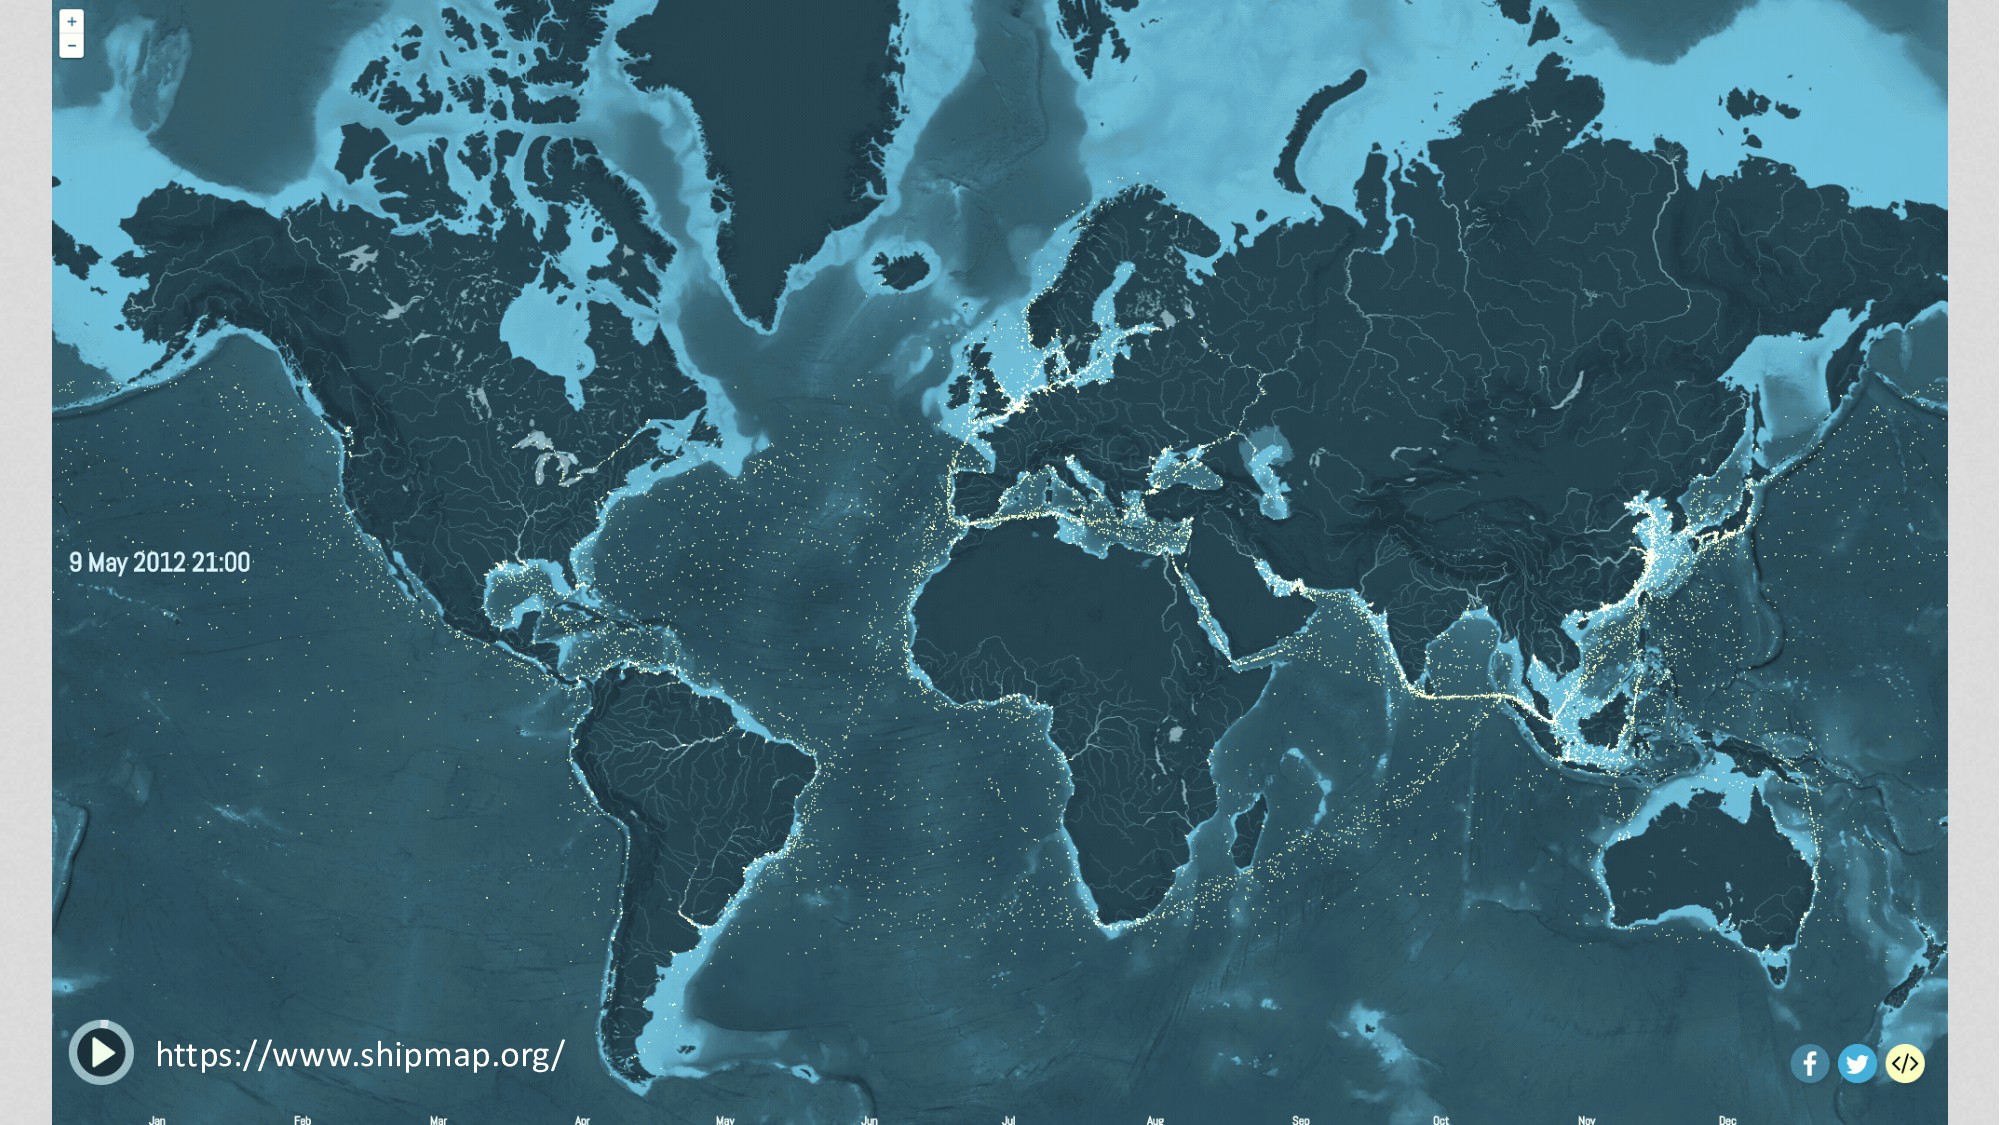
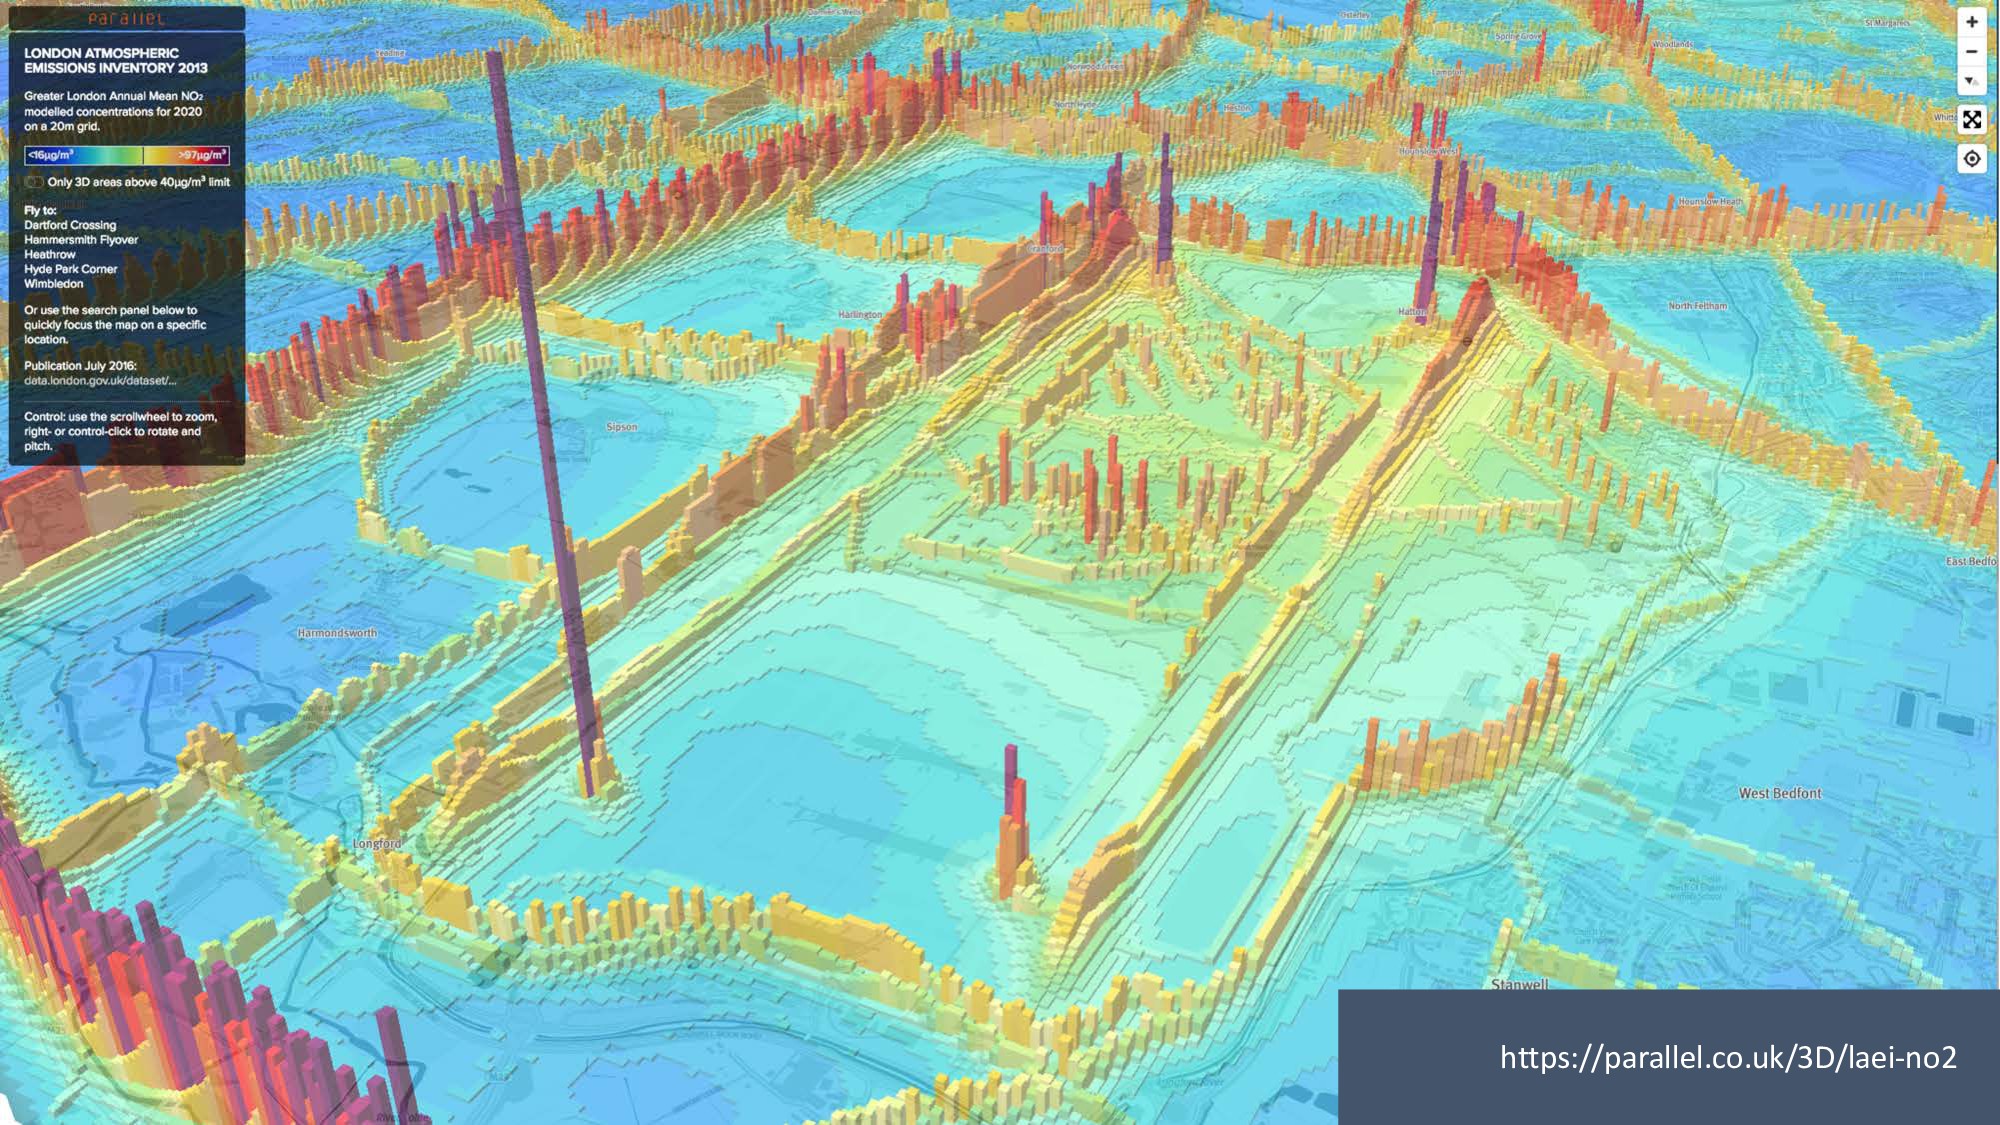
This session will introduce some key aspects of visualising your research data using web-based maps.

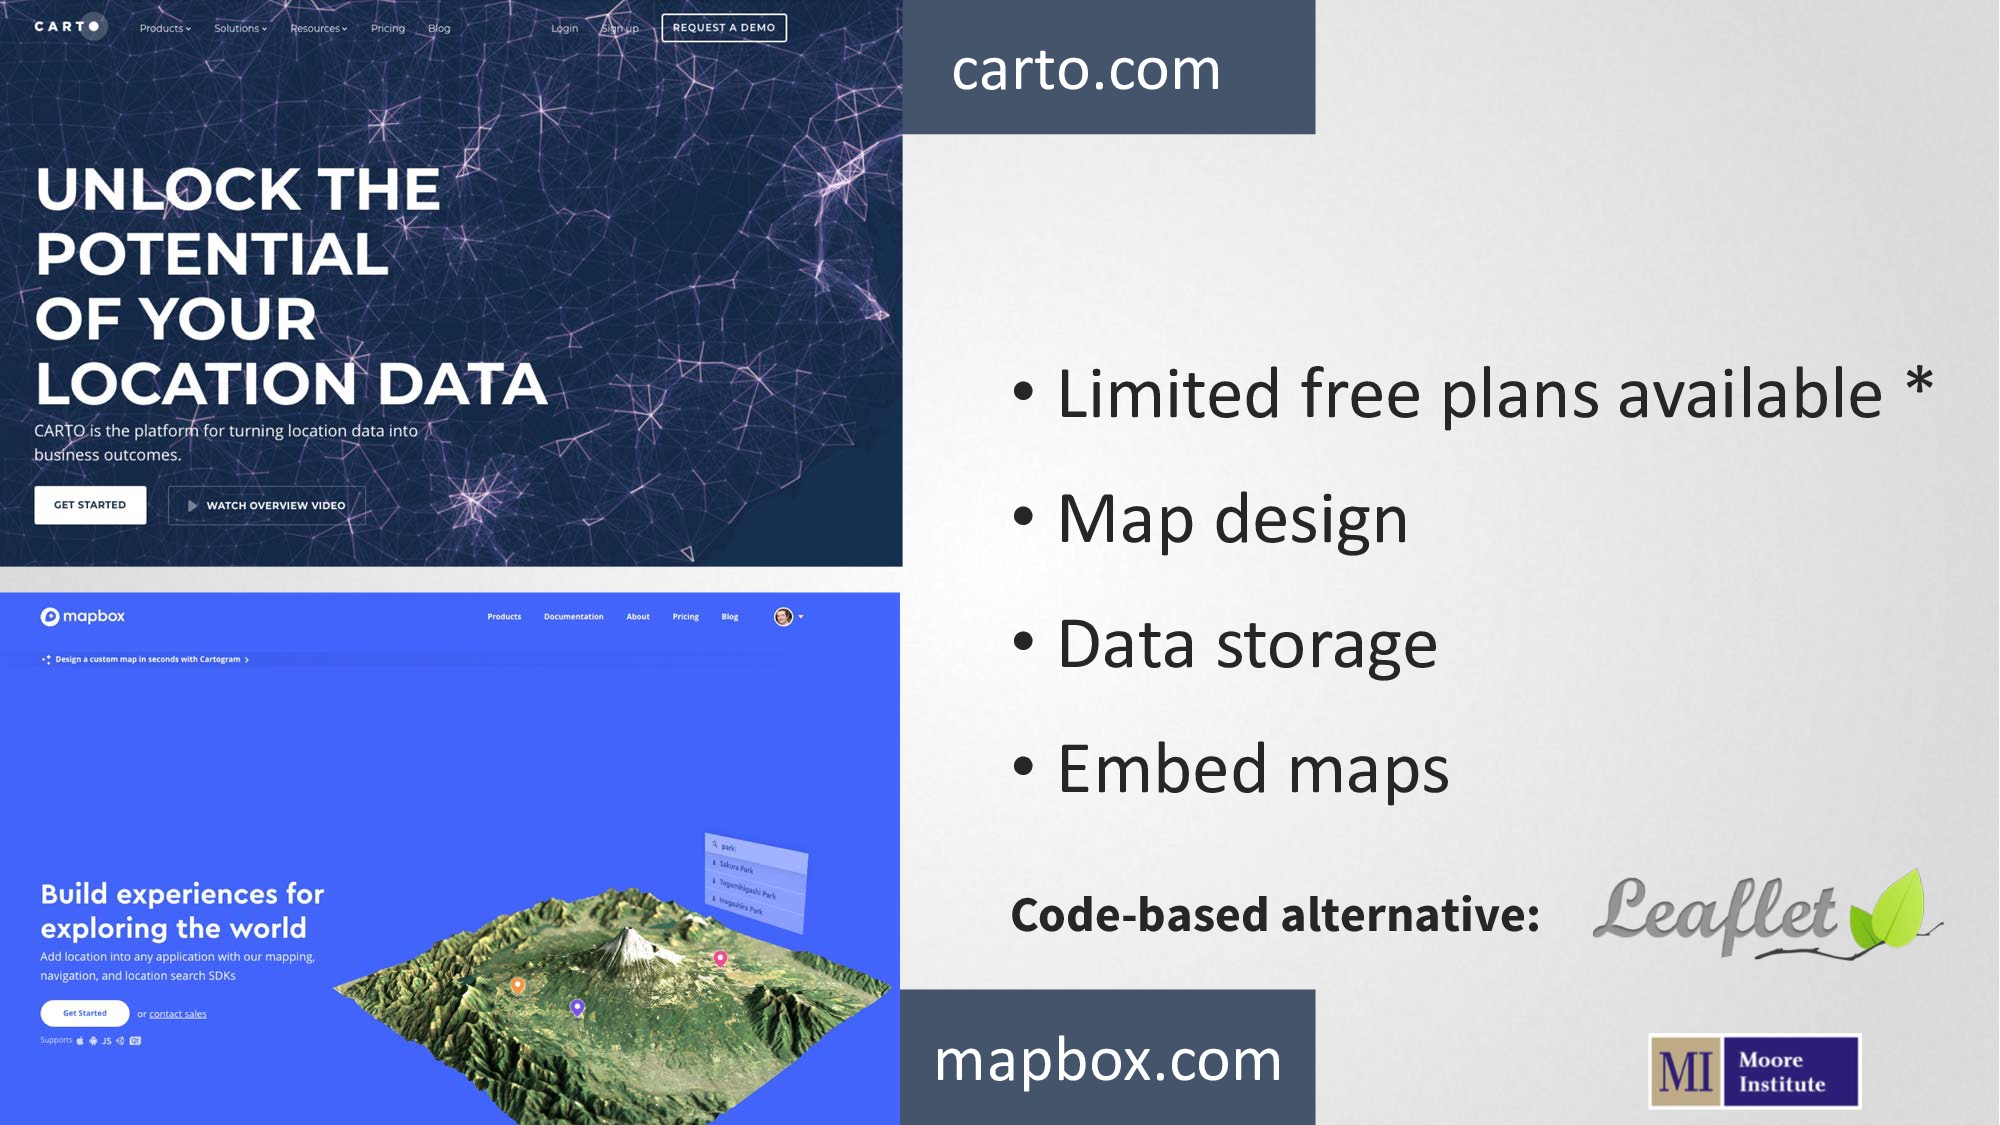
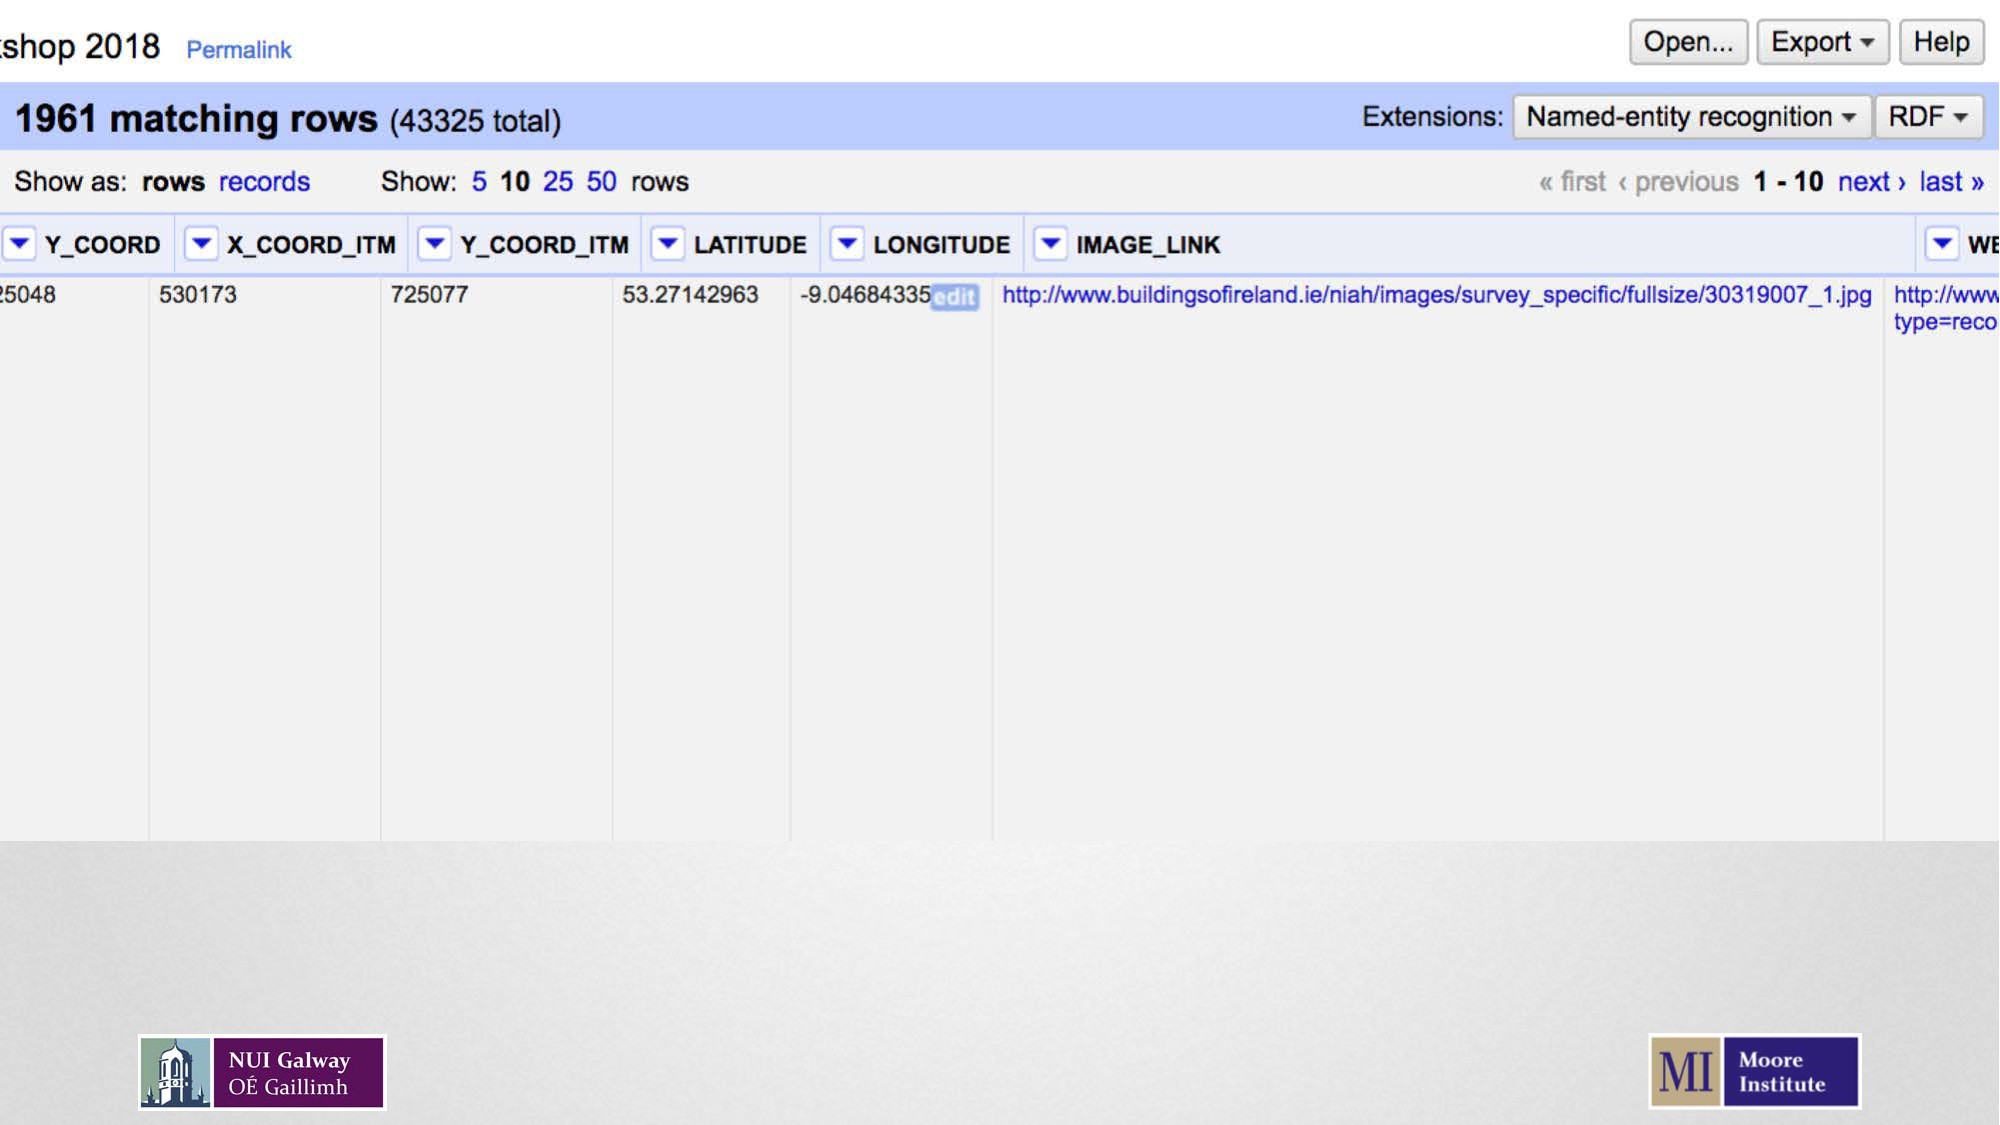
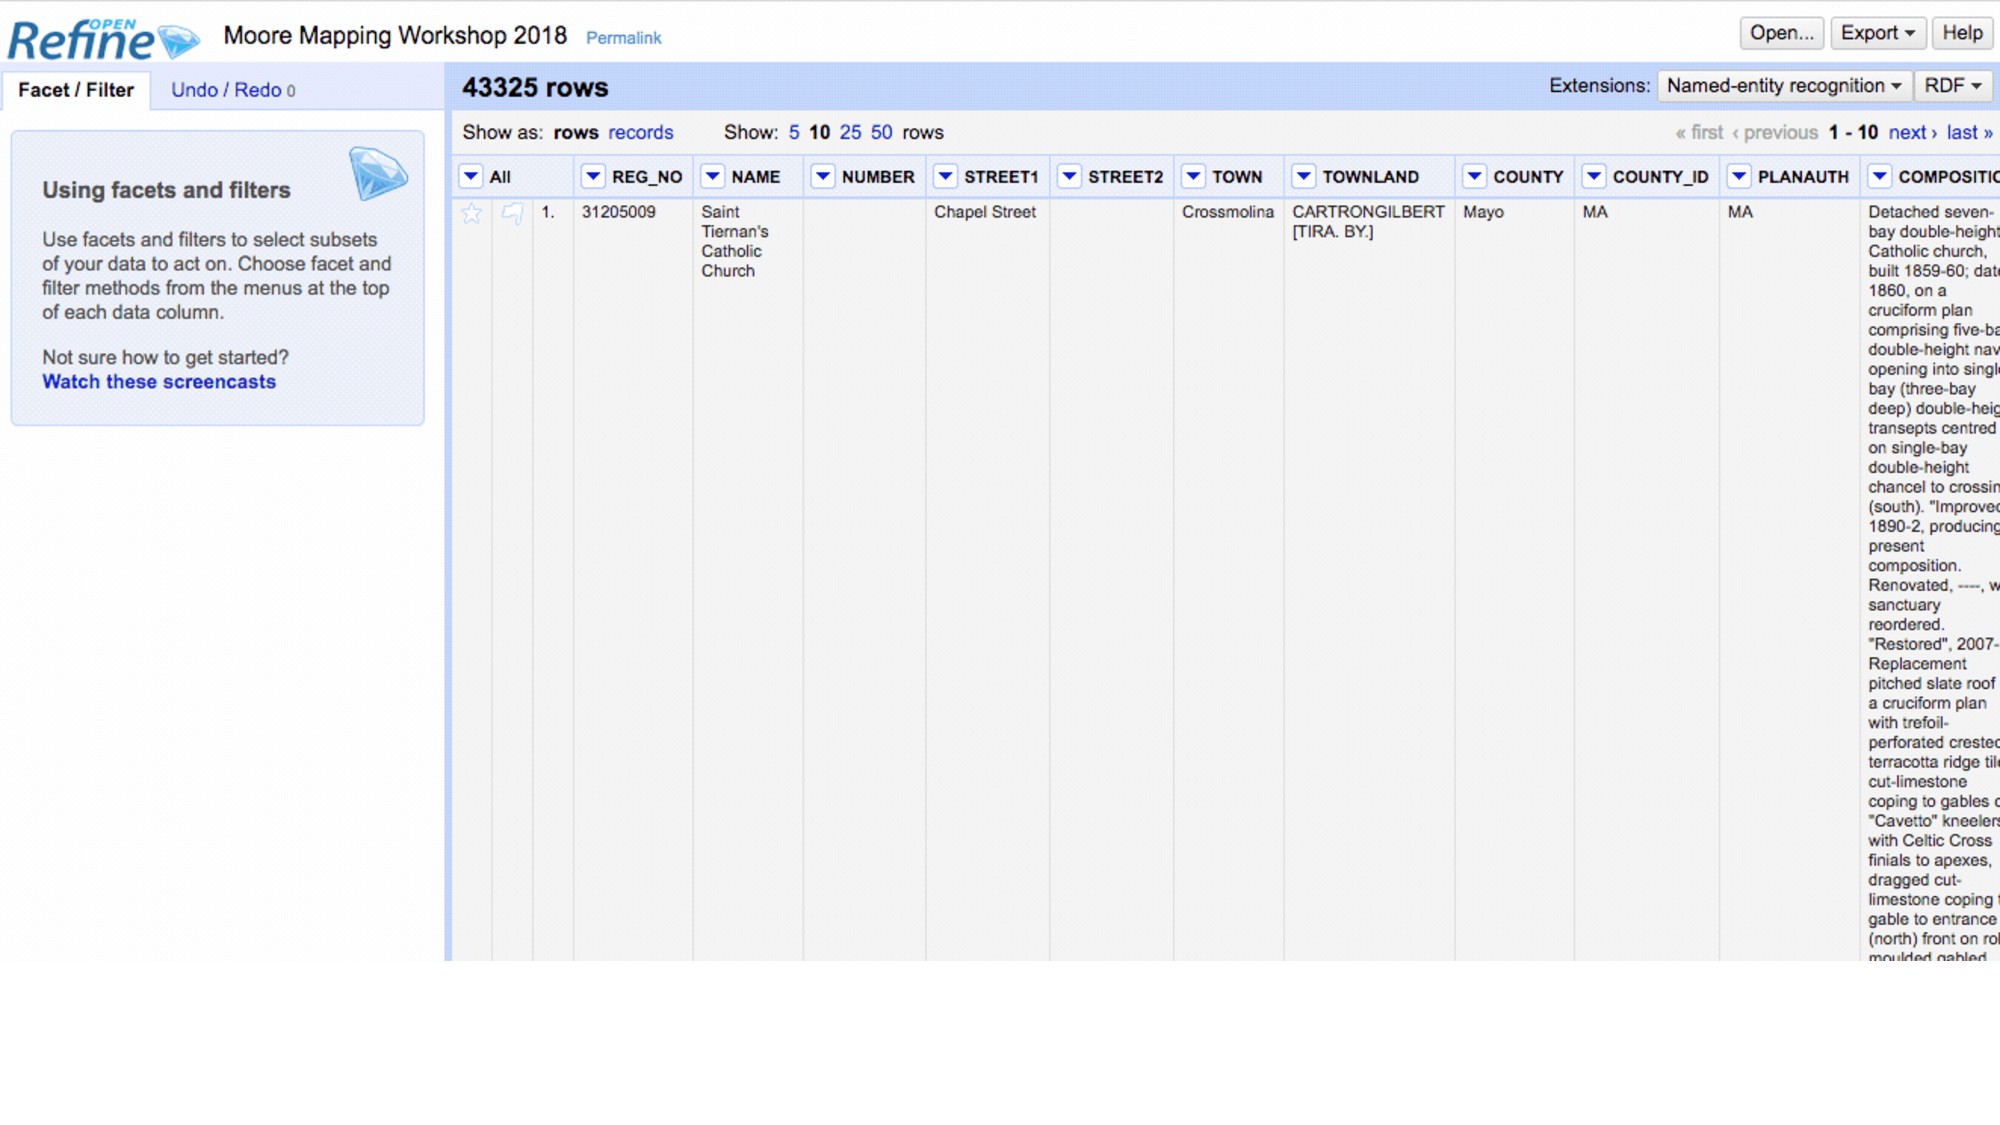
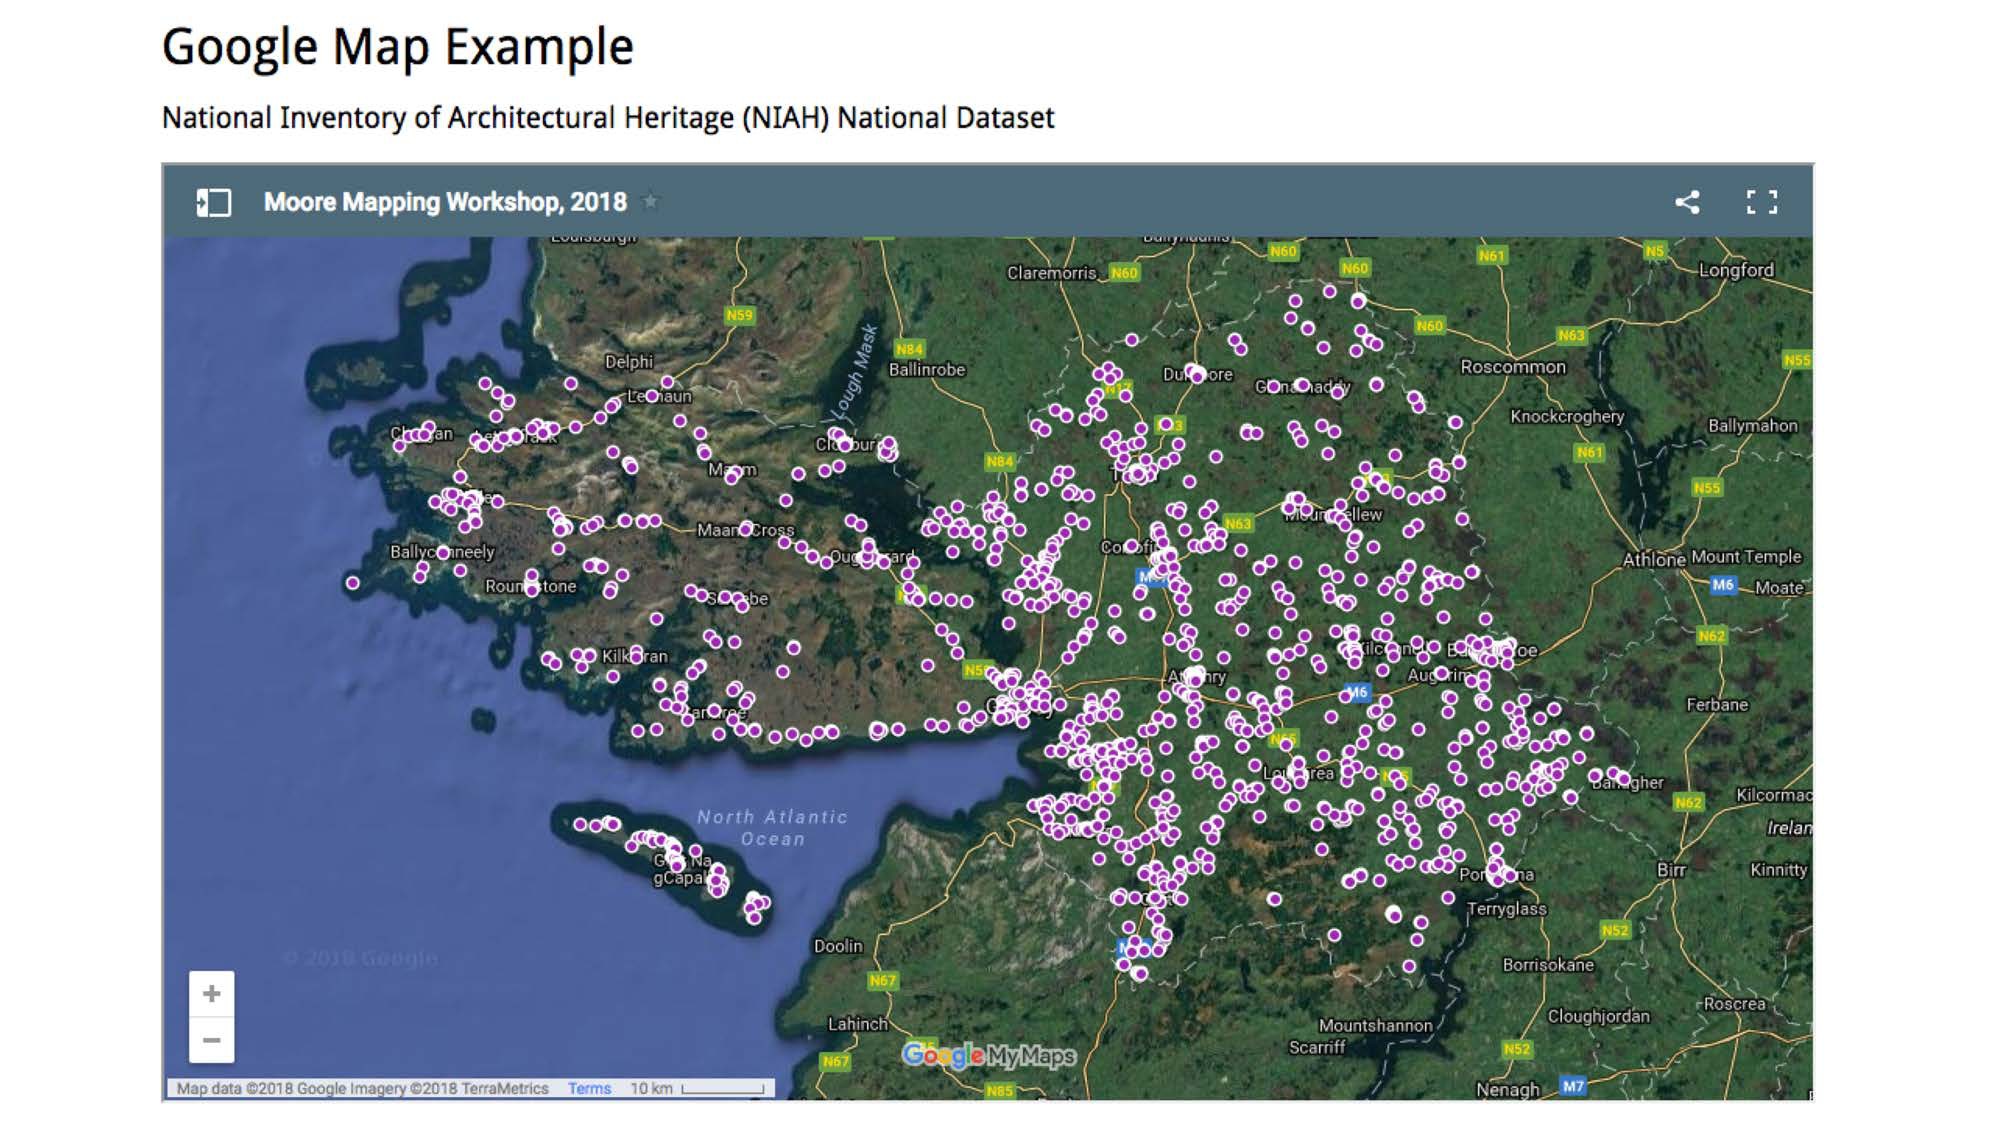
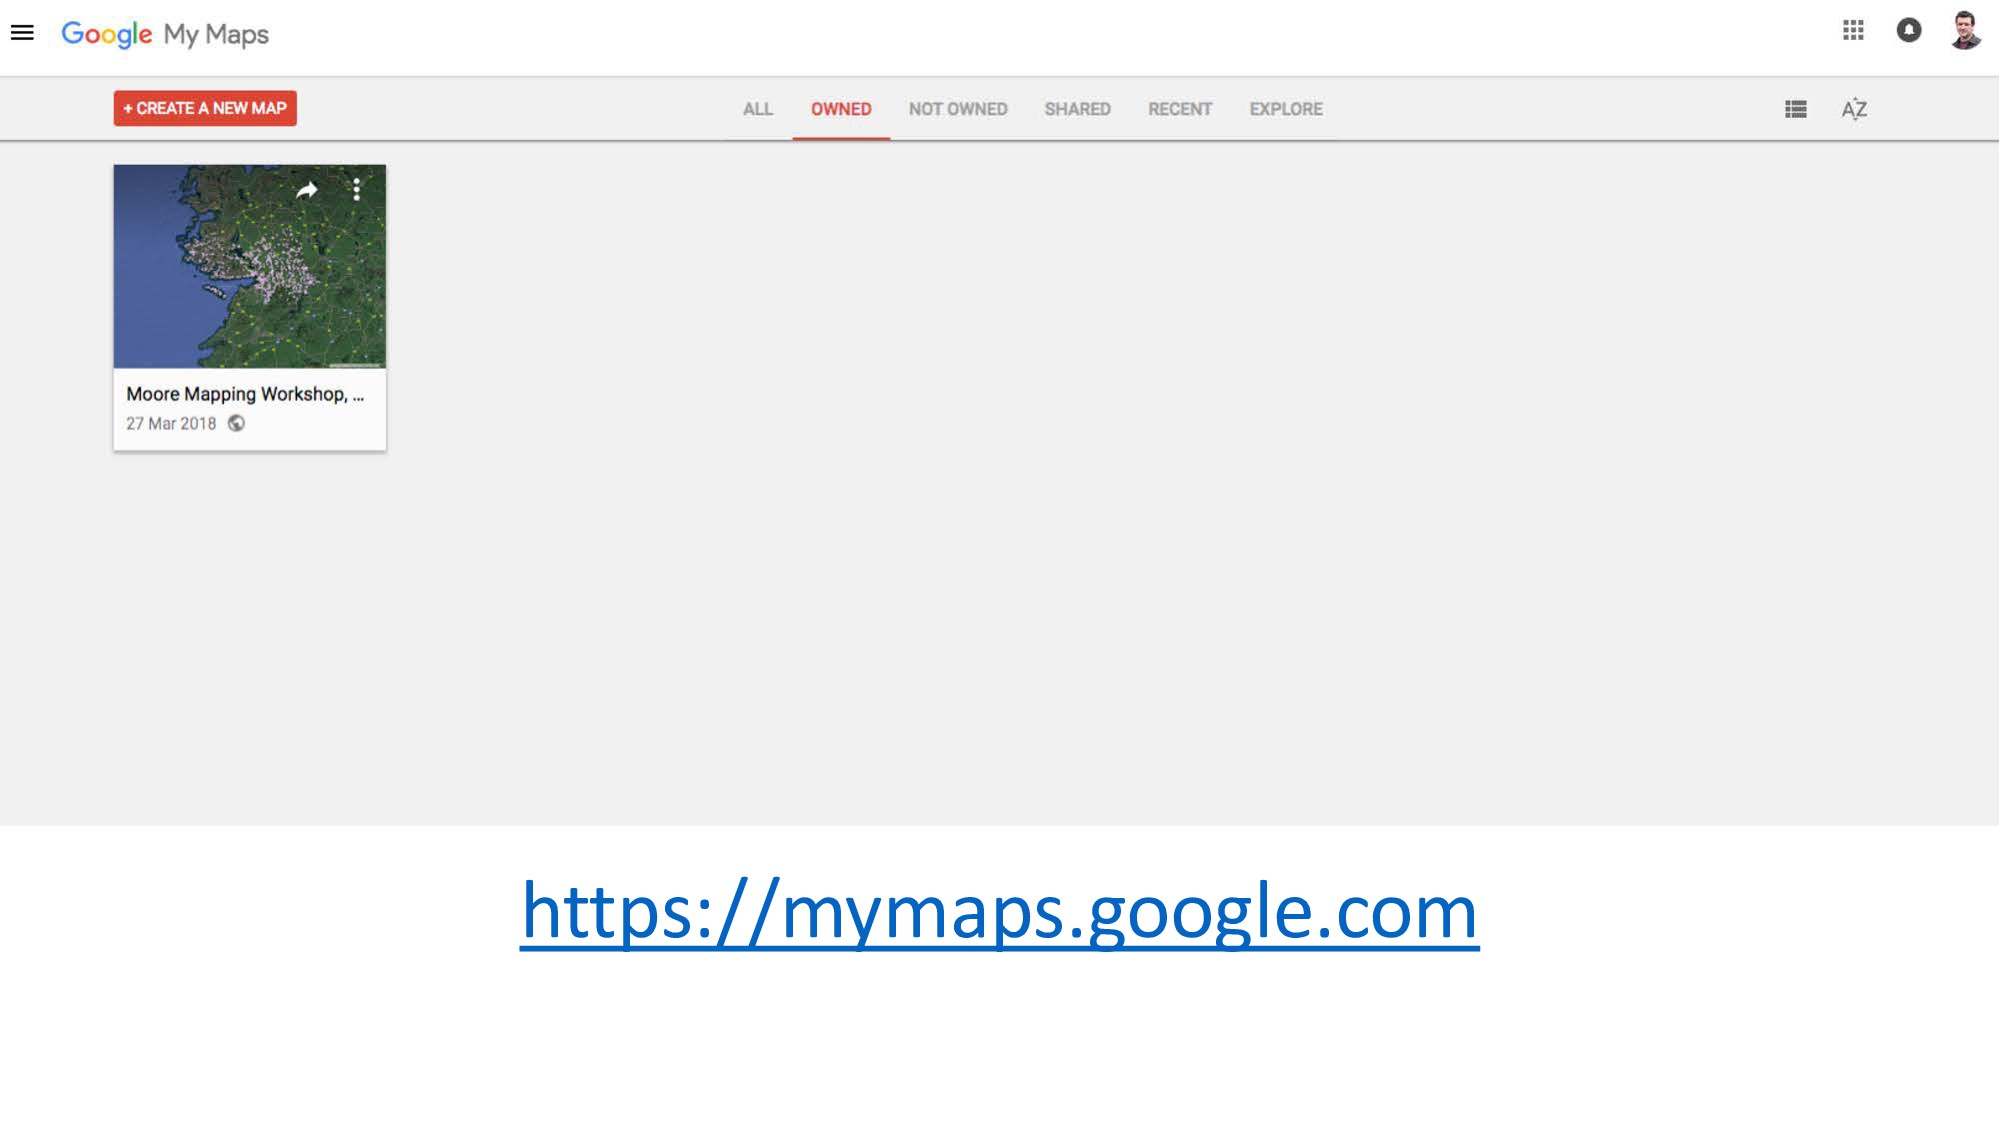
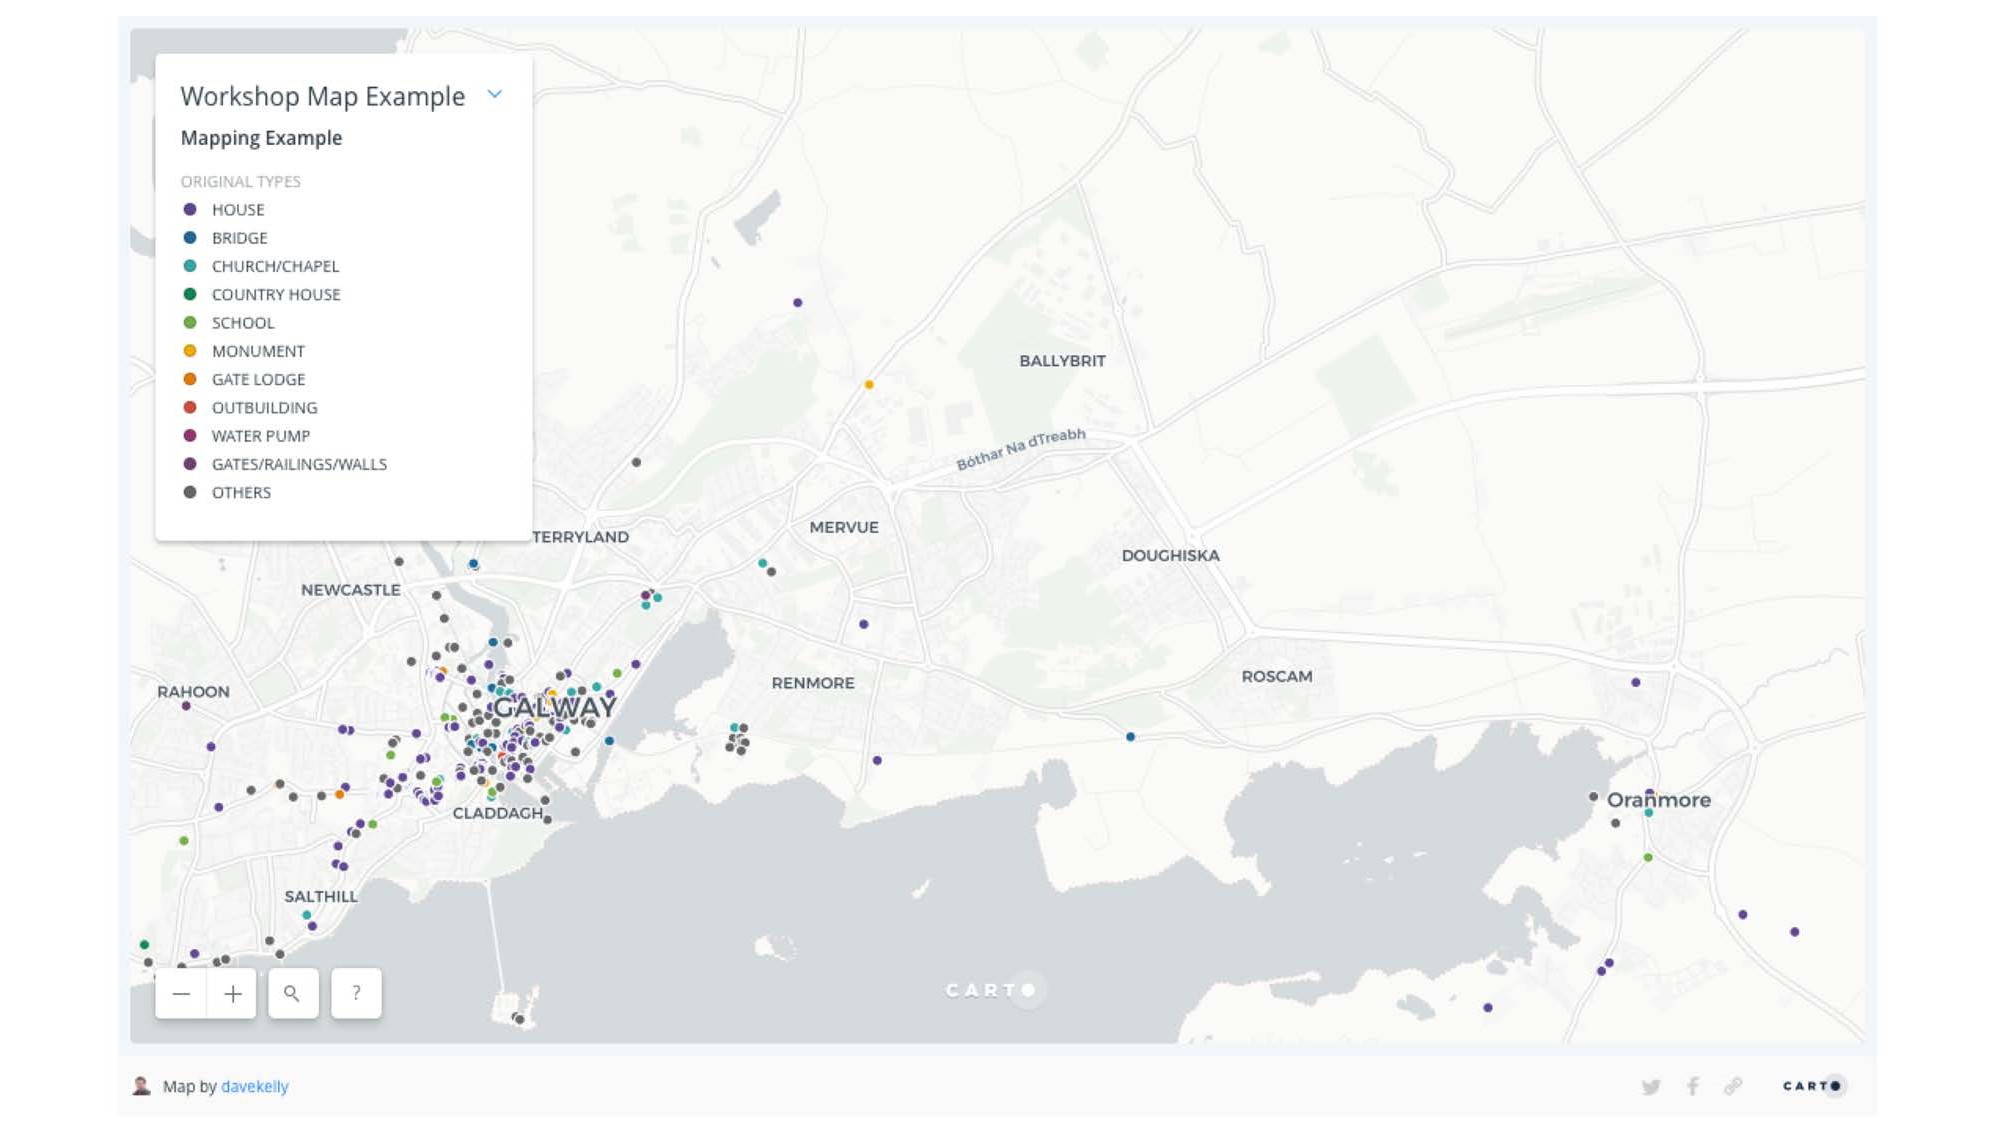
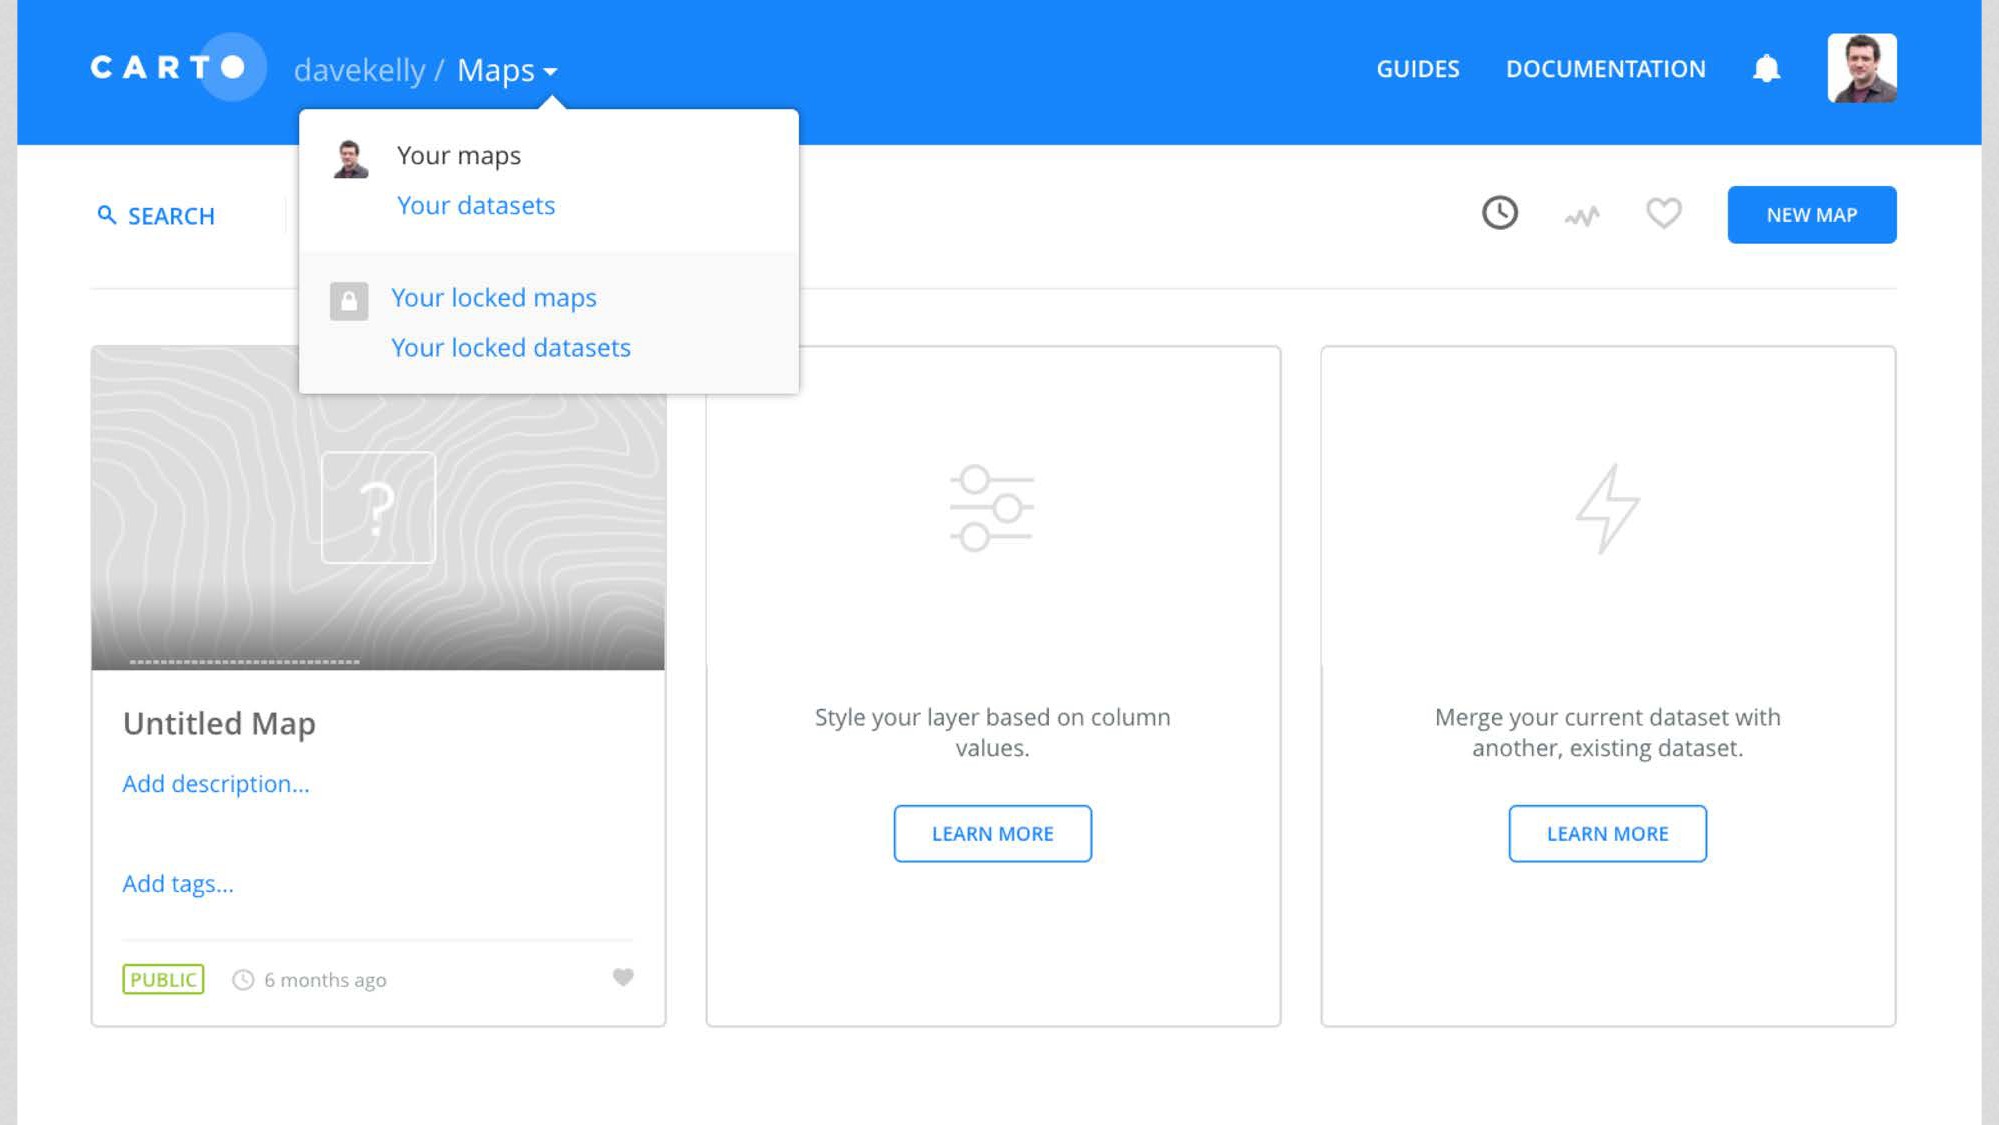
Participants will have the opportunity to get hands-on and follow along with a demonstration of how to create your own simple web-based maps, using Google Maps and Carto.

Presented at NUI Galway as part of a series of informal workshops to share practice-based expertise, know-how and experience in technologies and methods germane to anyone engaged in Digital Scholarship type activity.

Dave Kelly

March 29, 2018
Tweet

More Decks by Dave Kelly

Other Decks in Education

Transcript

  1. Web Maps & Data Visualisation David Kelly Digital Humanities Manager,

    Moore Institute @ NUI, Galway 29 March, 2018 | Digital Scholarship Workshop Series
  2. • Limited free plans available * Code-based alternative: • Map

    design • Data storage • Embed maps carto.com mapbox.com
  3. - A kind of digital map, but… - Not GIS

    applications (Geographic Information System) - Not Google Earth-style - Not print maps - Published online - embedded - Uses Tiles - 256 x 256 pixels - A ”Slippy” map http://a.tile.openstreetmap.se/hydda/full/15/15559/10631.png
  4. Web maps - Zoom levels ( => number of tiles

    increases exponentially) http://maptime.io/anatomy-of-a-web-map https://wiki.openstreetmap.org/wiki/Zoom_levels
  5. Projections - Google Maps uses Mercator Projection - Works well

    for 2D maps * http://maptime.io/anatomy-of-a-web-map
  6. Data Layers - Feature (content) layers on top - Vectors

    – points / lines / polygons - Latitude / longitude [53.27392, -9.05102] - Data used in interaction - Data can be stored as GeoJSON, Shapefiles, TopoJSON, KML, CSV - We’ll use some CSV data
  7. We want to… - Get (and prepare) data - Create

    a new map and upload our data to it - Customise map markers / interaction - Change the base map - Get an embed code to publish the map on our website
  8. • REG_NO • NAME * • NUMBER • STREET1 •

    STREET2 • TOWN • TOWNLAND • COUNTY • COUNTY_ID • PLANAUTH • COMPOSITION * • APPRAISAL • DATEFROM * • DATETO • RATING • ORIGINAL_TYPE • X_COORD • Y_COORD • X_COORD_ITM • Y_COORD_ITM • LATITUDE * • LONGITUDE * • IMAGE_LINK • WEBSITE_LINK • SURVEY_ID • Link
  9. Prepare our data A free, open source, powerful tool for

    working with messy data openrefine.org • Clean the data to make values consistent * • Extract data we’re interested in * • Geo-code data ( https://github.com/OpenRefine/OpenRefine/wiki/Geocoding ) • If Google: Google Maps TOS, and limited to 2,500 addresses per day