Upgrade to Pro — share decks privately, control downloads, hide ads and more …

Introduction to Interactive Data Visualisation

Dave Kelly
November 16, 2016

Introduction to Interactive Data Visualisation

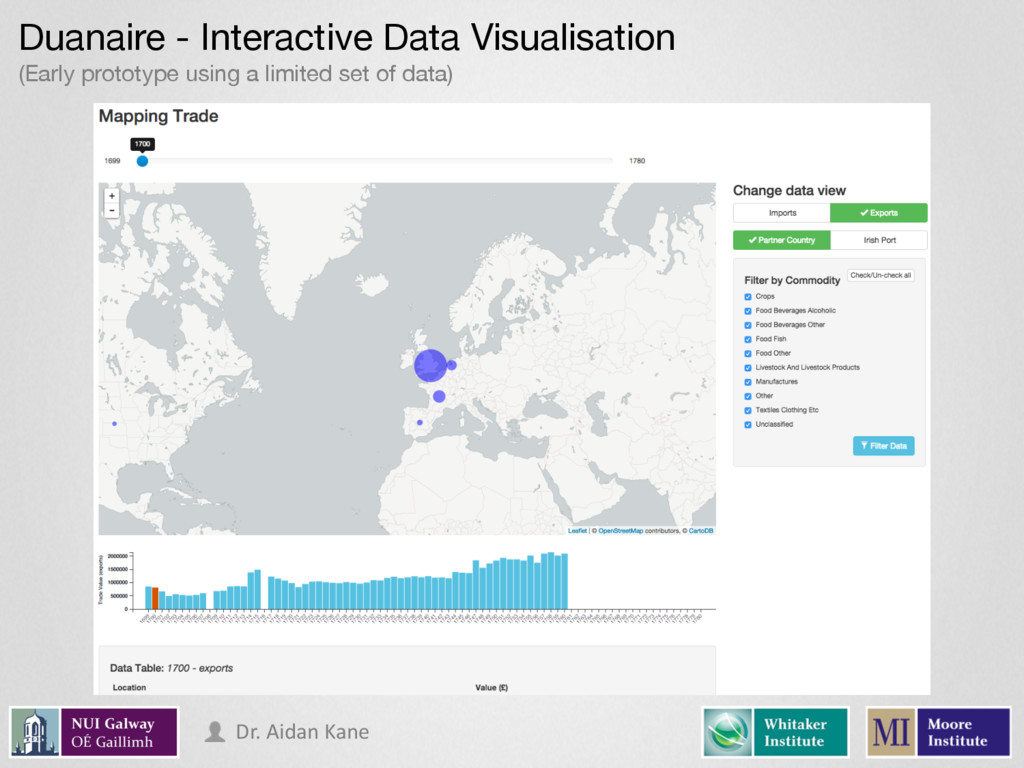
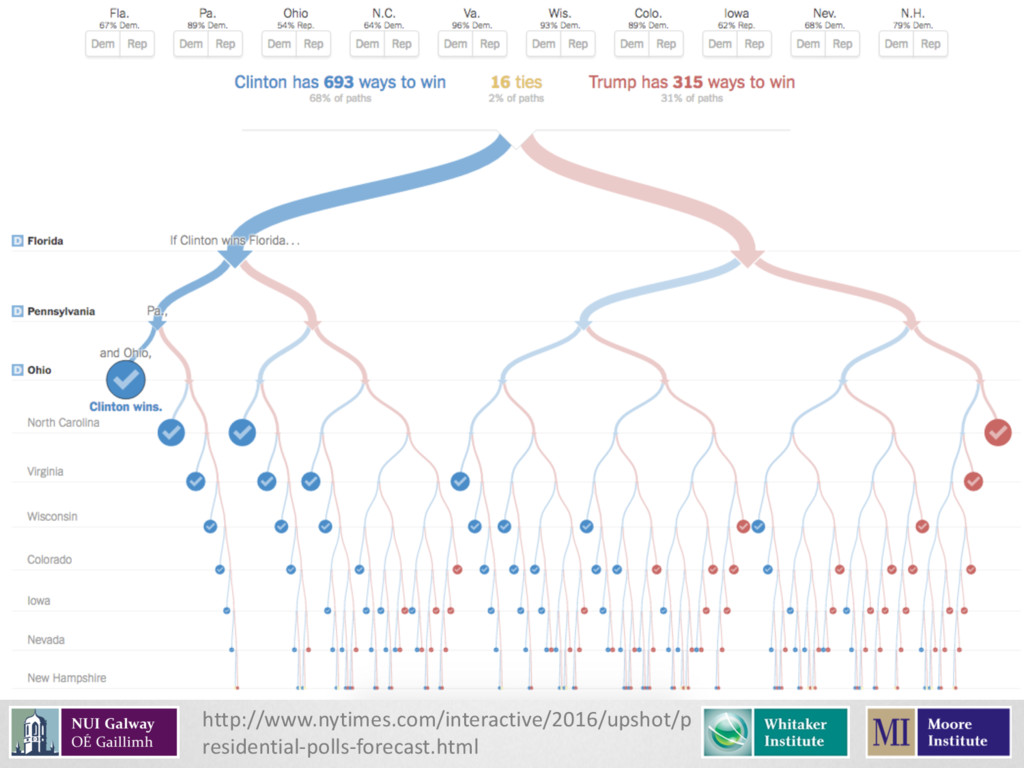
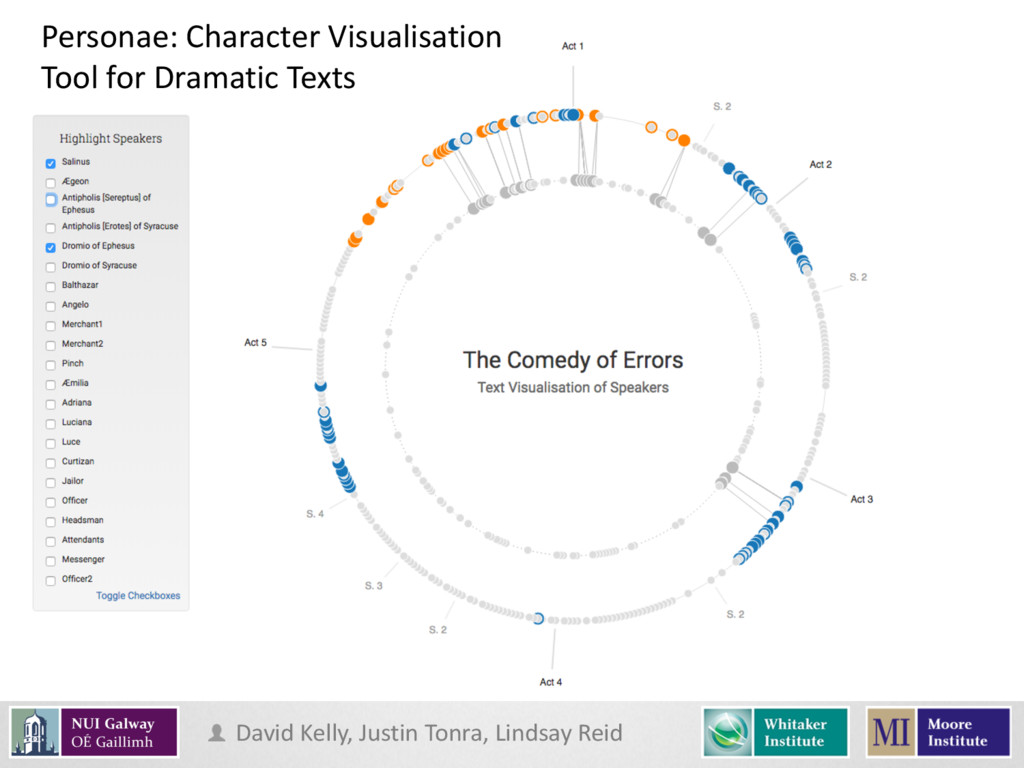
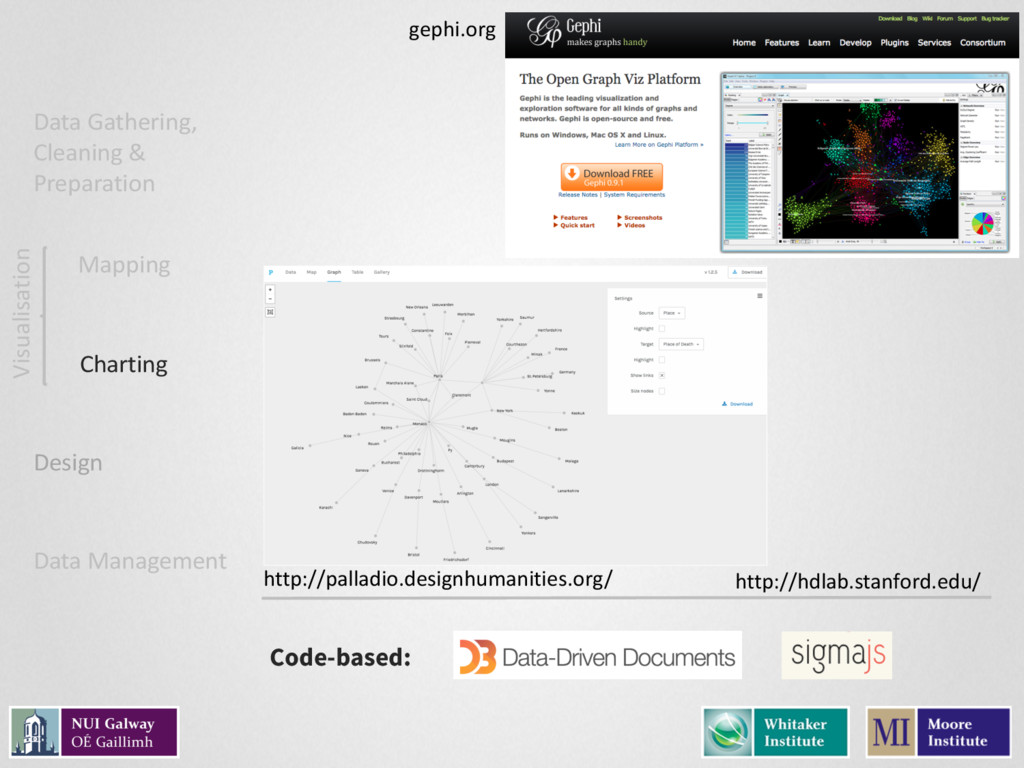
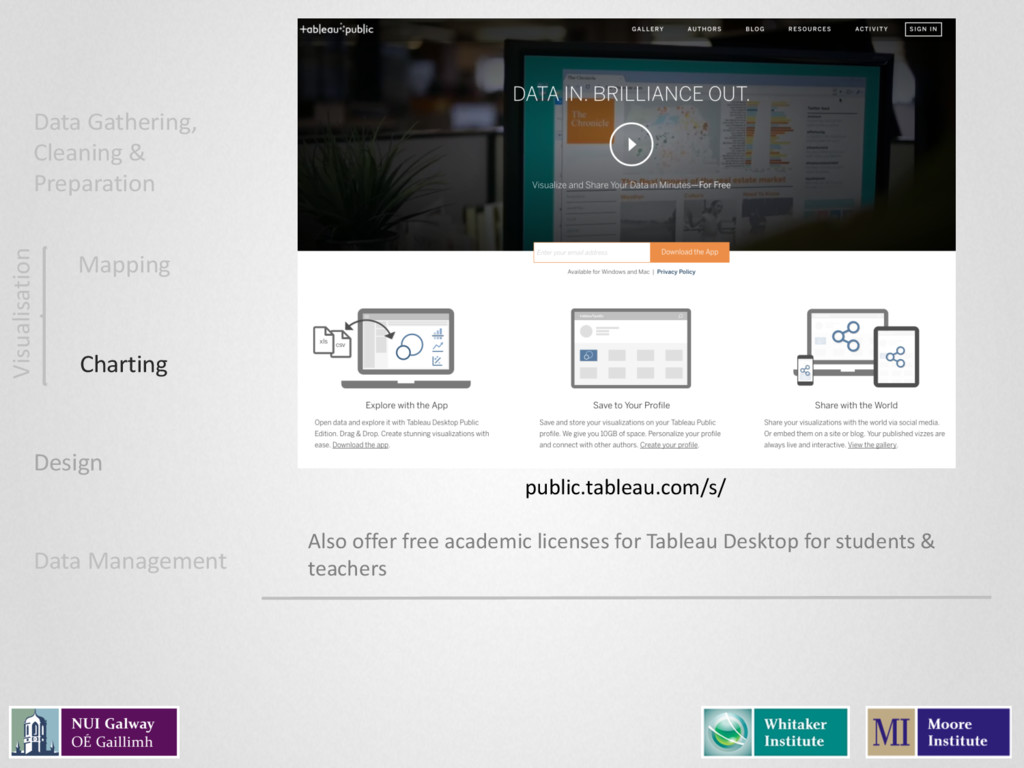
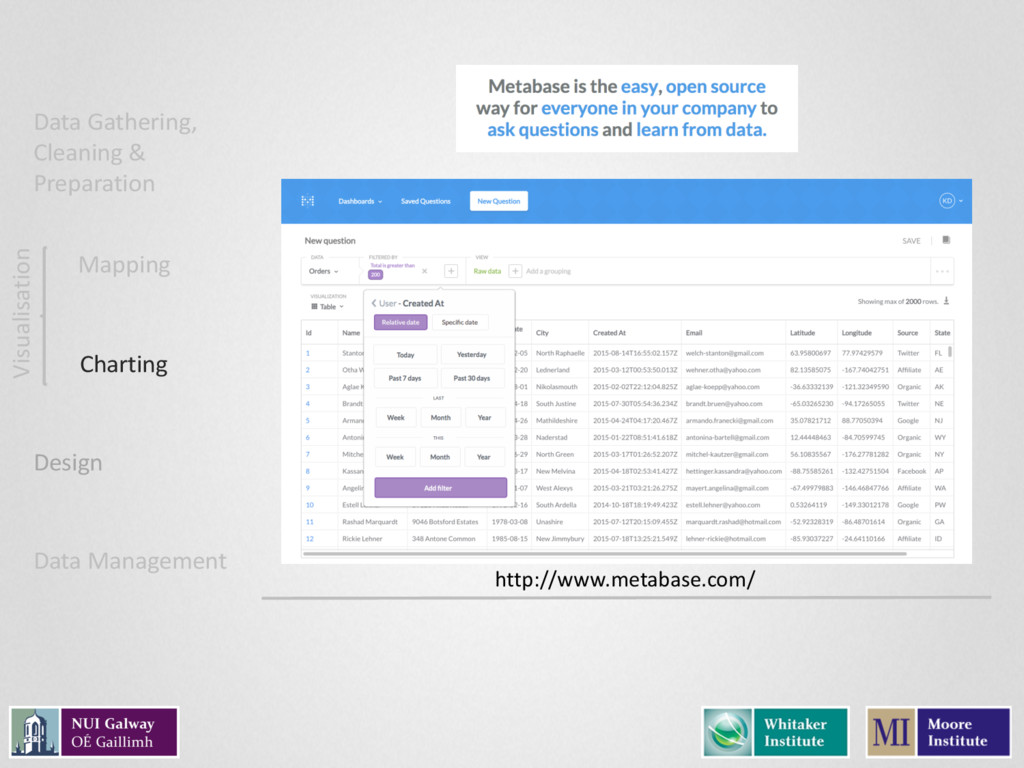
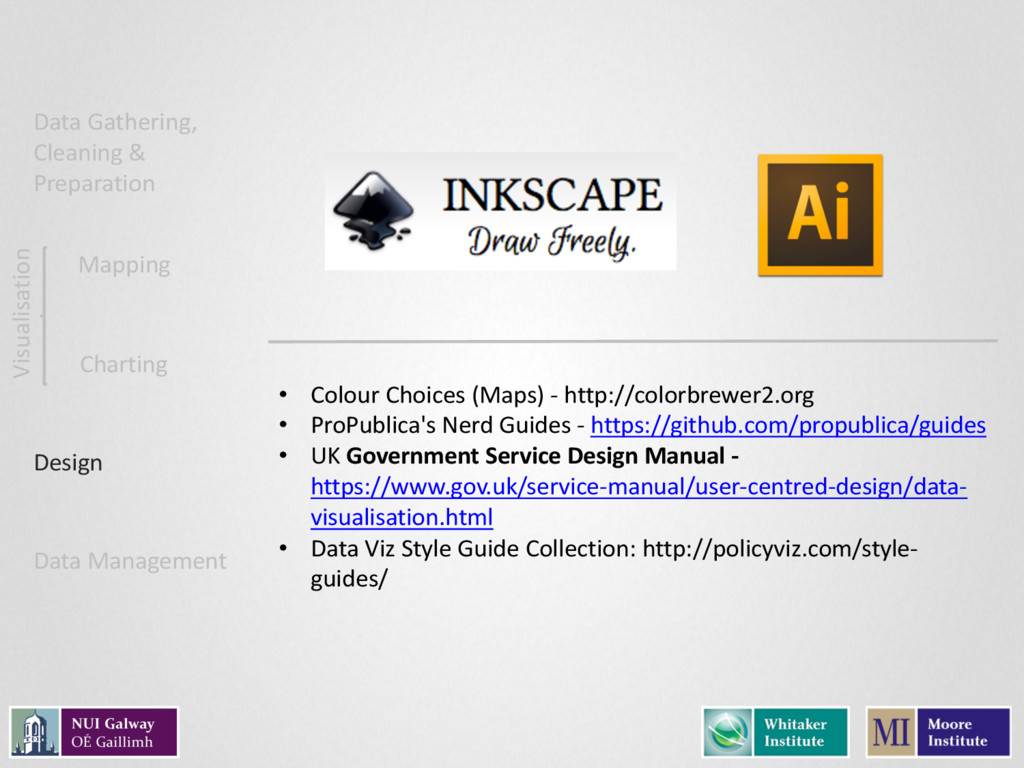
Examples of its use, along with tools for researchers to use to explore their data and create data visualisations of their own.

This talk was given at NUI Galway to researchers, students, non-academic staff and on-campus company staff on the 16th and 23rd of November, and on the 15th of December, 2016

Slides updated 15/12/16

Dave Kelly

November 16, 2016
Tweet

More Decks by Dave Kelly

Other Decks in Education

Transcript

  1. Interactive
    Data Visualisation
    David Kelly - Research Technologist
    v1.1  – Updated  December,  2016

    View Slide

  2. https://medium.com/@kennelliott/39-­‐studies-­‐about-­‐
    human-­‐perception-­‐in-­‐30-­‐minutes-­‐4728f9e31a73
    “Everything  we  know  about  how  humans  interpret  graphics”  -­‐
    https://www.youtube.com/watch?v=s0J6EDvlN30,  Kennedy  Elliot

    View Slide

  3. Explorable Explanations

    View Slide

  4. Explorable Explanations
    An  active  reader  asks  questions,  considers  alternatives,  
    questions  assumptions,  and  even  questions  the  
    trustworthiness  of  the  author.  An  active  reader  tries  to  
    generalize  specific  examples,  and  devise  specific  examples  
    for  generalities.  An  active  reader  doesn't  passively  sponge  up  
    information,  but  uses  the  author's  argument  as  a  
    springboard  for  critical  thought  and  deep  understanding.
    Bret  Victor,  March  10,  2011:  http://worrydream.com/ExplorableExplanations/

    View Slide

  5. Why?

    View Slide

  6. New perspectives

    View Slide

  7. Cultural  Networks
    Data  from  interviews  with  
    cultural  practitioners:
    • Demographic  
    • Funding
    • Relationship  types  
    • Geographic  data
    Dr.  Patrick  Collins  -­‐ Geography

    View Slide

  8. View Slide

  9. Dr Mark  Stansbury

    View Slide

  10. Data overview

    View Slide

  11. View Slide

  12. Dr Patrick  Collins  &  Dr Aisling  Murtagh -­‐ Geography

    View Slide

  13. Impact & engagement

    View Slide

  14. GalwayDashboard.ie
    Includes data from:
    CSO
    Galway  City  Council
    Galway  County  Council
    Enterprise  Ireland
    IDA
    Údarás
    WDC
    PRTB
    EPA
    Póbal
    Economic Baseline Assessment for Galway City & County
    James  Cunningham,  Galway  City  Council,  Galway  County  Council

    View Slide

  15. Complexity &
    non-expert users

    View Slide

  16. Duanaire - Interactive Data Visualisation
    Dr.  Aidan  Kane
    (Early prototype using a limited set of data)

    View Slide

  17. http://www.nytimes.com/interactive/2016/upshot/p
    residential-­‐polls-­‐forecast.html

    View Slide

  18. http://projects.propublica.org/louisiana/

    View Slide

  19. Engage with text differently

    View Slide

  20. View Slide

  21. Dr.  Justin  Tonra

    View Slide

  22. Personae:  Character  Visualisation  
    Tool  for  Dramatic  Texts
    David  Kelly,  Justin  Tonra,  Lindsay  Reid

    View Slide

  23. Danger

    View Slide

  24. From:  http://viz.wtf/

    View Slide

  25. From:  http://de.slideshare.net/vis4/making-­‐data-­‐
    visualizations-­‐a-­‐survival-­‐guide

    View Slide

  26. From:  http://viz.wtf/

    View Slide

  27. View Slide

  28. Consider

    View Slide

  29. Consider
    Labels  &  
    Supporting  Text
    Colours
    Context
    Interaction  
    Design
    Medium  Suitability
    Display  Channel
    Fonts
    Layout  /
    Interface  Design
    Audience

    View Slide

  30. View Slide

  31. Personae:  Character  Visualisation  
    Tool  for  Dramatic  Texts
    David  Kelly,  Justin  Tonra,  Lindsay  Reid

    View Slide

  32. Some Tools
    Mostly web-based, free option, little/no
    programming

    View Slide

  33. à CSV
    Import.io
    Option for non-profit /
    student use
    Code-based:
    Data  Gathering,  
    Cleaning  &  
    Preparation
    Mapping
    Charting
    Data  Management
    Design
    Visualisation

    View Slide

  34. Code-based:
    Data  Gathering,  
    Cleaning  &  
    Preparation
    Mapping
    Charting
    Data  Management
    Design
    Visualisation
    A free, open source, powerful tool
    for working with messy data
    openrefine.org

    View Slide

  35. • Limited  free  plans  
    available
    Code-based:
    • Map  design
    • Data  storage
    • Embed  maps
    Data  Gathering,  
    Cleaning  &  
    Preparation
    Mapping
    Charting
    Data  Management
    Design
    Visualisation

    View Slide

  36. Data  Gathering,  
    Cleaning  &  
    Preparation
    Mapping
    Charting
    Data  Management
    Design
    Visualisation
    Omeka Plugin  (NUIG  Library  
    Digital  Publishing)
    storymap.knightlab.com

    View Slide

  37. Data  Gathering,  
    Cleaning  &  
    Preparation
    Mapping
    Charting
    Data  Management
    Design
    Visualisation

    View Slide

  38. Code-based:
    Data  Gathering,  
    Cleaning  &  
    Preparation
    Mapping
    Charting
    Data  Management
    Design
    Visualisation

    View Slide

  39. Data  Gathering,  
    Cleaning  &  
    Preparation
    Mapping
    Charting
    Data  Management
    Design
    Visualisation
    https://timeline.knightlab.com
    Uses  a  Google  Spreadsheet  as  
    a  data  source
    https://juxtapose.knightlab.com/

    View Slide

  40. Code-based:
    Data  Gathering,  
    Cleaning  &  
    Preparation
    Mapping
    Charting
    Data  Management
    Design
    Visualisation
    http://palladio.designhumanities.org/
    gephi.org
    http://hdlab.stanford.edu/

    View Slide

  41. Data  Gathering,  
    Cleaning  &  
    Preparation
    Mapping
    Charting
    Data  Management
    Design
    Visualisation
    public.tableau.com/s/
    Also  offer  free  academic  licenses  for  Tableau  Desktop  for  students  &  
    teachers

    View Slide

  42. Data  Gathering,  
    Cleaning  &  
    Preparation
    Mapping
    Charting
    Data  Management
    Design
    Visualisation
    http://www.metabase.com/

    View Slide

  43. Data  Gathering,  
    Cleaning  &  
    Preparation
    Mapping
    Charting
    Data  Management
    Design
    Visualisation
    • Colour  Choices  (Maps)  -­‐ http://colorbrewer2.org
    • ProPublica's Nerd  Guides  -­‐ https://github.com/propublica/guides
    • UK  Government  Service  Design  Manual  -­‐
    https://www.gov.uk/service-­‐manual/user-­‐centred-­‐design/data-­‐
    visualisation.html
    • Data  Viz Style  Guide  Collection:  http://policyviz.com/style-­‐
    guides/

    View Slide

  44. Data  Gathering,  
    Cleaning  &  
    Preparation
    Mapping
    Charting
    Data Management
    Design
    Visualisation
    “Easily manage all your research
    outputs and make them available
    in a citable, shareable and
    discoverable manner”
    http://www.nature.com/sdata/policies/repositories

    View Slide

  45. http://www.clean-­‐sheet.org/

    View Slide

  46. Emerging Areas

    View Slide

  47. David Kelly
    [email protected]
    THB-1011, Hardiman Research Building
    @davkell
    www.davidkelly.ie |

    View Slide