Upgrade to Pro — share decks privately, control downloads, hide ads and more …

Interactive Data Visualisation for Researchers

Dave Kelly
January 18, 2018

Interactive Data Visualisation for Researchers

Workshop presentation given to Early Career Researchers and Doctoral Students as part of NARTI (Northern Advanced Research Training Initiative) at Northumbria Business School, Newcastle, UK in January 2018.

Part of a 1-day workshop on Positioning Your Research for Impact and Interactive Data Visualisation - see https://lubswww.leeds.ac.uk/narti/events/article/positioning-your-research-for-impact-and-interactive-data-visualisation-registration-closed/

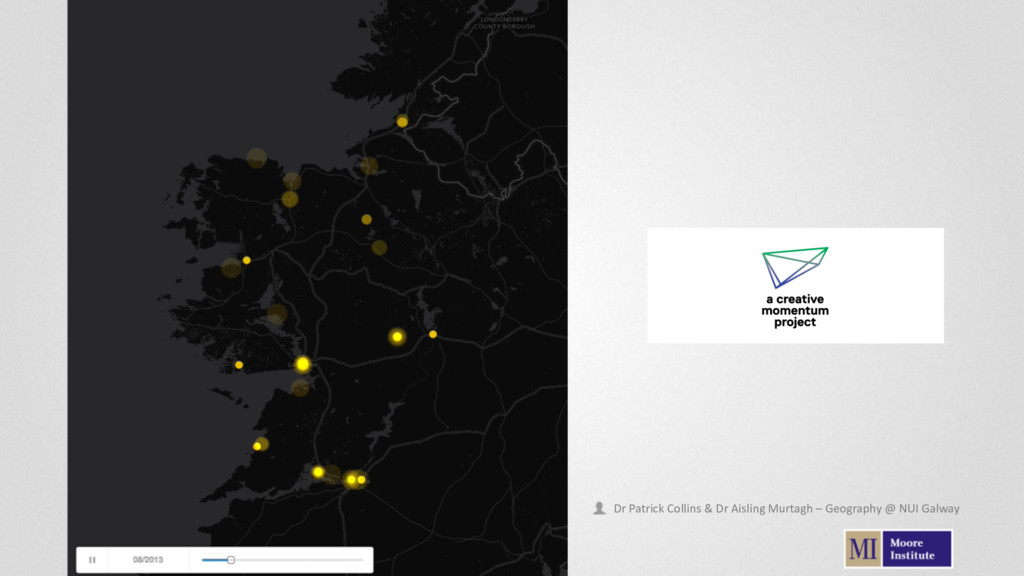
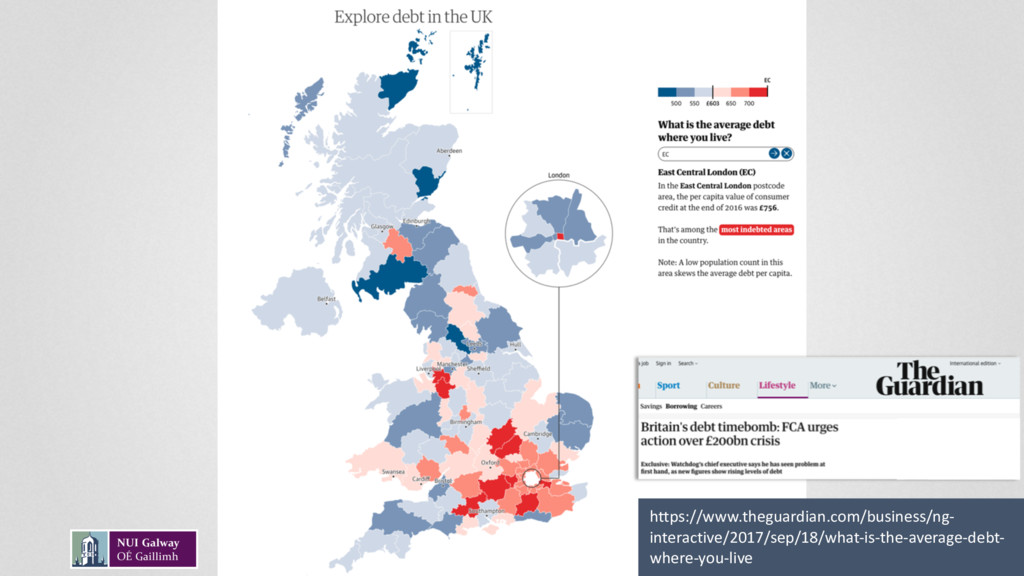
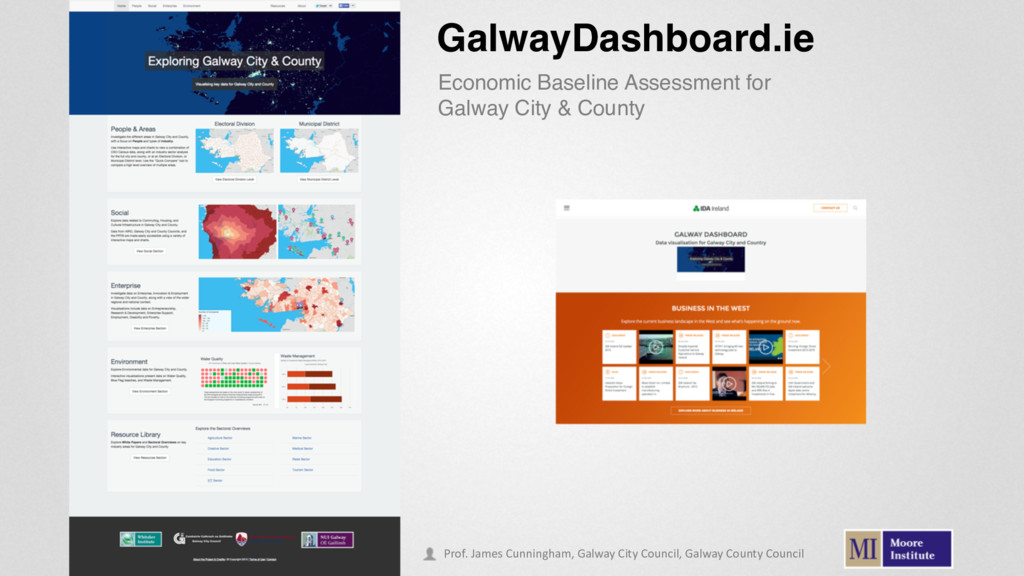
The aim was to provide participants with an overview of current trends with respect to interactive data visualisation and to provide participants with an opportunity to develop an interactive data visualisation plan for their own research

Dave Kelly

January 18, 2018
Tweet

More Decks by Dave Kelly

Other Decks in Research

Transcript

  1. Explorable Explanations An active reader asks questions, considers alternatives, questions

    assumptions, and even questions the trustworthiness of the author. An active reader tries to generalize specific examples, and devise specific examples for generalities. An active reader doesn't passively sponge up information, but uses the author's argument as a springboard for critical thought and deep understanding. Bret Victor, March 10, 2011: http://worrydream.com/ExplorableExplanations/
  2. Cultural Networks Data from interviews with cultural practitioners: • Demographic

    • Funding • Relationship types • Geographic data Dr. Patrick Collins – Geography @ NUI Galway
  3. GalwayDashboard.ie Economic Baseline Assessment for Galway City & County Prof.

    James Cunningham, Galway City Council, Galway County Council
  4. • Do it yourself • Collaborate with cross sector or

    cross departmental professionals • Seek the help of IT professionals • Provide the data to others for them to produce the visualisation. Gatto, M. (2015), “Making Research Useful: Current Challenges and Good Practices in Data Visualisation” http://reutersinstitute.politics.ox.ac.uk/our-research/visualisation-academic-research
  5. Consider* Labels, Annotation & Supporting Text Colour Context Interaction Design

    Suitability of vis. choice to data Where & how will it be engaged with? Fonts Layout / Interface Design Audience(s) Accessibility
  6. à CSV Import.io Option for non-profit / student use Code-based:

    Data Gathering, Cleaning & Preparation Mapping Charting Data Management Design Visualisation
  7. Code-based: Data Gathering, Cleaning & Preparation Mapping Charting Data Management

    Design Visualisation A free, open source, powerful tool for working with messy data openrefine.org
  8. • Limited free plans available Code-based: • Map design •

    Data storage • Embed maps Data Gathering, Cleaning & Preparation Mapping Charting Data Management Design Visualisation carto.com mapbox.com
  9. Data Gathering, Cleaning & Preparation Mapping Charting Data Management Design

    Visualisation Omeka Plugin storymap.knightlab.com
  10. Code-based: Data Gathering, Cleaning & Preparation Mapping Charting Data Management

    Design Visualisation http://datamatic.io www.datawrapper.de
  11. Data Gathering, Cleaning & Preparation Mapping Charting Data Management Design

    Visualisation https://timeline.knightlab.com Uses a Google Spreadsheet as a data source https://juxtapose.knightlab.com/
  12. Code-based: Data Gathering, Cleaning & Preparation Mapping Charting Data Management

    Design Visualisation http://palladio.designhumanities.org/ gephi.org http://hdlab.stanford.edu/
  13. Data Gathering, Cleaning & Preparation Mapping Charting Data Management Design

    Visualisation public.tableau.com/s/ Also offer free academic licenses for Tableau Desktop for students & teachers
  14. Data Gathering, Cleaning & Preparation Mapping Charting Data Management Design

    Visualisation • Colour Choices (Maps) - http://colorbrewer2.org • ProPublica's Nerd Guides - https://github.com/propublica/guides • UK Government Service Design Manual - https://www.gov.uk/service-manual/user-centred-design/data- visualisation.html • Data Viz Style Guide Collection: http://policyviz.com/style- guides/ • ai2html - an open-source script for Adobe Illustrator that converts your Illustrator documents into html and css (NY Times)
  15. Data Gathering, Cleaning & Preparation Mapping Charting Data Management Design

    Visualisation “Easily manage all your research outputs and make them available in a citable, shareable and discoverable manner” http://www.nature.com/sdata/policies/repositories
  16. Data Gathering, Cleaning & Preparation Mapping Charting Data Management Design

    Visualisation …gives you the digital analytics tools you need to analyze data from all touchpoints in one place
  17. • “The list of 2017 visualization lists”: http://www.maartenlambrechts.com/2017/12/28/the-list-of-2017- visualization-lists.html •

    The Data Visualisation Catalogue: https://datavizcatalogue.com/ • Seeing Data: http://seeingdata.org • Gatto, M. (2015), “Making Research Useful: Current Challenges and Good Practices in Data Visualisation” - http://reutersinstitute.politics.ox.ac.uk/our-research/visualisation-academic-research Books • “The Visual Display of Quantitative Data” (2001) by Edward Tufte • “The Functional Art: An introduction to information graphics and visualization“ (2012), Alberto Cairo • “Visualising Data” (2016) by Andy Kirk Useful Resources