$30 off During Our Annual Pro Sale. View Details »

Quality over Quantity: Determining Your CTI Detection Efficacy

Quality over Quantity: Determining Your CTI Detection Efficacy

[As presented at the SANS CTI Summit 2019]

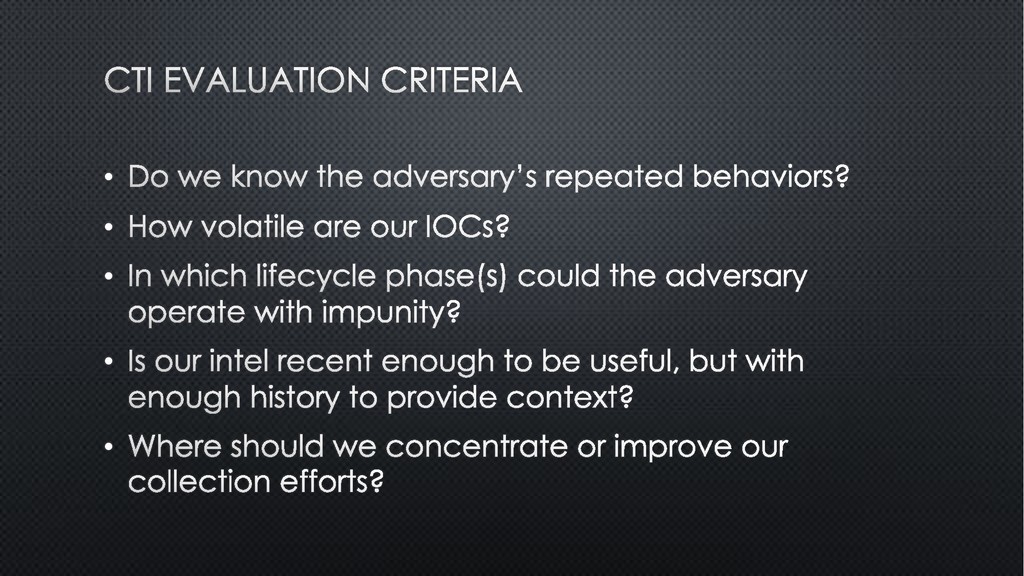
You’ve collected a lot of IOCs, but is your Cyber Threat Intelligence (CTI) process serving you well? Quantity alone doesn’t tell the whole story. What kinds of intel are you collecting and how useful is it for identifying incidents? What are your strongest areas and where are your gaps? Do you know enough about your priority threats to feel confident in your detection stance against them? These are hard questions to answer, and there’s little existing guidance for answering them.

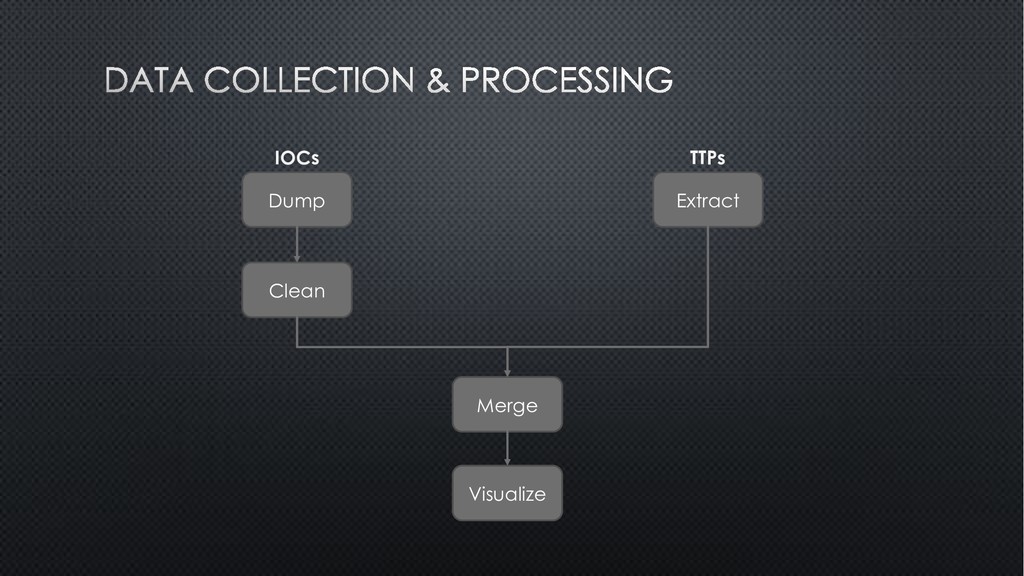
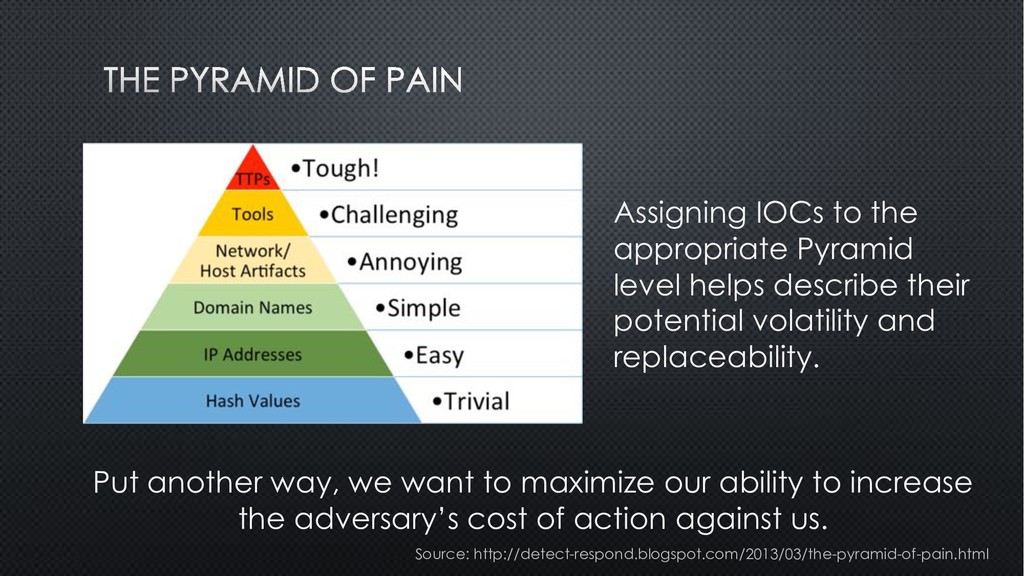
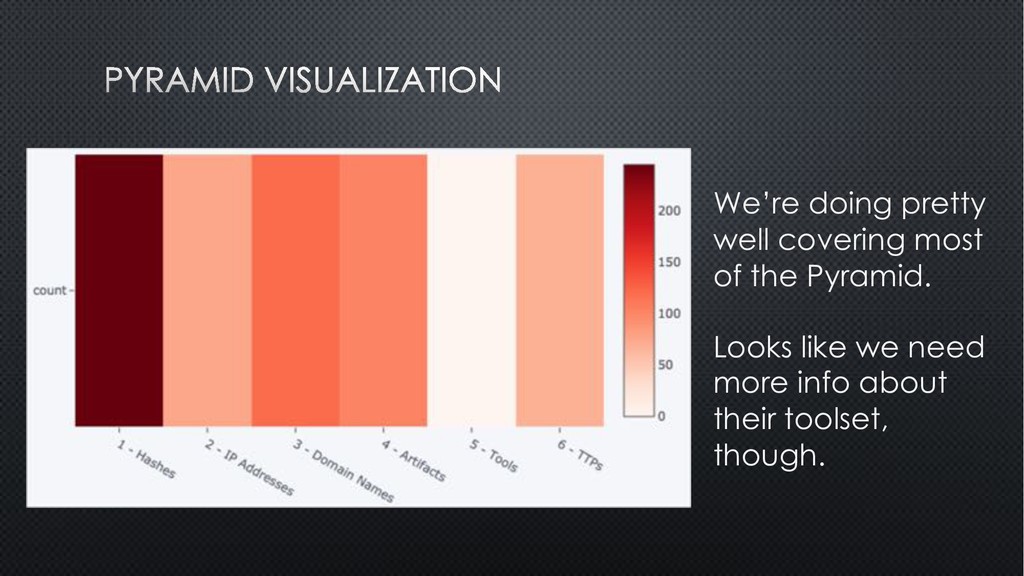
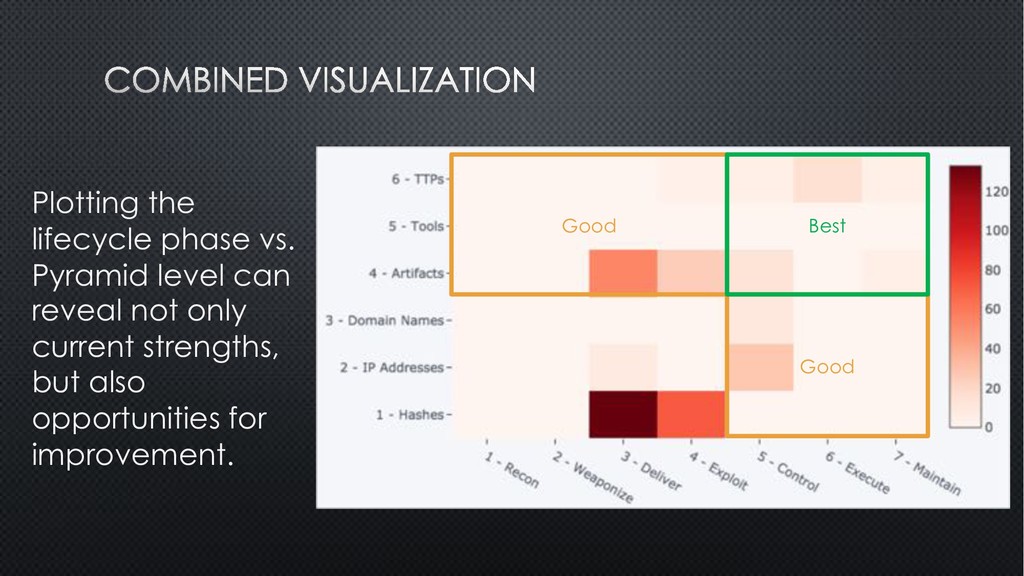
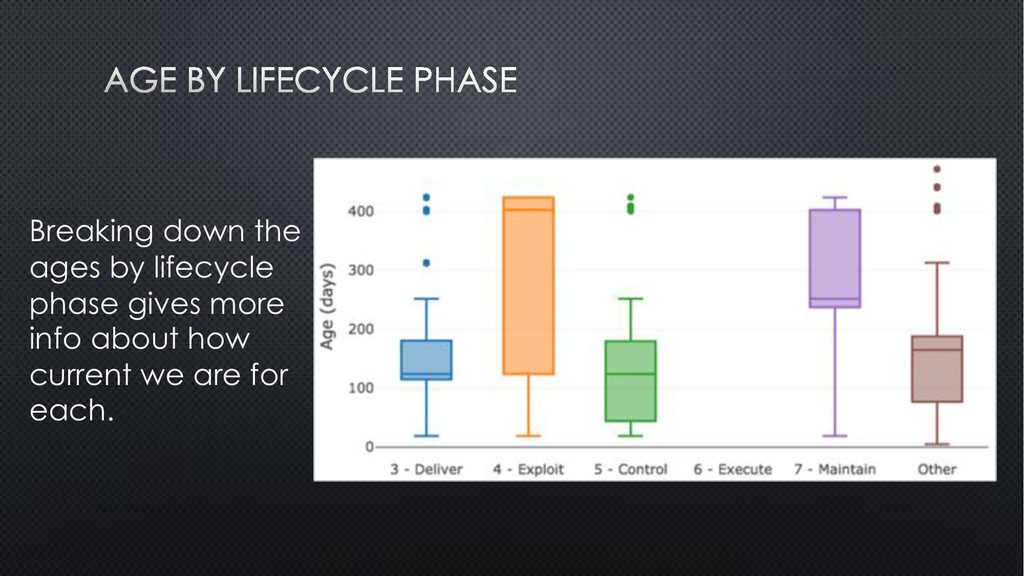
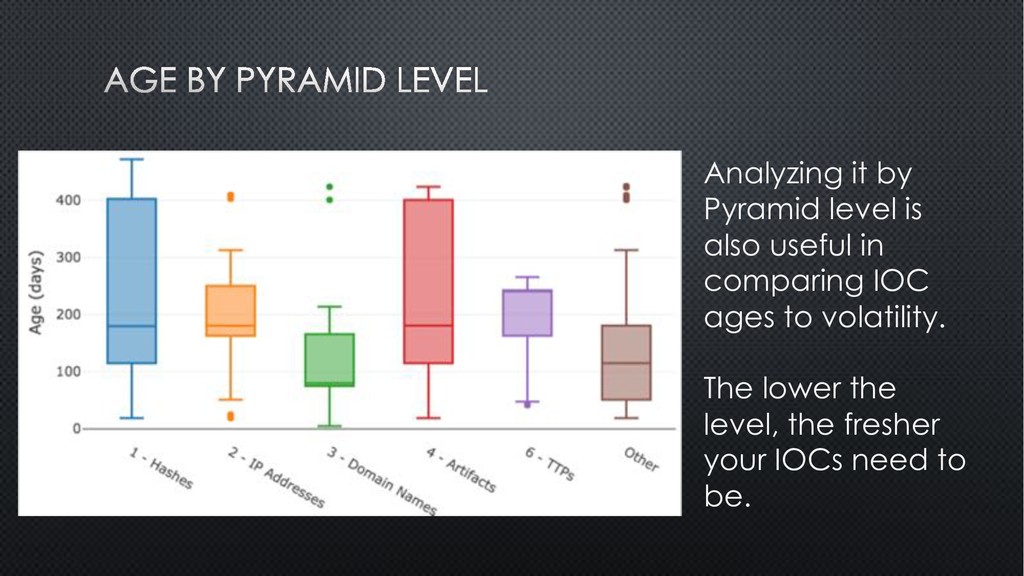
Taking a case study approach, this session will teach attendees how to use models such as the MITRE ATT&CK framework and the Pyramid of Pain to analyze and visualize the quality of their collected CTI information, not just it’s quantity.

David J. Bianco

January 21, 2019
Tweet

More Decks by David J. Bianco

Other Decks in Technology

Transcript

  1. View Slide


  2. I’d like you to review and identify gaps in
    what we know about our high priority threat
    actors going into peak [retail season].

    View Slide


  3. View Slide

  4. Clean
    Merge
    Dump Extract
    Visualize
    IOCs TTPs

    View Slide


  5. View Slide

  6. Assigning the IOCs and TTPs to phases in MITRE’s ATT&CK™
    lifecycle model allows us to see “where” in the lifecycle we know
    the most.
    Source: attack.mitre.org

    View Slide

  7. Most of our CTI
    centers around
    the attacker’s
    process for gaining
    a foothold in the
    environment.
    We know little
    about what
    happens before or
    after.

    View Slide

  8. Assigning IOCs to the
    appropriate Pyramid
    level helps describe their
    potential volatility and
    replaceability.
    Put another way, we want to maximize our ability to increase
    the adversary’s cost of action against us.
    Source: http://detect-respond.blogspot.com/2013/03/the-pyramid-of-pain.html

    View Slide

  9. We’re doing pretty
    well covering most
    of the Pyramid.
    Looks like we need
    more info about
    their toolset,
    though.

    View Slide

  10. Good
    Good
    Best
    Plotting the
    lifecycle phase vs.
    Pyramid level can
    reveal not only
    current strengths,
    but also
    opportunities for
    improvement.

    View Slide

  11. Box plot of IOC
    age reveals your
    balance between
    currency and
    history.
    ”Banding” on the
    left reveals
    patterns of
    collection.
    Oldest
    Median
    Newest

    View Slide

  12. Breaking down the
    ages by lifecycle
    phase gives more
    info about how
    current we are for
    each.

    View Slide

  13. Analyzing it by
    Pyramid level is
    also useful in
    comparing IOC
    ages to volatility.
    The lower the
    level, the fresher
    your IOCs need to
    be.

    View Slide

  14. Mapping the known
    TTPs to the ATT&CK
    Enterprise Matrix
    quickly shows strengths
    and weaknesses.
    White doesn’t imply a
    gap. Maybe the actor
    doesn’t do that thing.
    I’d like to find
    something better.

    View Slide

  15. Challenge What we did
    CTI data in multiple repositories
    • Developed custom extraction for each and
    merging/deduplication logic
    • Manual review of priority actor wiki pages
    Data tracked by different repos is
    inconsistent, sometimes even when it
    looks the same (e.g., timestamps mean
    different things)
    • Analyzed using estimates and approximations
    when necessary
    • Custom merging/deduplication logic
    Converting a one-time analysis into a
    repeatable, automatable process
    • Captured code, documentation and graphs
    in a Jupyter Notebook
    • Work is still ongoing…

    View Slide


  16. View Slide


  17. View Slide