GROUP BY cs_user_agent ORDER BY cnt ASC LIMIT 100 Splunk index=proxy method=POST status=200 | stats count by cs_user_agent | sort +count | head 100 Python # Using the ‘pandas’ module and DataFrames print proxy_df.value_counts(by=“cs_user_agent”, sort=True, ascending=True).head(100)
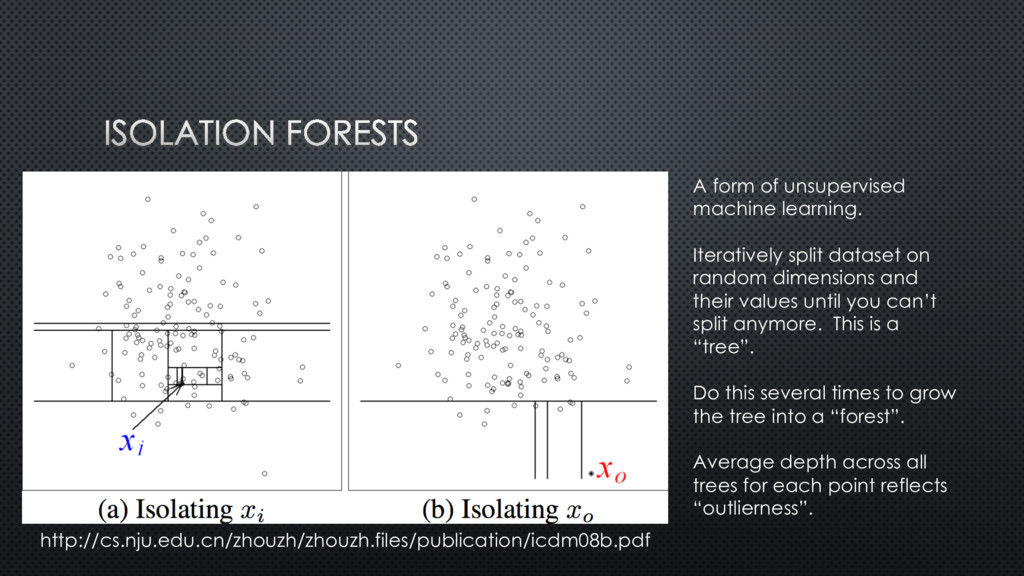
random dimensions and their values until you can’t split anymore. This is a “tree”. Do this several times to grow the tree into a “forest”. Average depth across all trees for each point reflects “outlierness”. http://cs.nju.edu.cn/zhouzh/zhouzh.files/publication/icdm08b.pdf
![SQL SELECT cs_user_agent, count(*) as cnt FROM proxy WHERE […]](https://files.speakerdeck.com/presentations/f3576240af5d434da7cdc9e49805e513/slide_6.jpg)
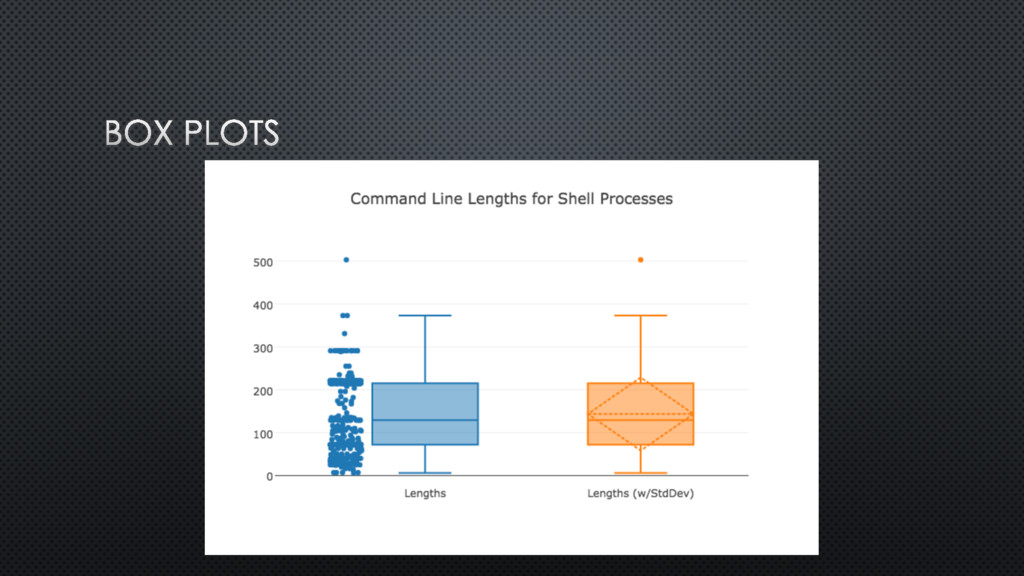
![import plotly.offline as pyo data = [ go.Box( y=shells["command_line_length"], boxpoints='all’](https://files.speakerdeck.com/presentations/f3576240af5d434da7cdc9e49805e513/slide_13.jpg)