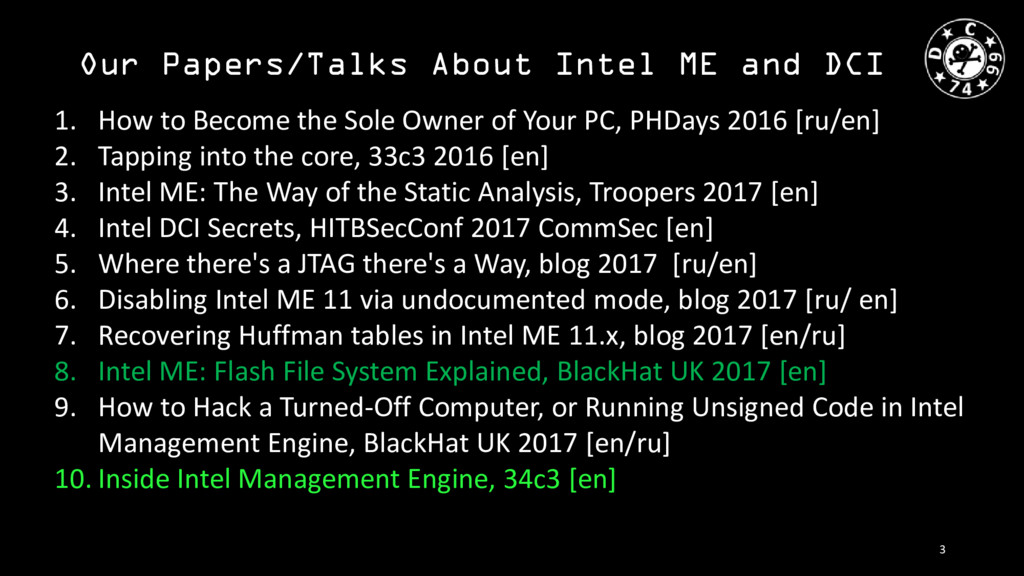
Become the Sole Owner of Your PC, PHDays 2016 [ru/en] 2. Tapping into the core, 33c3 2016 [en] 3. Intel ME: The Way of the Static Analysis, Troopers 2017 [en] 4. Intel DCI Secrets, HITBSecConf 2017 CommSec [en] 5. Where there's a JTAG there's a Way, blog 2017 [ru/en] 6. Disabling Intel ME 11 via undocumented mode, blog 2017 [ru/ en] 7. Recovering Huffman tables in Intel ME 11.x, blog 2017 [en/ru] 8. Intel ME: Flash File System Explained, BlackHat UK 2017 [en] 9. How to Hack a Turned-Off Computer, or Running Unsigned Code in Intel Management Engine, BlackHat UK 2017 [en/ru] 10. Inside Intel Management Engine, 34c3 [en] 3
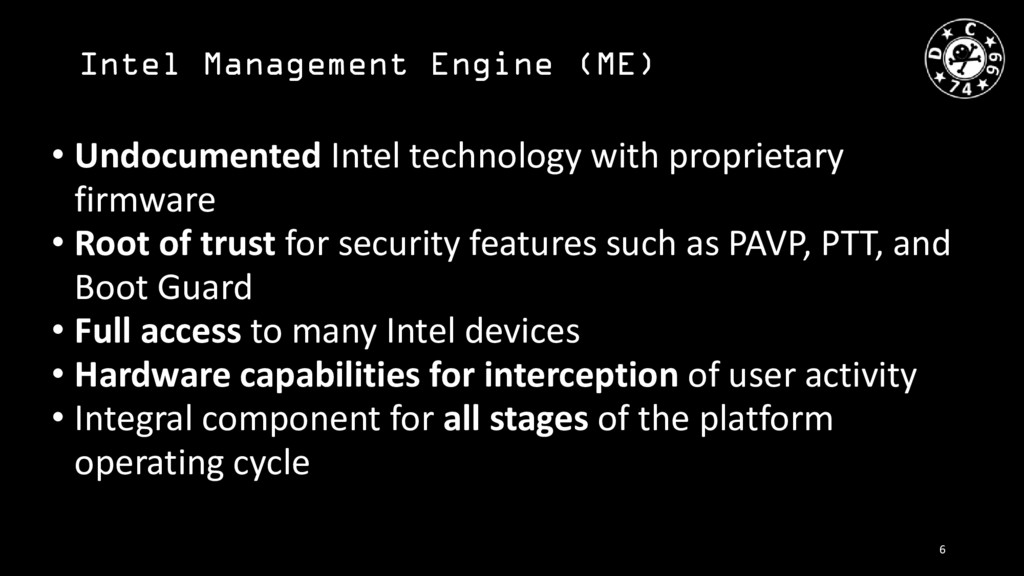
firmware • Root of trust for security features such as PAVP, PTT, and Boot Guard • Full access to many Intel devices • Hardware capabilities for interception of user activity • Integral component for all stages of the platform operating cycle 6
(x86) • Runs its own modified MINIX [STW17] • Has a built-in Java machine [IMS14] • Interacts with CPU/iGPU/USB/DDR/PCI/... • Operates when main CPU is powered down (M3 mode) • Contains starter code in non-reprogrammable on-die memory 7
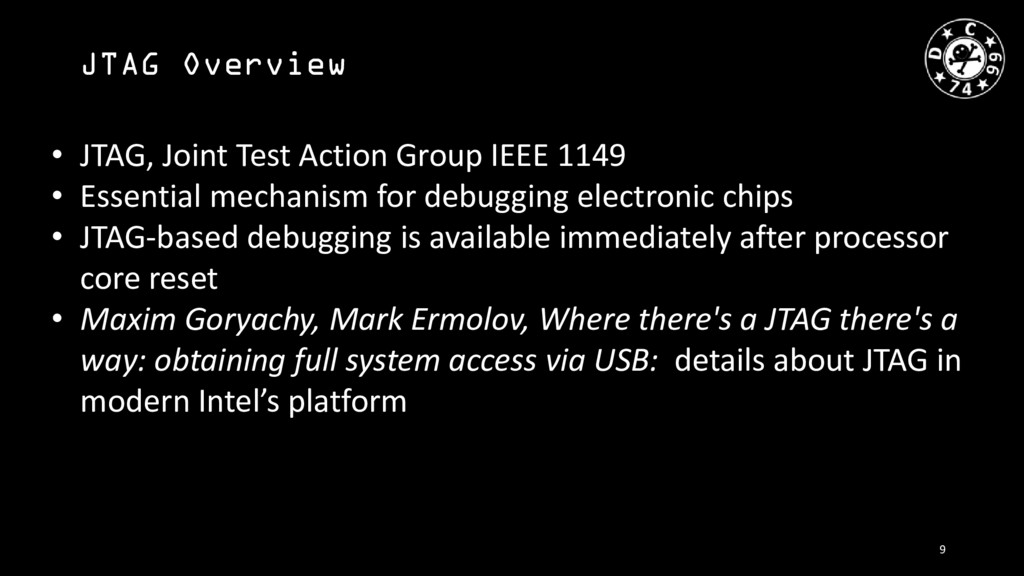
• Essential mechanism for debugging electronic chips • JTAG-based debugging is available immediately after processor core reset • Maxim Goryachy, Mark Ermolov, Where there's a JTAG there's a way: obtaining full system access via USB: details about JTAG in modern Intel’s platform 9
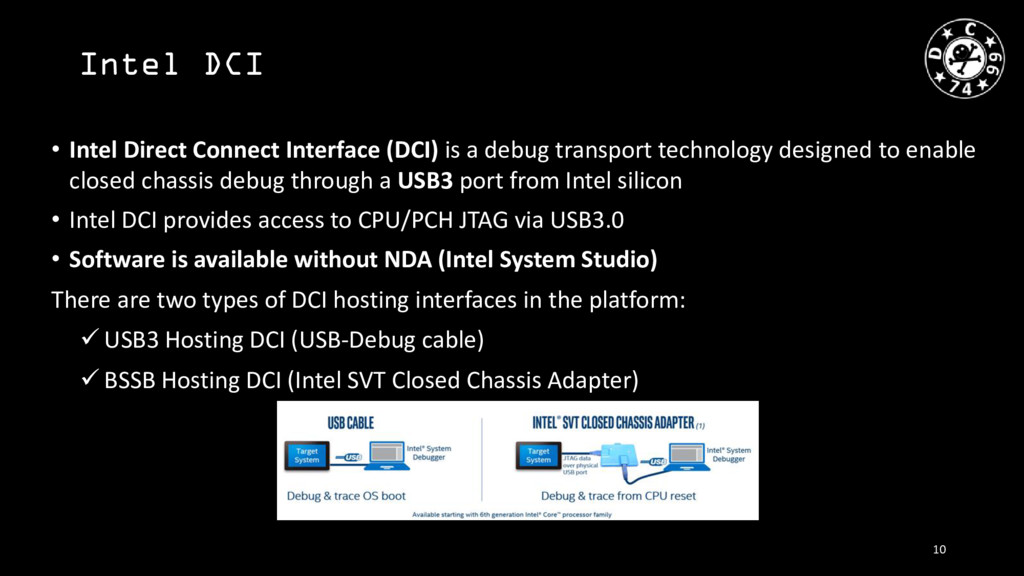
debug transport technology designed to enable closed chassis debug through a USB3 port from Intel silicon • Intel DCI provides access to CPU/PCH JTAG via USB3.0 • Software is available without NDA (Intel System Studio) There are two types of DCI hosting interfaces in the platform: USB3 Hosting DCI (USB-Debug cable) BSSB Hosting DCI (Intel SVT Closed Chassis Adapter) 10
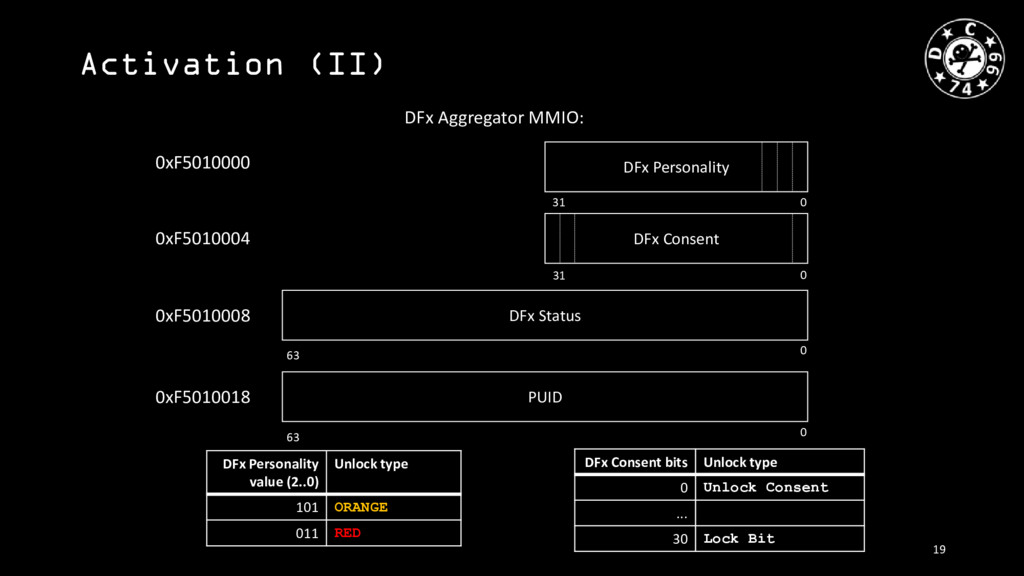
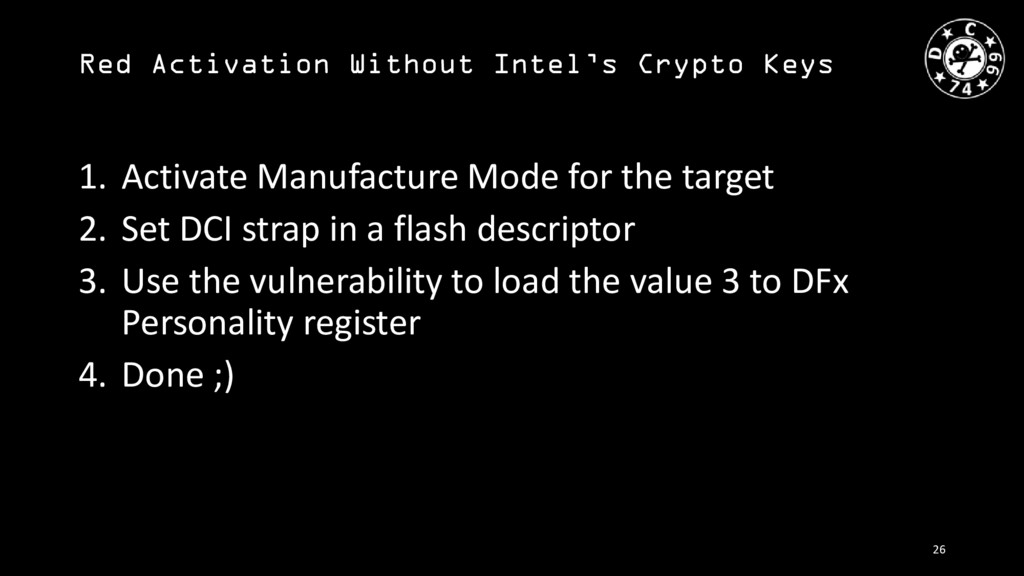
a special partition in ME region: • Integrated via FPT, HECI, DCI, or directly via an SPI programmer • Unique for the platform and temporary • Unlocking modes: ORANGE and RED • Designed to activate DFx functionality for Intel Management Engine 13
and debuggability • DFx is a private implementation of JTAG (1149.1 and 1149.7) by Intel • There are many integrated devices coupled to a DFx chain inside PCH and CPU • Embedded DFx Interface (ExI) is used to access DFx • ExI connects DFx and the external interface (such as USB) 14
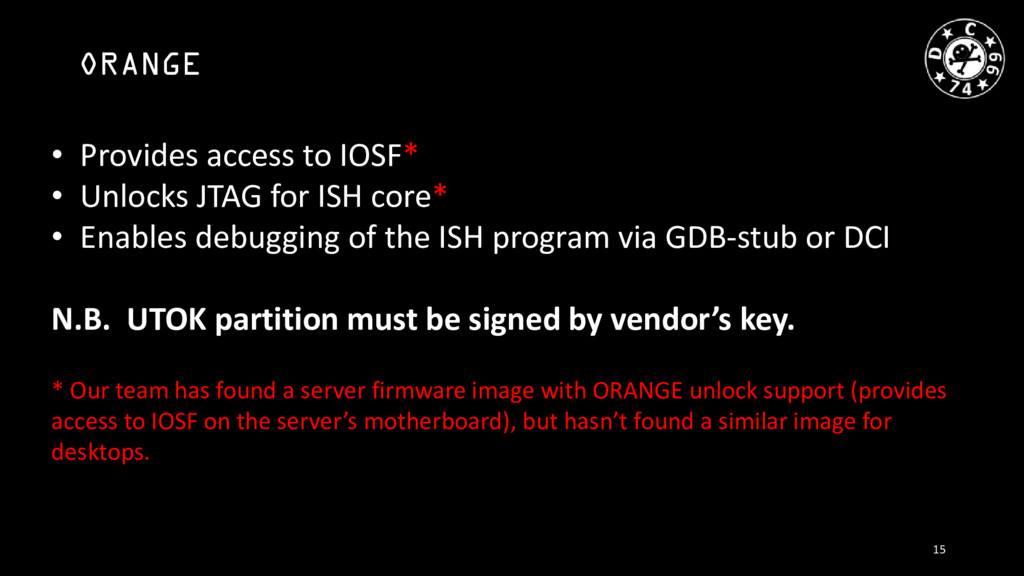
ISH core* • Enables debugging of the ISH program via GDB-stub or DCI N.B. UTOK partition must be signed by vendor’s key. * Our team has found a server firmware image with ORANGE unlock support (provides access to IOSF on the server’s motherboard), but hasn’t found a similar image for desktops. 15
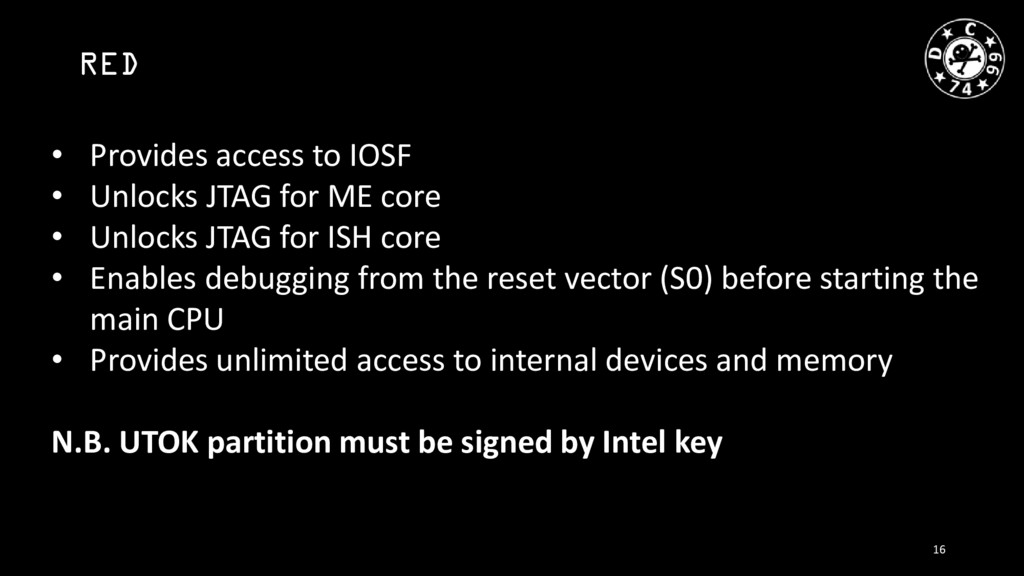
ME core • Unlocks JTAG for ISH core • Enables debugging from the reset vector (S0) before starting the main CPU • Provides unlimited access to internal devices and memory N.B. UTOK partition must be signed by Intel key 16
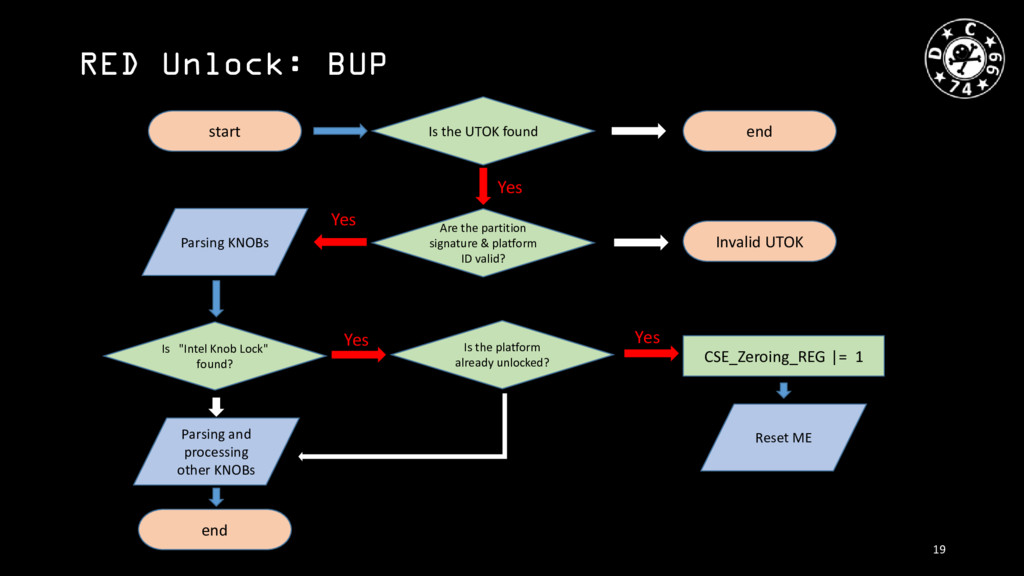
Yes end Are the partition signature & platform ID valid? Invalid UTOK Yes Is the platform already unlocked? Is "Intel Knob Lock" found? Yes Parsing and processing other KNOBs Yes end CSE_Zeroing_REG |= 1 Reset ME 19
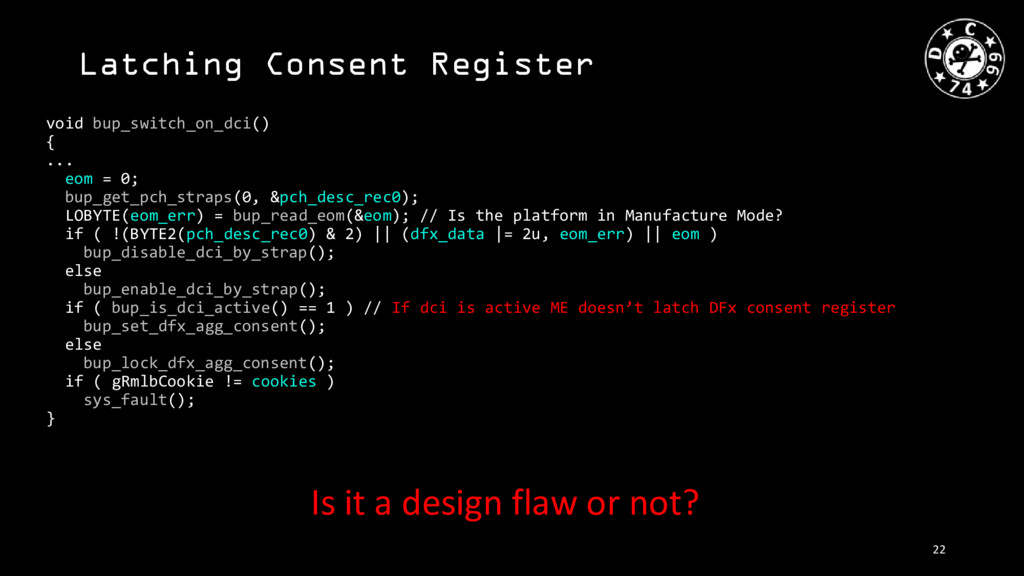
bup_get_pch_straps(0, &pch_desc_rec0); LOBYTE(eom_err) = bup_read_eom(&eom); // Is the platform in Manufacture Mode? if ( !(BYTE2(pch_desc_rec0) & 2) || (dfx_data |= 2u, eom_err) || eom ) bup_disable_dci_by_strap(); else bup_enable_dci_by_strap(); if ( bup_is_dci_active() == 1 ) // If dci is active ME doesn’t latch DFx consent register bup_set_dfx_agg_consent(); else bup_lock_dfx_agg_consent(); if ( gRmlbCookie != cookies ) sys_fault(); } Is it a design flaw or not? 22
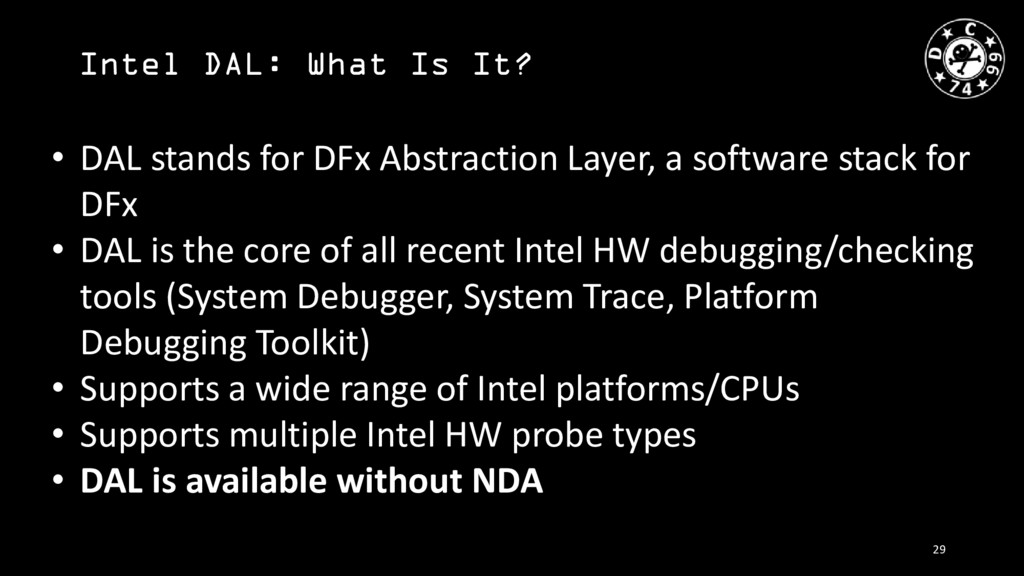
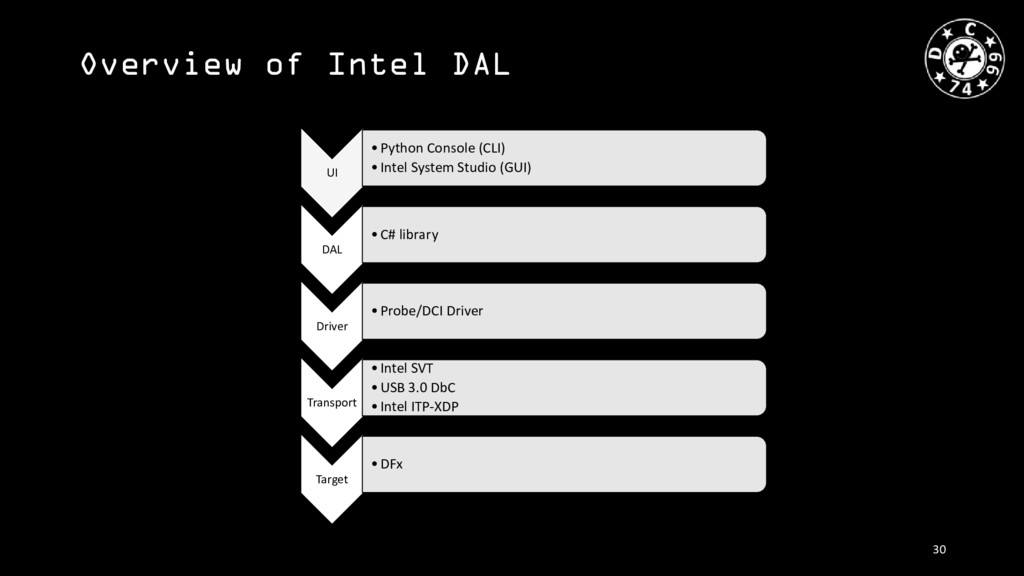
Abstraction Layer, a software stack for DFx • DAL is the core of all recent Intel HW debugging/checking tools (System Debugger, System Trace, Platform Debugging Toolkit) • Supports a wide range of Intel platforms/CPUs • Supports multiple Intel HW probe types • DAL is available without NDA 29
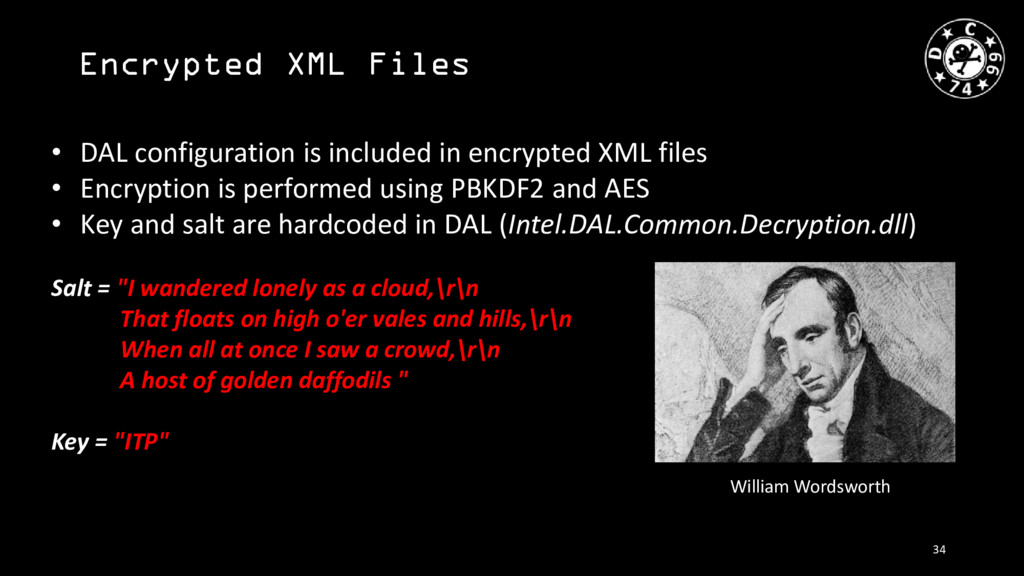
XML files • Encryption is performed using PBKDF2 and AES • Key and salt are hardcoded in DAL (Intel.DAL.Common.Decryption.dll) Salt = "I wandered lonely as a cloud,\r\n That floats on high o'er vales and hills,\r\n When all at once I saw a crowd,\r\n A host of golden daffodils " Key = "ITP" William Wordsworth 34
2. Add the following lines to "Topo.SPT.xml": 3. Use standard DAL environment for ME debugging 4. Make your computer personal again <Device Name="SPT_PARCSMEA" LogicalType="CHIPSET" IrLength="8" IdCode="0x00000000" Mask="0x00000000" IsIndependentTap="false" Subtypes="_INHERIT"> <_tag key="Invisible" value="False" /> <SubDevices> <SubDevice Name="LMT2" TapRegister="idcode" Field="idcode" Val="0x1" Mask="0x1" IsLogicalChild="true" SerializePreScan="TapSerializationSTAP0.Serialized" PhysicalEnable="True" /> <SubDevice Name="SPT_PARCSMEA_RETIME" TapRegister="idcode" Field="idcode" Val="0x1" Mask="0x1" IsLogicalChild="true" SerializePreScan="TapSerializationSTAP5.Serialized" PhysicalEnable="True" /> </SubDevices> </Device>
your chipset and how to discover what exactly it does. Hex-Rays. RECON 2014. [STW17] Dmitry Sklyarov, ME: The Way of the Static Analysis. Troopers 2017. [FFS17] Dmitry Sklyarov, Intel ME: flash file system explained, Black Hat Europe, 2017. [IDS17] Mark Ermolov, Maxim Goryachy, Intel DCI Secrets, HITBSecConf 2017 CommSec, Amsterdam, 2017. [HTH17] Mark Ermolov, Maxim Goryachy, How to Hack a Turned-Off Computer, or Running Unsigned Code in Intel Management Engine, Black Hat Europe, 2017. [PSTR14] Xiaoyu Ruan, Platform Embedded Security Technology Revealed: Safeguarding the Future of Computing with Intel Embedded Security and Management Engine, 2014, Apress, ISBN 978-1-4302-6572-6. 41
![CVE-2017-5705/6/7 void __cdecl bup_init_trace_hub() { ... int ct_data[202]; // [esp+1Ch]](https://files.speakerdeck.com/presentations/70e1aa8e9271466d9085a4eb83f63c5e/slide_23.jpg)
![References [IMS14] Igor Skochinsky, Intel ME Secrets. Hidden code in](https://files.speakerdeck.com/presentations/70e1aa8e9271466d9085a4eb83f63c5e/slide_40.jpg)