Is your Exposure to Devaluation Risk III. Portfolio Approaches to Hedging Devaluation Risk IV. Available Hedging Instruments/Options V. The Perspective of a Foreign Investor VI. Summary
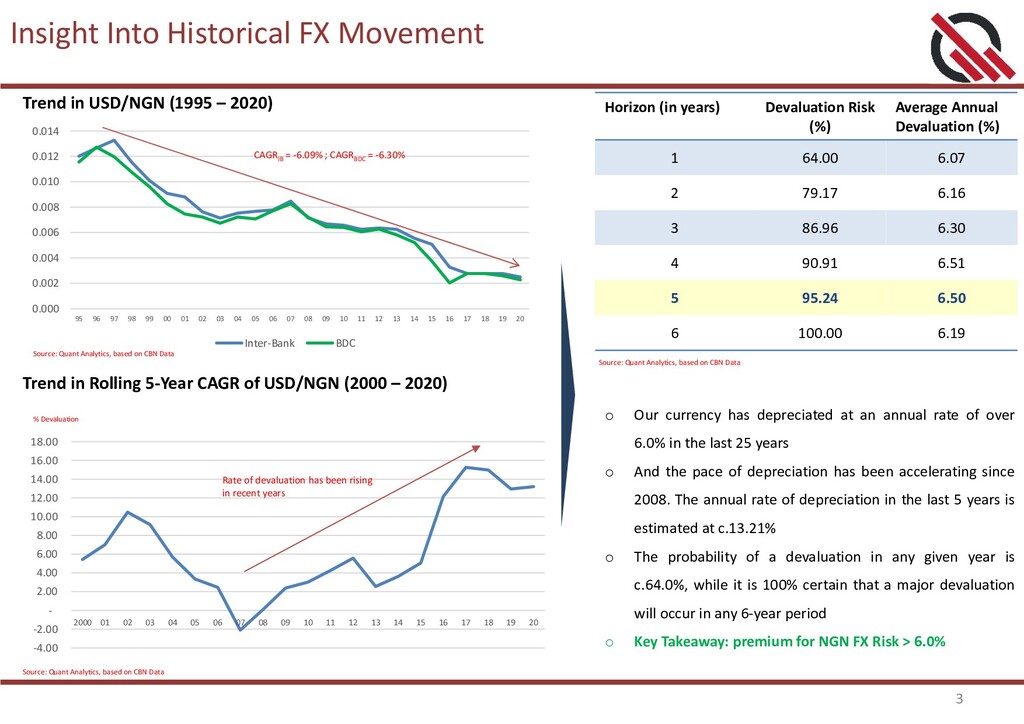
CAGR of USD/NGN (2000 – 2020) o Our currency has depreciated at an annual rate of over 6.0% in the last 25 years o And the pace of depreciation has been accelerating since 2008. The annual rate of depreciation in the last 5 years is estimated at c.13.21% o The probability of a devaluation in any given year is c.64.0%, while it is 100% certain that a major devaluation will occur in any 6-year period o Key Takeaway: premium for NGN FX Risk > 6.0% 0.000 0.002 0.004 0.006 0.008 0.010 0.012 0.014 95 96 97 98 99 00 01 02 03 04 05 06 07 08 09 10 11 12 13 14 15 16 17 18 19 20 Inter-Bank BDC CAGRIB = -6.09% ; CAGRBDC = -6.30% Horizon (in years) Devaluation Risk (%) Average Annual Devaluation (%) 1 64.00 6.07 2 79.17 6.16 3 86.96 6.30 4 90.91 6.51 5 95.24 6.50 6 100.00 6.19 -4.00 -2.00 - 2.00 4.00 6.00 8.00 10.00 12.00 14.00 16.00 18.00 2000 01 02 03 04 05 06 07 08 09 10 11 12 13 14 15 16 17 18 19 20 % Devaluation Rate of devaluation has been rising in recent years Trend in USD/NGN (1995 – 2020) Source: Quant Analytics, based on CBN Data Source: Quant Analytics, based on CBN Data Source: Quant Analytics, based on CBN Data
Is your Exposure to Devaluation Risk III. Portfolio Approaches to Hedging Devaluation Risk IV. Available Hedging Instruments/Options V. The Perspective of a Foreign Investor VI. Summary
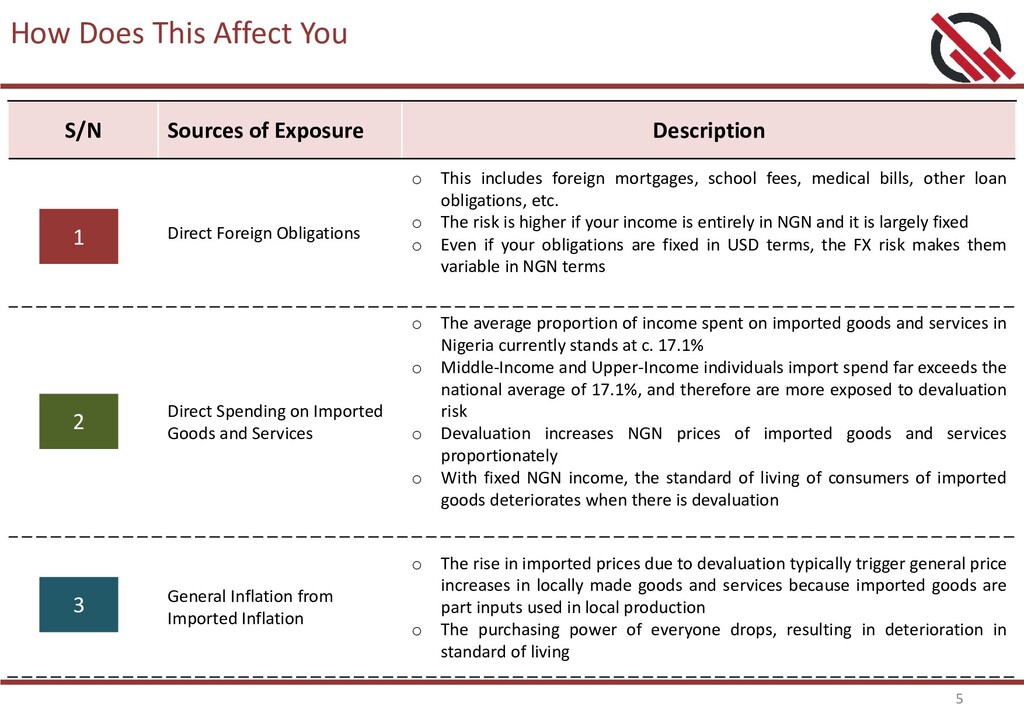
Description Direct Foreign Obligations o This includes foreign mortgages, school fees, medical bills, other loan obligations, etc. o The risk is higher if your income is entirely in NGN and it is largely fixed o Even if your obligations are fixed in USD terms, the FX risk makes them variable in NGN terms Direct Spending on Imported Goods and Services o The average proportion of income spent on imported goods and services in Nigeria currently stands at c. 17.1% o Middle-Income and Upper-Income individuals import spend far exceeds the national average of 17.1%, and therefore are more exposed to devaluation risk o Devaluation increases NGN prices of imported goods and services proportionately o With fixed NGN income, the standard of living of consumers of imported goods deteriorates when there is devaluation General Inflation from Imported Inflation o The rise in imported prices due to devaluation typically trigger general price increases in locally made goods and services because imported goods are part inputs used in local production o The purchasing power of everyone drops, resulting in deterioration in standard of living 1 2 3
Is your Exposure to Devaluation Risk III. Portfolio Approaches to Hedging Devaluation Risk IV. Available Hedging Instruments/Options V. The Perspective of a Foreign Investor VI. Summary
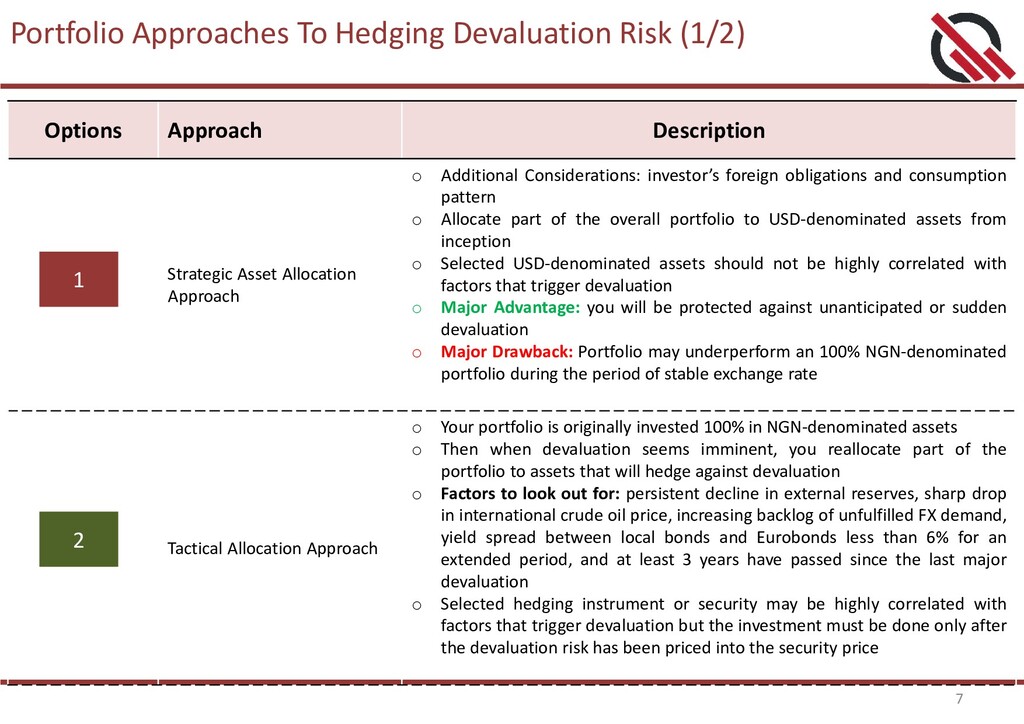
Description Strategic Asset Allocation Approach o Additional Considerations: investor’s foreign obligations and consumption pattern o Allocate part of the overall portfolio to USD-denominated assets from inception o Selected USD-denominated assets should not be highly correlated with factors that trigger devaluation o Major Advantage: you will be protected against unanticipated or sudden devaluation o Major Drawback: Portfolio may underperform an 100% NGN-denominated portfolio during the period of stable exchange rate Tactical Allocation Approach o Your portfolio is originally invested 100% in NGN-denominated assets o Then when devaluation seems imminent, you reallocate part of the portfolio to assets that will hedge against devaluation o Factors to look out for: persistent decline in external reserves, sharp drop in international crude oil price, increasing backlog of unfulfilled FX demand, yield spread between local bonds and Eurobonds less than 6% for an extended period, and at least 3 years have passed since the last major devaluation o Selected hedging instrument or security may be highly correlated with factors that trigger devaluation but the investment must be done only after the devaluation risk has been priced into the security price 1 2
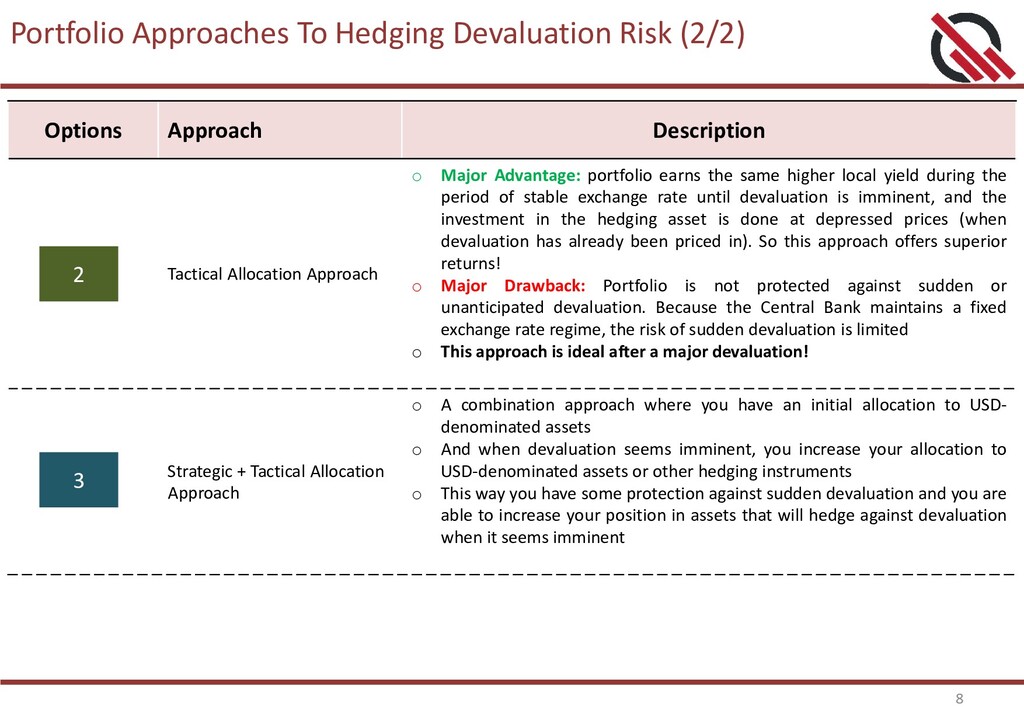
Description Tactical Allocation Approach o Major Advantage: portfolio earns the same higher local yield during the period of stable exchange rate until devaluation is imminent, and the investment in the hedging asset is done at depressed prices (when devaluation has already been priced in). So this approach offers superior returns! o Major Drawback: Portfolio is not protected against sudden or unanticipated devaluation. Because the Central Bank maintains a fixed exchange rate regime, the risk of sudden devaluation is limited o This approach is ideal after a major devaluation! Strategic + Tactical Allocation Approach o A combination approach where you have an initial allocation to USD- denominated assets o And when devaluation seems imminent, you increase your allocation to USD-denominated assets or other hedging instruments o This way you have some protection against sudden devaluation and you are able to increase your position in assets that will hedge against devaluation when it seems imminent 2 3
Is your Exposure to Devaluation Risk III. Portfolio Approaches to Hedging Devaluation Risk IV. Available Hedging Instruments/Options V. The Perspective of a Foreign Investor VI. Summary
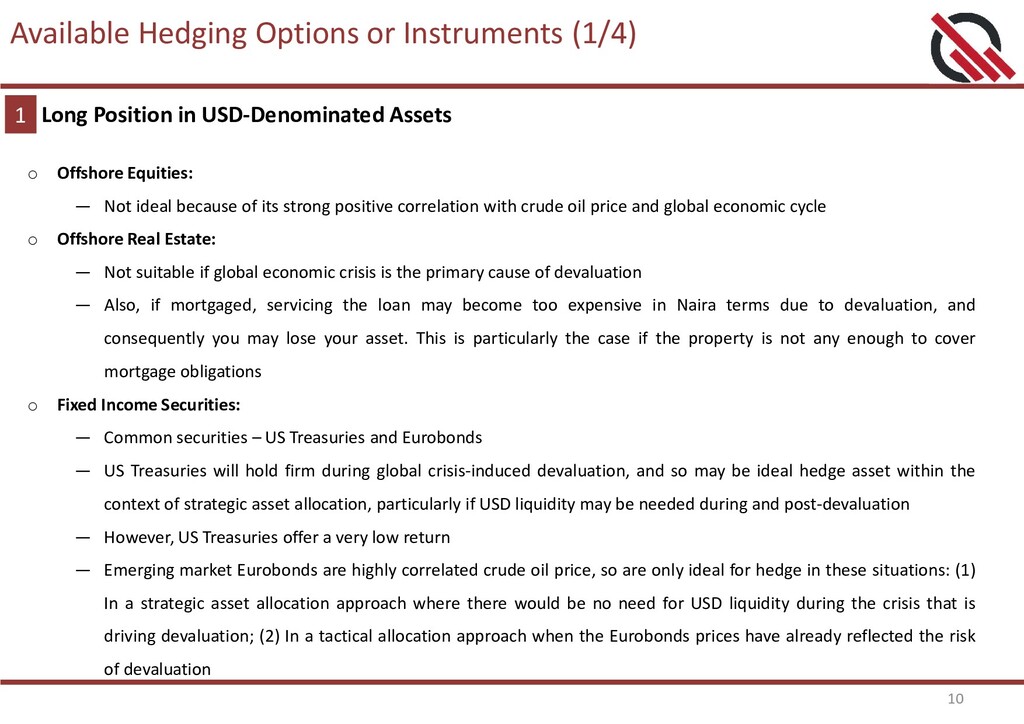
in USD-Denominated Assets o Offshore Equities: ― Not ideal because of its strong positive correlation with crude oil price and global economic cycle o Offshore Real Estate: ― Not suitable if global economic crisis is the primary cause of devaluation ― Also, if mortgaged, servicing the loan may become too expensive in Naira terms due to devaluation, and consequently you may lose your asset. This is particularly the case if the property is not any enough to cover mortgage obligations o Fixed Income Securities: ― Common securities – US Treasuries and Eurobonds ― US Treasuries will hold firm during global crisis-induced devaluation, and so may be ideal hedge asset within the context of strategic asset allocation, particularly if USD liquidity may be needed during and post-devaluation ― However, US Treasuries offer a very low return ― Emerging market Eurobonds are highly correlated crude oil price, so are only ideal for hedge in these situations: (1) In a strategic asset allocation approach where there would be no need for USD liquidity during the crisis that is driving devaluation; (2) In a tactical allocation approach when the Eurobonds prices have already reflected the risk of devaluation
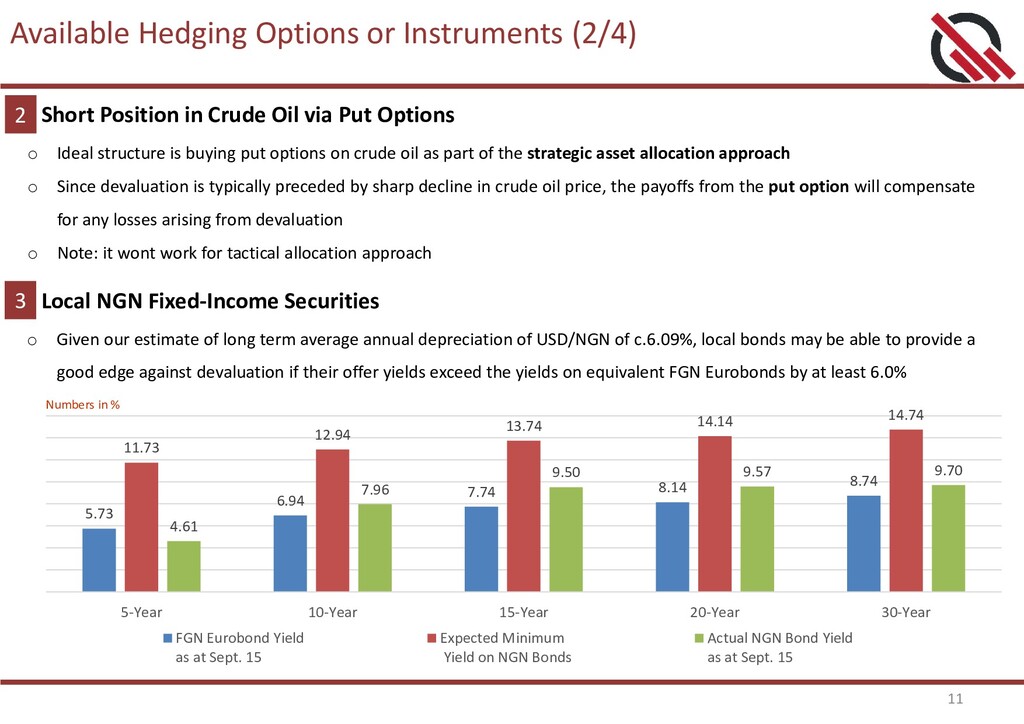
in Crude Oil via Put Options o Ideal structure is buying put options on crude oil as part of the strategic asset allocation approach o Since devaluation is typically preceded by sharp decline in crude oil price, the payoffs from the put option will compensate for any losses arising from devaluation o Note: it wont work for tactical allocation approach 3 o Given our estimate of long term average annual depreciation of USD/NGN of c.6.09%, local bonds may be able to provide a good edge against devaluation if their offer yields exceed the yields on equivalent FGN Eurobonds by at least 6.0% Local NGN Fixed-Income Securities 5.73 6.94 7.74 8.14 8.74 11.73 12.94 13.74 14.14 14.74 4.61 7.96 9.50 9.57 9.70 5-Year 10-Year 15-Year 20-Year 30-Year FGN Eurobond Yield as at Sept. 15 Expected Minimum Yield on NGN Bonds Actual NGN Bond Yield as at Sept. 15 Numbers in %
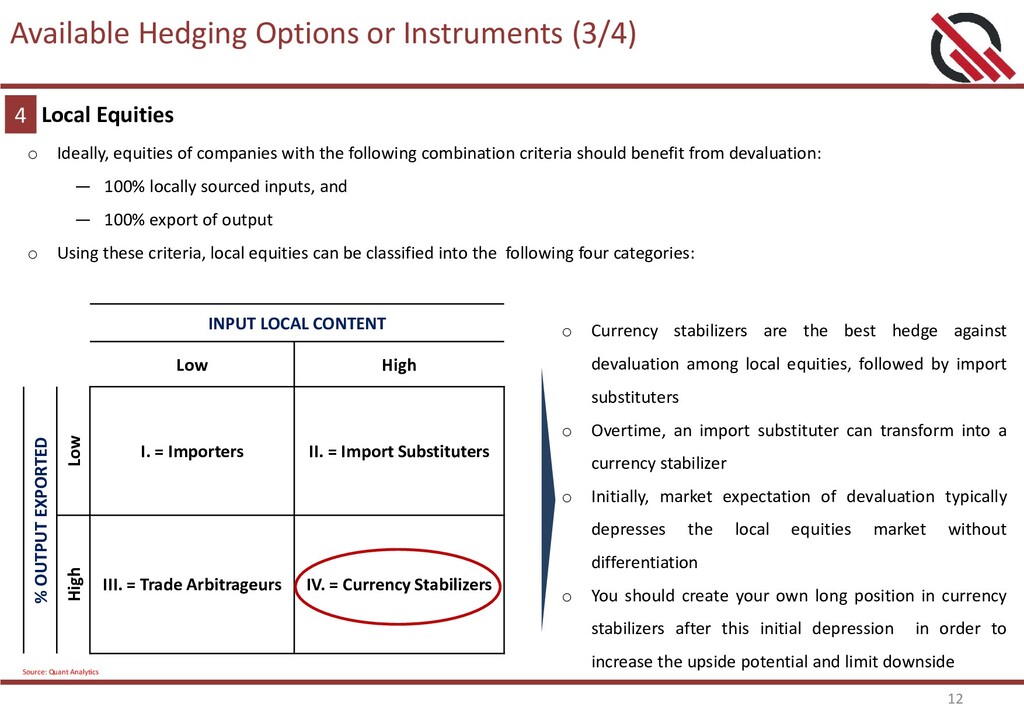
o Ideally, equities of companies with the following combination criteria should benefit from devaluation: ― 100% locally sourced inputs, and ― 100% export of output o Using these criteria, local equities can be classified into the following four categories: INPUT LOCAL CONTENT Low High % OUTPUT EXPORTED Low I. = Importers II. = Import Substituters High III. = Trade Arbitrageurs IV. = Currency Stabilizers o Currency stabilizers are the best hedge against devaluation among local equities, followed by import substituters o Overtime, an import substituter can transform into a currency stabilizer o Initially, market expectation of devaluation typically depresses the local equities market without differentiation o You should create your own long position in currency stabilizers after this initial depression in order to increase the upside potential and limit downside Source: Quant Analytics
Is your Exposure to Devaluation Risk III. Portfolio Approaches to Hedging Devaluation Risk IV. Available Hedging Instruments/Options V. The Perspective of a Foreign Investor VI. Summary
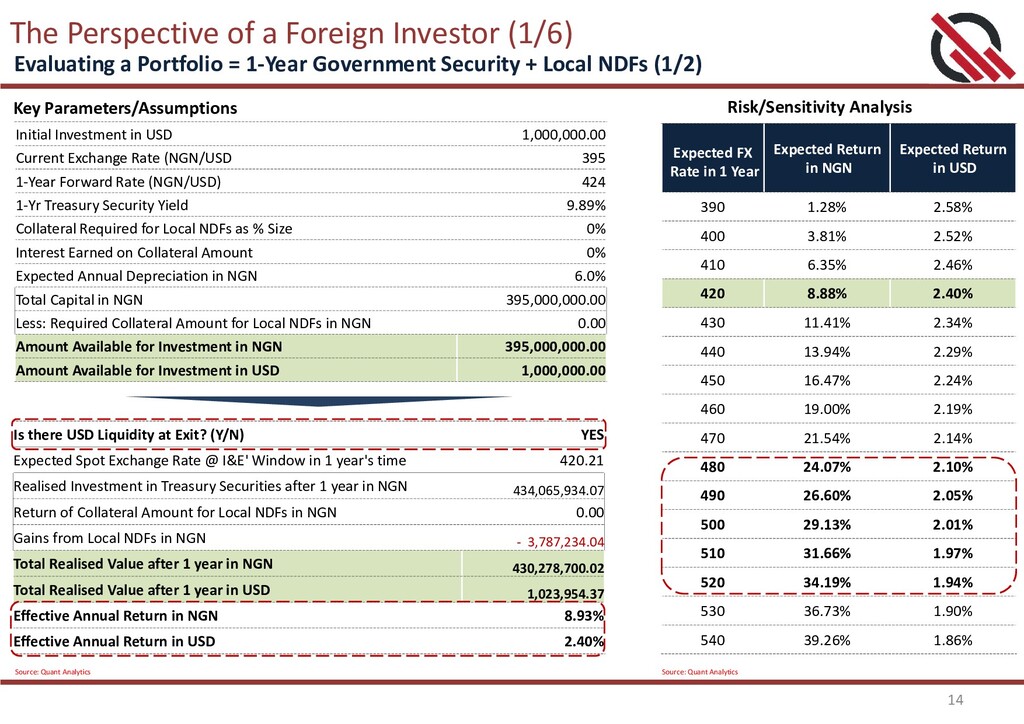
Evaluating a Portfolio = 1-Year Government Security + Local NDFs (1/2) Risk/Sensitivity Analysis Initial Investment in USD 1,000,000.00 Current Exchange Rate (NGN/USD 395 1-Year Forward Rate (NGN/USD) 424 1-Yr Treasury Security Yield 9.89% Collateral Required for Local NDFs as % Size 0% Interest Earned on Collateral Amount 0% Expected Annual Depreciation in NGN 6.0% Total Capital in NGN 395,000,000.00 Less: Required Collateral Amount for Local NDFs in NGN 0.00 Amount Available for Investment in NGN 395,000,000.00 Amount Available for Investment in USD 1,000,000.00 Is there USD Liquidity at Exit? (Y/N) YES Expected Spot Exchange Rate @ I&E' Window in 1 year's time 420.21 Realised Investment in Treasury Securities after 1 year in NGN 434,065,934.07 Return of Collateral Amount for Local NDFs in NGN 0.00 Gains from Local NDFs in NGN - 3,787,234.04 Total Realised Value after 1 year in NGN 430,278,700.02 Total Realised Value after 1 year in USD 1,023,954.37 Effective Annual Return in NGN 8.93% Effective Annual Return in USD 2.40% Expected FX Rate in 1 Year Expected Return in NGN Expected Return in USD 390 1.28% 2.58% 400 3.81% 2.52% 410 6.35% 2.46% 420 8.88% 2.40% 430 11.41% 2.34% 440 13.94% 2.29% 450 16.47% 2.24% 460 19.00% 2.19% 470 21.54% 2.14% 480 24.07% 2.10% 490 26.60% 2.05% 500 29.13% 2.01% 510 31.66% 1.97% 520 34.19% 1.94% 530 36.73% 1.90% 540 39.26% 1.86% Source: Quant Analytics Source: Quant Analytics
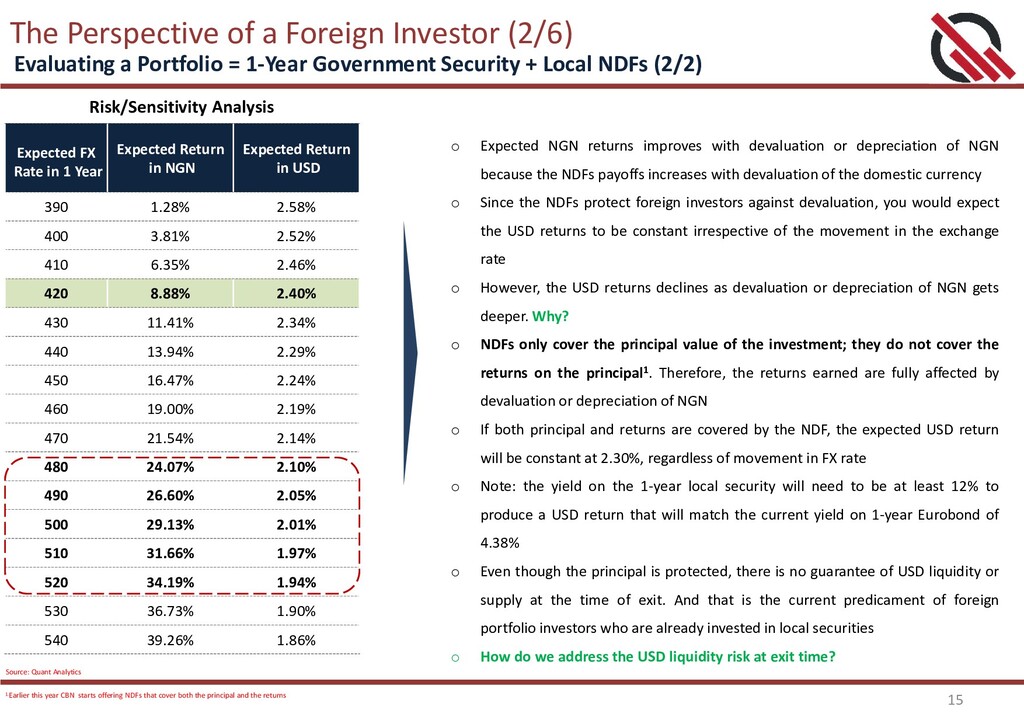
Portfolio = 1-Year Government Security + Local NDFs (2/2) Risk/Sensitivity Analysis Expected FX Rate in 1 Year Expected Return in NGN Expected Return in USD 390 1.28% 2.58% 400 3.81% 2.52% 410 6.35% 2.46% 420 8.88% 2.40% 430 11.41% 2.34% 440 13.94% 2.29% 450 16.47% 2.24% 460 19.00% 2.19% 470 21.54% 2.14% 480 24.07% 2.10% 490 26.60% 2.05% 500 29.13% 2.01% 510 31.66% 1.97% 520 34.19% 1.94% 530 36.73% 1.90% 540 39.26% 1.86% Source: Quant Analytics o Expected NGN returns improves with devaluation or depreciation of NGN because the NDFs payoffs increases with devaluation of the domestic currency o Since the NDFs protect foreign investors against devaluation, you would expect the USD returns to be constant irrespective of the movement in the exchange rate o However, the USD returns declines as devaluation or depreciation of NGN gets deeper. Why? o NDFs only cover the principal value of the investment; they do not cover the returns on the principal1. Therefore, the returns earned are fully affected by devaluation or depreciation of NGN o If both principal and returns are covered by the NDF, the expected USD return will be constant at 2.30%, regardless of movement in FX rate o Note: the yield on the 1-year local security will need to be at least 12% to produce a USD return that will match the current yield on 1-year Eurobond of 4.38% o Even though the principal is protected, there is no guarantee of USD liquidity or supply at the time of exit. And that is the current predicament of foreign portfolio investors who are already invested in local securities o How do we address the USD liquidity risk at exit time? 1.Earlier this year CBN starts offering NDFs that cover both the principal and the returns
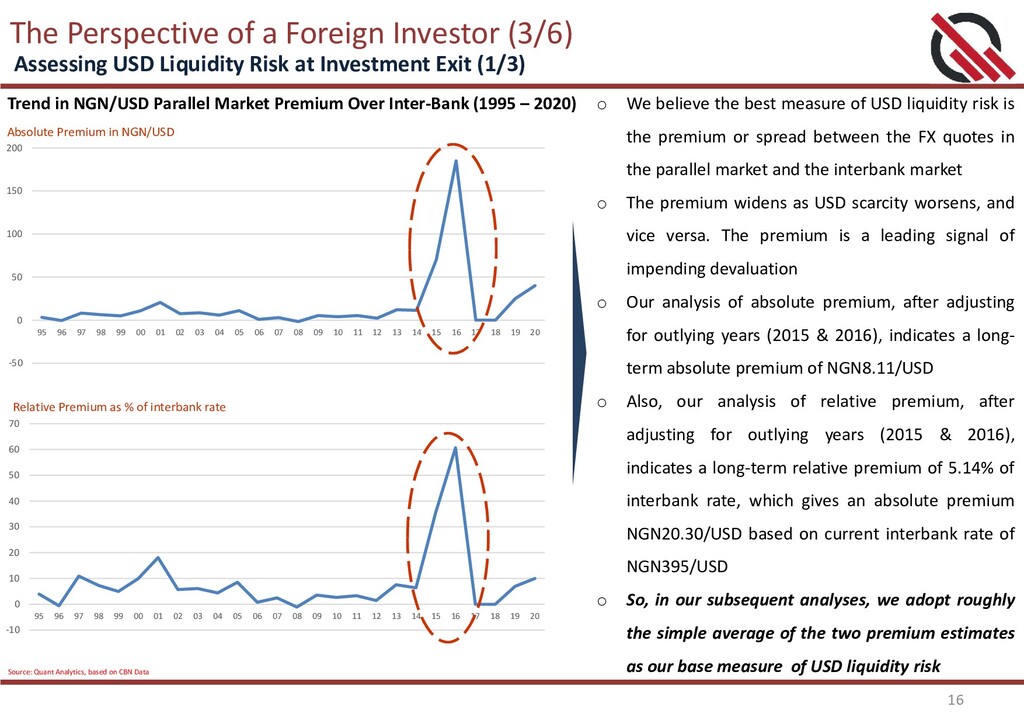
Liquidity Risk at Investment Exit (1/3) Trend in NGN/USD Parallel Market Premium Over Inter-Bank (1995 – 2020) o We believe the best measure of USD liquidity risk is the premium or spread between the FX quotes in the parallel market and the interbank market o The premium widens as USD scarcity worsens, and vice versa. The premium is a leading signal of impending devaluation o Our analysis of absolute premium, after adjusting for outlying years (2015 & 2016), indicates a long- term absolute premium of NGN8.11/USD o Also, our analysis of relative premium, after adjusting for outlying years (2015 & 2016), indicates a long-term relative premium of 5.14% of interbank rate, which gives an absolute premium NGN20.30/USD based on current interbank rate of NGN395/USD o So, in our subsequent analyses, we adopt roughly the simple average of the two premium estimates as our base measure of USD liquidity risk -50 0 50 100 150 200 95 96 97 98 99 00 01 02 03 04 05 06 07 08 09 10 11 12 13 14 15 16 17 18 19 20 Absolute Premium in NGN/USD Source: Quant Analytics, based on CBN Data -10 0 10 20 30 40 50 60 70 95 96 97 98 99 00 01 02 03 04 05 06 07 08 09 10 11 12 13 14 15 16 17 18 19 20 Relative Premium as % of interbank rate
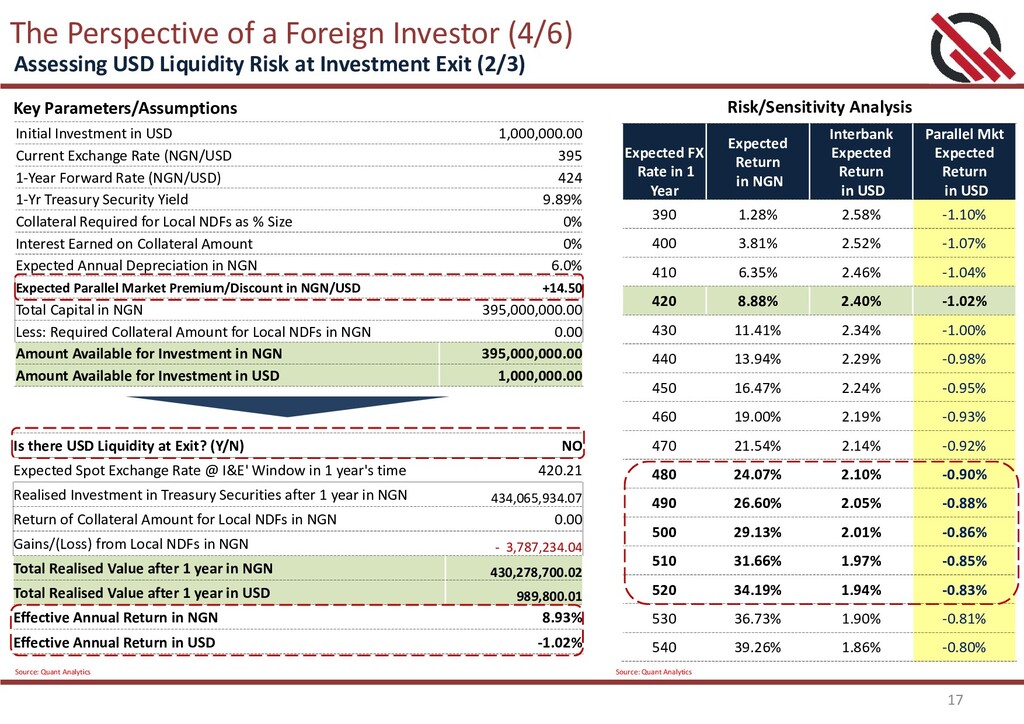
Assessing USD Liquidity Risk at Investment Exit (2/3) Risk/Sensitivity Analysis Initial Investment in USD 1,000,000.00 Current Exchange Rate (NGN/USD 395 1-Year Forward Rate (NGN/USD) 424 1-Yr Treasury Security Yield 9.89% Collateral Required for Local NDFs as % Size 0% Interest Earned on Collateral Amount 0% Expected Annual Depreciation in NGN 6.0% Expected Parallel Market Premium/Discount in NGN/USD +14.50 Total Capital in NGN 395,000,000.00 Less: Required Collateral Amount for Local NDFs in NGN 0.00 Amount Available for Investment in NGN 395,000,000.00 Amount Available for Investment in USD 1,000,000.00 Is there USD Liquidity at Exit? (Y/N) NO Expected Spot Exchange Rate @ I&E' Window in 1 year's time 420.21 Realised Investment in Treasury Securities after 1 year in NGN 434,065,934.07 Return of Collateral Amount for Local NDFs in NGN 0.00 Gains/(Loss) from Local NDFs in NGN - 3,787,234.04 Total Realised Value after 1 year in NGN 430,278,700.02 Total Realised Value after 1 year in USD 989,800.01 Effective Annual Return in NGN 8.93% Effective Annual Return in USD -1.02% Expected FX Rate in 1 Year Expected Return in NGN Interbank Expected Return in USD Parallel Mkt Expected Return in USD 390 1.28% 2.58% -1.10% 400 3.81% 2.52% -1.07% 410 6.35% 2.46% -1.04% 420 8.88% 2.40% -1.02% 430 11.41% 2.34% -1.00% 440 13.94% 2.29% -0.98% 450 16.47% 2.24% -0.95% 460 19.00% 2.19% -0.93% 470 21.54% 2.14% -0.92% 480 24.07% 2.10% -0.90% 490 26.60% 2.05% -0.88% 500 29.13% 2.01% -0.86% 510 31.66% 1.97% -0.85% 520 34.19% 1.94% -0.83% 530 36.73% 1.90% -0.81% 540 39.26% 1.86% -0.80% Source: Quant Analytics Source: Quant Analytics
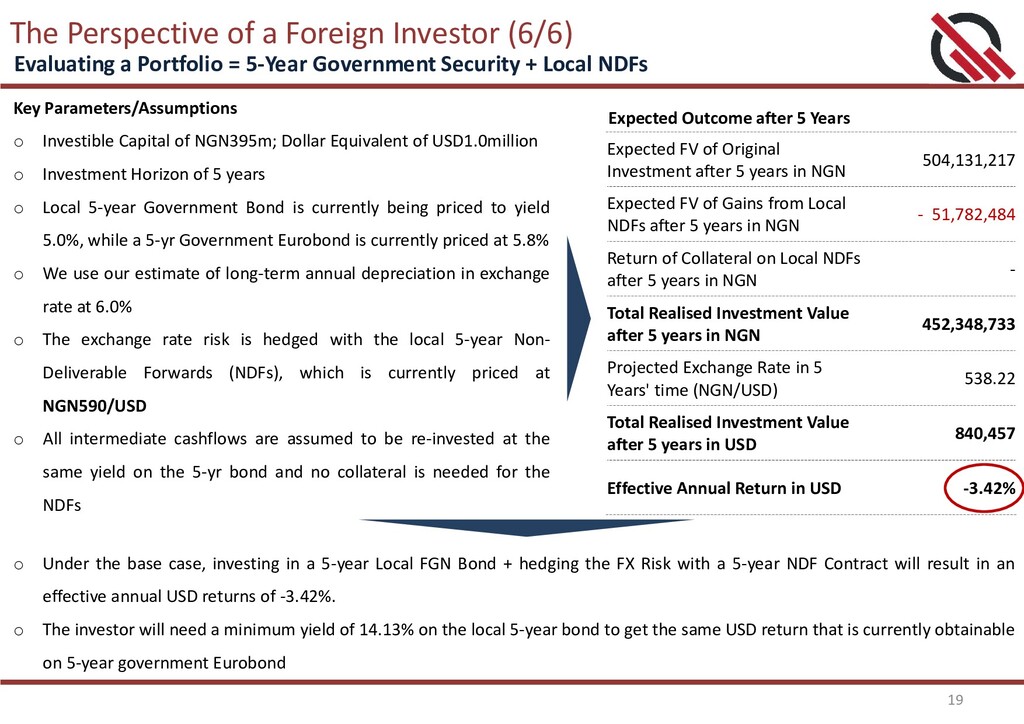
o Investible Capital of NGN395m; Dollar Equivalent of USD1.0million o Investment Horizon of 5 years o Local 5-year Government Bond is currently being priced to yield 5.0%, while a 5-yr Government Eurobond is currently priced at 5.8% o We use our estimate of long-term annual depreciation in exchange rate at 6.0% o The exchange rate risk is hedged with the local 5-year Non- Deliverable Forwards (NDFs), which is currently priced at NGN590/USD o All intermediate cashflows are assumed to be re-invested at the same yield on the 5-yr bond and no collateral is needed for the NDFs Expected Outcome after 5 Years Expected FV of Original Investment after 5 years in NGN 504,131,217 Expected FV of Gains from Local NDFs after 5 years in NGN - 51,782,484 Return of Collateral on Local NDFs after 5 years in NGN - Total Realised Investment Value after 5 years in NGN 452,348,733 Projected Exchange Rate in 5 Years' time (NGN/USD) 538.22 Total Realised Investment Value after 5 years in USD 840,457 Effective Annual Return in USD -3.42% o Under the base case, investing in a 5-year Local FGN Bond + hedging the FX Risk with a 5-year NDF Contract will result in an effective annual USD returns of -3.42%. o The investor will need a minimum yield of 14.13% on the local 5-year bond to get the same USD return that is currently obtainable on 5-year government Eurobond Evaluating a Portfolio = 5-Year Government Security + Local NDFs
Is your Exposure to Devaluation Risk III. Portfolio Approaches to Hedging Devaluation Risk IV. Available Hedging Instruments/Options V. The Perspective of a Foreign Investor VI. Summary
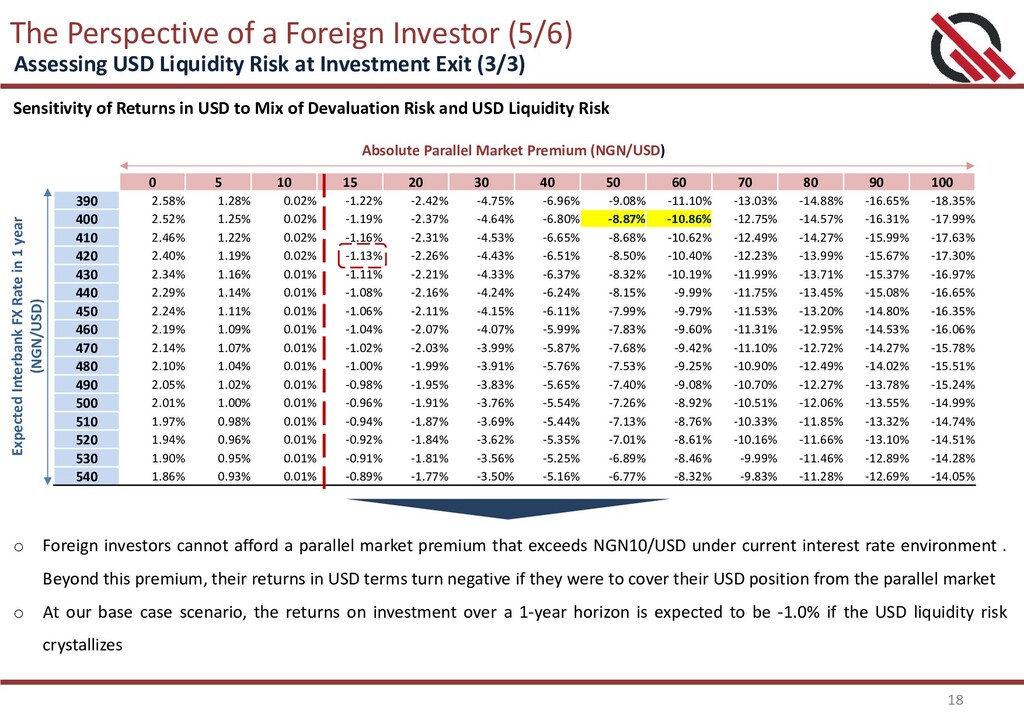
varying degrees. And it is almost certain that another major devaluation will occur within 5 years of a major devaluation. 2. Without a major positive structural change in the economy, the domestic currency is expected to depreciate at an average annual rate of c.6.0% over time 3. Strategic + Tactical Allocation Approach is recommended for planning how to manage devaluation risk as it considers the long-term nature of the investors’ exposure to devaluation risk as well as offers flexibility to allocate more capital to hedging assets should the need arises 4. The ideal instrument for hedging devaluation within a strategic allocation should be a USD-denominated asset that is not positively correlated with the factors that cause devaluation, especially if there may be need for cash withdrawal when devaluation occurs. However, within tactical allocation, there is variety of instruments available to hedge devaluation provided the timing of the tactical adjustment is spot on 5. It will be difficult for the risk of devaluation to subside under the current market conditions: o Yields on local securities are unattractive given that domestic investors have the option of investing in FGN Eurobonds. The local securities will need to offer at least 600bps premium over the yields on Eurobonds to lure investors to switch from Eurobonds to local securities o Foreign investors now realise that they underestimated the risk of USD liquidity in Nigeria. Even if the central bank raises the domestic interest rates, it is unlikely that the foreign investors will respond strongly in short term o Even without pricing in USD liquidity risk, the expected USD return on local short and long term securities pale in comparison to what is obtainable on equivalent Eurobonds. Local short and long-term securities will need to be repriced to yield at least 12% and 14% respectively to be competitive and provide reasonable cover against devaluation