Upgrade to Pro — share decks privately, control downloads, hide ads and more …

Making Work Visible To expose risks, address dependencies, & examine priorities

Making Work Visible To expose risks, address dependencies, & examine priorities

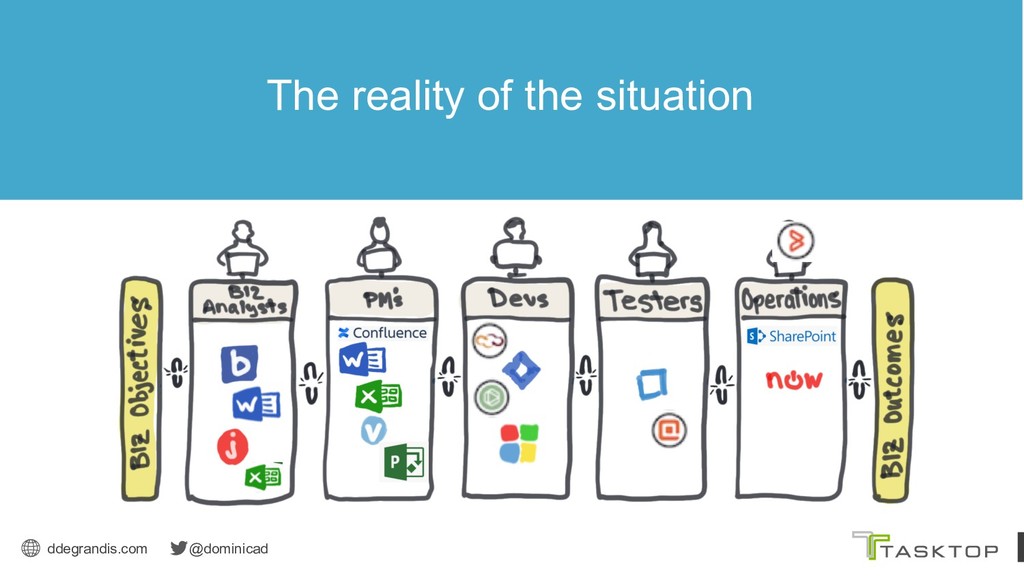
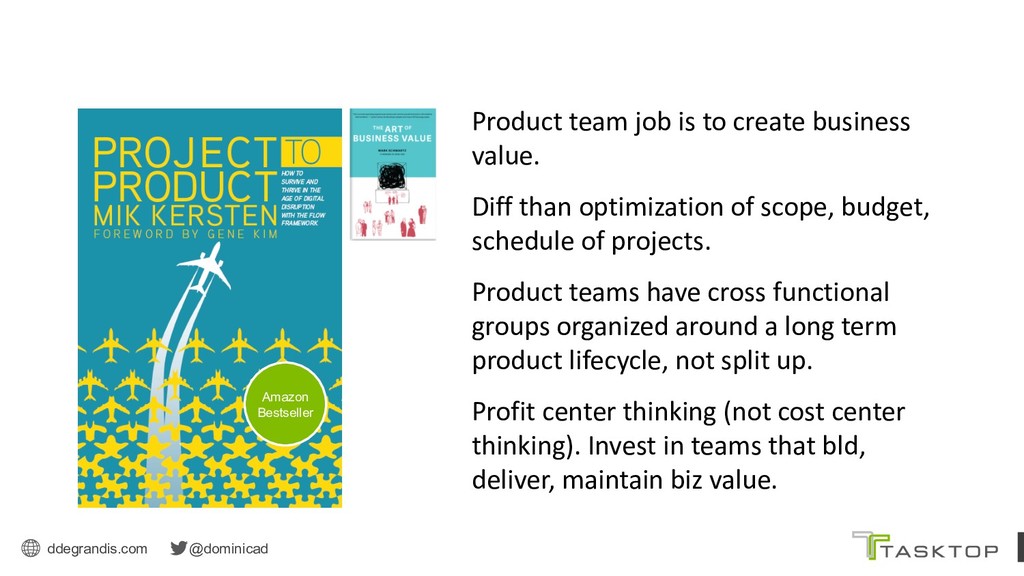
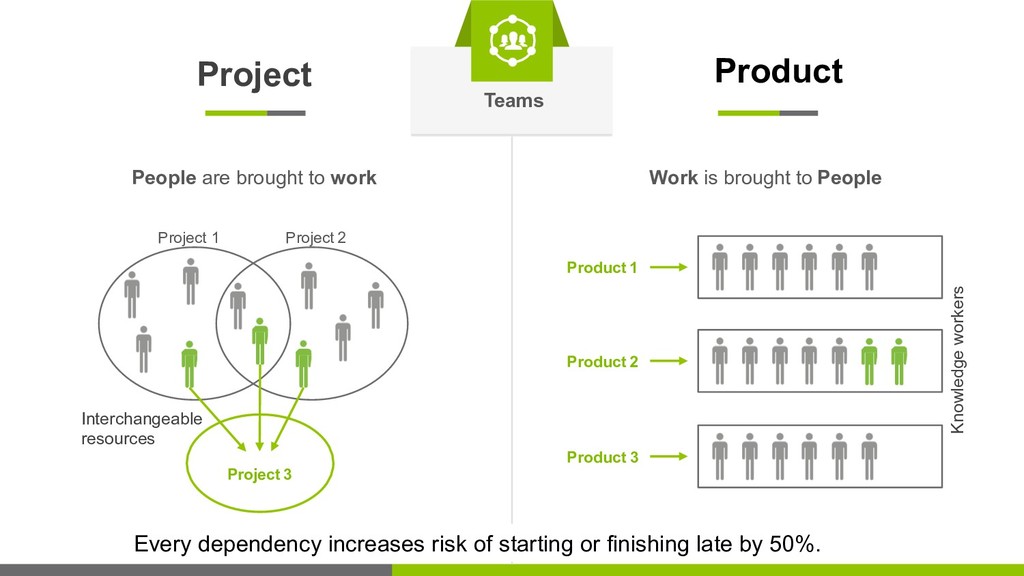
This talk explores the benefits of managing products through the lens of a value stream to better expose risks, examine priorities and reduce dependencies. We’ll look briefly at the project to product movement, the skills and knowledge needed to optimize workflow, and the metrics useful to see tradeoffs and measure biz outcomes.

Dominica DeGrandis

November 13, 2019
Tweet

More Decks by Dominica DeGrandis

Other Decks in Technology

Transcript

  1. ddegrandis.com @dominicad Dominica DeGrandis Principal Flow Advisor Making Work Visible

    To expose risks, address dependencies, & examine priorities
  2. ddegrandis.com @dominicad Dominica DeGrandis @dominicad Principal Flow Advisor @ Tasktop

    Technologies Author of Making Work Visible: Exposing Time Theft to Optimize Work & Flow
  3. ddegrandis.com @dominicad Making work visible to expose time theft -

    Managing work by product (vs. project) - Skills matrix heatmap to help teams level-up - Making tradeoffs visible to improve decisions Topics
  4. ddegrandis.com @dominicad 3 THINGS CUSTOMERS GRUMBLE ABOUT Value Stream: all

    activities done to plan, design, build & deliver items that provides biz value • Things takes too long • The progress of work is invisible • Key info lost during handoffs 10/17
  5. ddegrandis.com @dominicad Dominica DeGrandis The 5Thieves of Time Unplanned work

    Conflicting Priorities Unknown Dependencies Neglected work Too Much WIP
  6. ddegrandis.com @dominicad Dominica DeGrandis Too much WIP comes from too

    much Yes Thief Too much Work-in-progress (WIP) THIEF TOO MUCH WORK IN PROGRESS (WIP)
  7. ddegrandis.com @dominicad STOP Starting, START Finishing Constrain how much work

    gets started to create focus on finishing what’s already in play. This constraint is also the key to forcing problems to the surface so they can be addressed.
  8. ddegrandis.com @dominicad WIP is a leading indicator At 100% capacity

    you have minimal throughput High WIP means that other items sit waiting for service longer. The single most important factor that affects queue size is capacity utilization.
  9. ddegrandis.com @dominicad Dominica DeGrandis Thief Too much Work-in-progress (WIP) Queuing

    Theory allows us to quantify the relationship between wait times and capacity utilization. Wait times increase exponentially as utilization approaches 100%. Queuing Theory: Applied statistics that studies waiting lines If the goal is speed, consider managing work by queues. http://reinertsenassociates.com/books/
  10. ddegrandis.com @dominicad Thief Conflicting Priorities Reduce WIP: Implement WIP limits

    • Visualize WIP • WIP limit as enabling constraint • Primary factor of speed is the amount of WIP
  11. ddegrandis.com @dominicad Flow Load – a measure to balance demand

    & capacity Flow Load (WIP) • Leading indicator • Primary factor of speed metrics
  12. ddegrandis.com @dominicad Flow Time – a measure of speed Yes,

    let’s do this! Flow Time: The duration from when work enters the value stream to its completion. Little’s Law LT = WIP/TP (avg)
  13. ddegrandis.com @dominicad Image taken with permission from Jon Smart presentation

    at DOES London 2018 – credit Klaus Leopold Barclays’ Value Stream
  14. ddegrandis.com @dominicad Where is my feature delivery bottleneck? Too few

    designers caused wait states on upstream UX work
  15. ddegrandis.com @dominicad Dominica DeGrandis Unplanned Work: Interruptions that prevent you

    from finishing something or from stopping at a better breaking point. Unplanned Work is a time thief b/c unplanned work usurps planned work THIEF UNKNOWN DEPENDENCIES Teams rarely work in isolation. The larger the org, the more teams, the higher probability of unknown dependencies. The hardest thing we do is communicate across teams.
  16. ddegrandis.com @dominicad “Things take too long” is a universal problem

    work request Disconnects in communication interferes with collaboration & delays delivery
  17. ddegrandis.com @dominicad consolidation, replication, and strangle approach. epics Reqs spreadsheets

    features stories defects test cases incidents problems vulnerabilities rfc’s gantt charts ryg rpts time sheets Tool fights break out due to inability to share knowledge, understand work capacity and improve workflow.
  18. ddegrandis.com @dominicad Platform Products Internal Customer Value Stream Network Developers

    & Specialists Business Products External Customer Project to Product: Architecture There cannot be a more important thing for an engineer than to work on the systems that drive our productivity -- Satya Nadela
  19. ddegrandis.com @dominicad Value Stream Architect An op&mizer – Studies bo3lenecks.

    Knowledgeable in the Theory of Constraints An influencer - They add work items to product backlogs and will need support across the organiza&on to drive change across each part of the value stream: Part consultant - consult with product mgrs/owners to drive higher level decisions about workflow tooling. ↕ Value Stream Architect
  20. Skills Matrix Heatmap: Do you have the right team? [self-rate]

    Skill / Knowledge P1 P2 P3 P4 P5 P6 Describe the desired business results for the value stream 2 1 0 1 2 2 Identify the product value stream’s customers & pain points 1 1 3 1 3 2 Locate the work process and workflow within and across tools from from intake to delivery 3 2 0 1 0 1 Find artifacts in the toolset that can be identified as revenue generation and revenue protection, 2 2 1 0 1 0 Map out the artifact states, and recognize active work states vs. waiting states 3 0 2 1 1 0 Locate where the PVS’s work items are in the various tools used by the product value stream 4 2 1 1 2 0 Identify dependencies on teams/practitioners upstream and downstream of their own functional area 1 1 0 0 0 2 Design experiments that improve efficiency and velocity, and be willing to present/share results with others 3 2 0 1 1 2 ♠ 0 – Student, 1 – fly w/ Instructor, 2 - Fly solo, 3 - Instructor, 4 - Blue Angel Person 1, 2, 3…
  21. ddegrandis.com @dominicad 55% GARTNER CIO SURVEY 2019 of IT organizations

    are moving from project to product Source: CIO.com, Making the shift to product-based IT, January 2019
  22. ddegrandis.com @dominicad Product team job is to create business value.

    Diff than optimization of scope, budget, schedule of projects. Product teams have cross functional groups organized around a long term product lifecycle, not split up. Profit center thinking (not cost center thinking). Invest in teams that bld, deliver, maintain biz value. Amazon Bestseller
  23. ddegrandis.com @dominicad Managing by product reduces dependencies Projects teams form

    & disband - knowledge remains w/ diff team. Product teams have more longevity, stability, and knowledge lives with same team.
  24. ddegrandis.com @dominicad A decision to do one thing is a

    decision to delay something else. THIEF CONFLICTING PRIORITIES
  25. ddegrandis.com @dominicad Teams Project Product Project 1 Project 2 Project

    3 Product 1 Product 2 Product 3 People are brought to work Work is brought to People Every dependency increases risk of starting or finishing late by 50%. Interchangeable resources Knowledge workers
  26. ddegrandis.com @dominicad PMO to VMO “To transition from scope based

    outcomes to value based outcomes, it makes sense that the PMO transition to effectively help optimize business outcomes at a program level.” ~ Kristen Biddulph Program Management Office to Value Management Office Shift gears to product thinking at the program level. Making Work Product-Centric: https://www.youtube.com/watch?v=02Pgyy-HOHQ
  27. ddegrandis.com @dominicad 5 Flow Metrics - focused on business outcomes

    • Flow Load – amount of Work-in-Progress (WIP) • Flow Time – a measure of speed • Flow Distribution – work-item type allocation • Flow Efficiency – work vs. wait ratio • Flow Velocity – a measure of throughput
  28. ddegrandis.com @dominicad Flow Load – a measure to balance demand

    & capacity Too much WIP limits ability to proactively prepare.
  29. ddegrandis.com @dominicad Look at Flow time date Unplanned work delays

    Planned work Flow Time – a measure of speed THIEF UNPLANNED WORK
  30. ddegrandis.com @dominicad Flow Distribution allocation (3) (1) (5) (5) WIP

    limit Context influences strategy If just deployed a big release, may want to allocate more capacity to fix risks & defects. If you continue to do more feature work, you can’t expect it won’t take away from doing risk work.
  31. ddegrandis.com @dominicad Flow Efficiency: The percentage of time where work

    is in an active state vs. a wait state. Why Flow Efficiency - Expose wait time Benefit: Learn how much wait time exists in Value Stream to drive discussion to improve decisions on prioritization, capacity & utilization.
  32. ddegrandis.com @dominicad Make tradeoffs visible: If one metric improves, what

    is the impact to other metrics? Define early warning signs: What signals to look for to recognize when one metric is over- optimized? When is it time to prioritize other metrics?
  33. ddegrandis.com @dominicad A metric to gage safety Examples: • On

    my team, failure causes inquiry and not blame. • Our leadership is open to hearing bad news. • In my org, failures are learning opportunities and messengers are not punished. • People on our team trust one another @nicolefv https://www.youtube.com/watch?v=avauW5FAWCw promoters passives detractors Flow Safety: A measure of trust
  34. ddegrandis.com @dominicad • Product Management & profit center thinking provide

    an advantage. • Make work visible to expose time theft. • Make tradeoffs visible with Flow Distribution. • Experiment and observe. • Use skills matrix heatmap to help teams level-up. Takeaways
  35. ddegrandis.com @dominicad “The difference between successful people and very successful

    people is that very successful people say “no” to almost everything.” ~Warren Buffett https://www.goodreads.com/author/show/756.Warren_Buffett
  36. Email: [email protected] Subject: flow To receive: • copy of this

    presenta9on deck • Skills Matrix: Do you have the right team? • Full Stack Teams, Not Engineers • Flow 101 workshop info • Value Stream Canvas exercise • Tasktop tool integra9on video on ServiceNow & Jira • excerpts of Making Work Visible • Forrester report on Value Stream Mgmt
  37. ddegrandis.com @dominicad • Grab 3 post-it’s • List 3 ways

    to reduce WIP • Circle the WIP reducing strategy you’d like to experiment with. • Partner or trio up with people from your table to discuss strategies for how to balance WIP. Exercise 1: WIP reducing strategies & experiment Time: 15 min
  38. ddegrandis.com @dominicad Team “Low engagement, Key people leaving” Experiments need

    three things: 1. Goal (Hypothesis) 2. Activities (What to try) 3. Metrics (How will we recognize success or failure?)
  39. ddegrandis.com @dominicad Scenario: Low team engagement level Team members highly

    utilized Key people are leaving Question for the table: What changes and trends in which flow metrics would you expect to see given the above scenario? Exercise: Flow Metrics Discussion Time: 15 min
  40. ddegrandis.com @dominicad Team “Low engagement, Key people leaving” Experiments need

    three things: 1. Goal (Hypothesis) 2. Activities (What to try) 3. Metrics (How will we recognize success or failure?)
  41. ddegrandis.com @dominicad Team “Low engagement, Key people leaving” Things to

    consider: • Things take too long – Flow 5me • People drowning in work - Flow Load • No investment in fixing Debt - Flow Distribu5on • What about trust? Consider “Flow Safety” Flow Metrics for Scenario
  42. ddegrandis.com @dominicad Team “Low engagement, Key people leaving” When we

    offer to solve ppl’s prob, they begin to trust us - see value we can provide.