Upgrade to Pro — share decks privately, control downloads, hide ads and more …

Making Better Business Decisions with Flow Metrics

Making Better Business Decisions with Flow Metrics

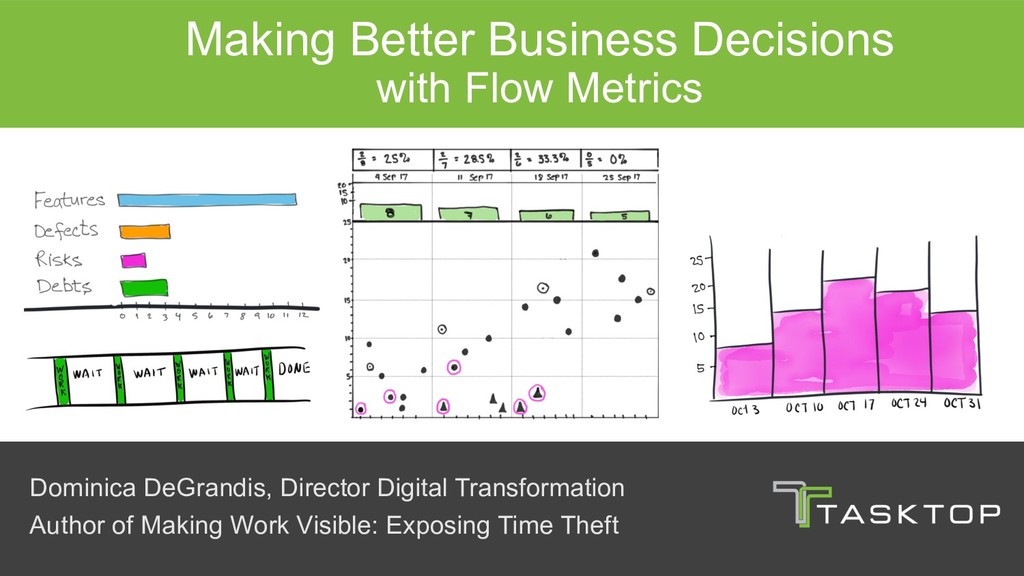
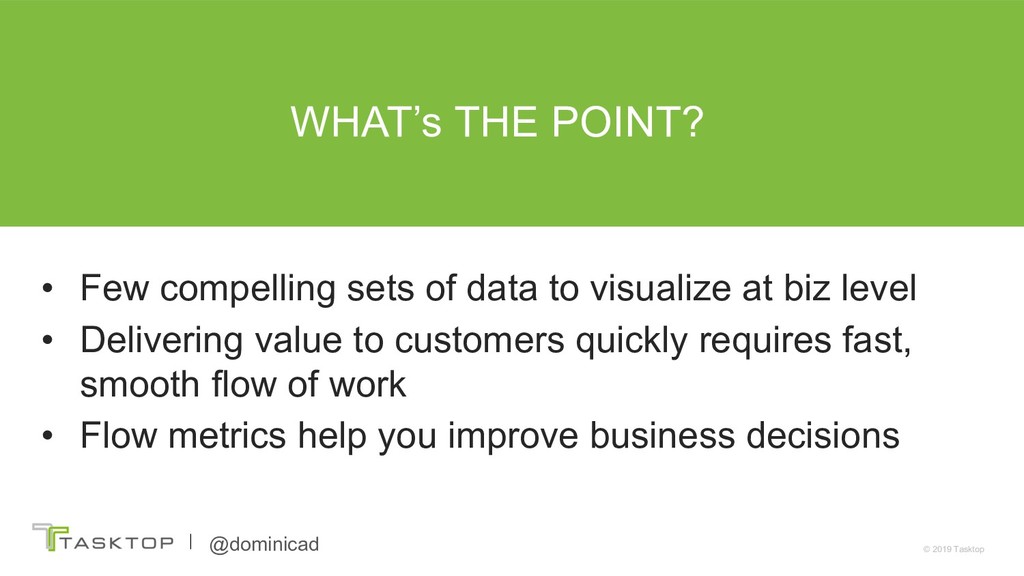
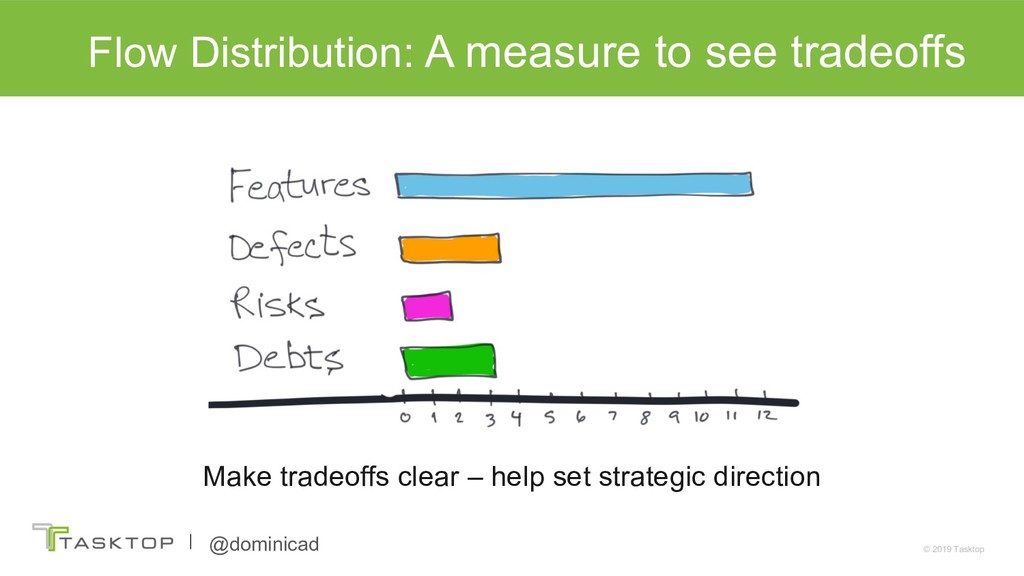
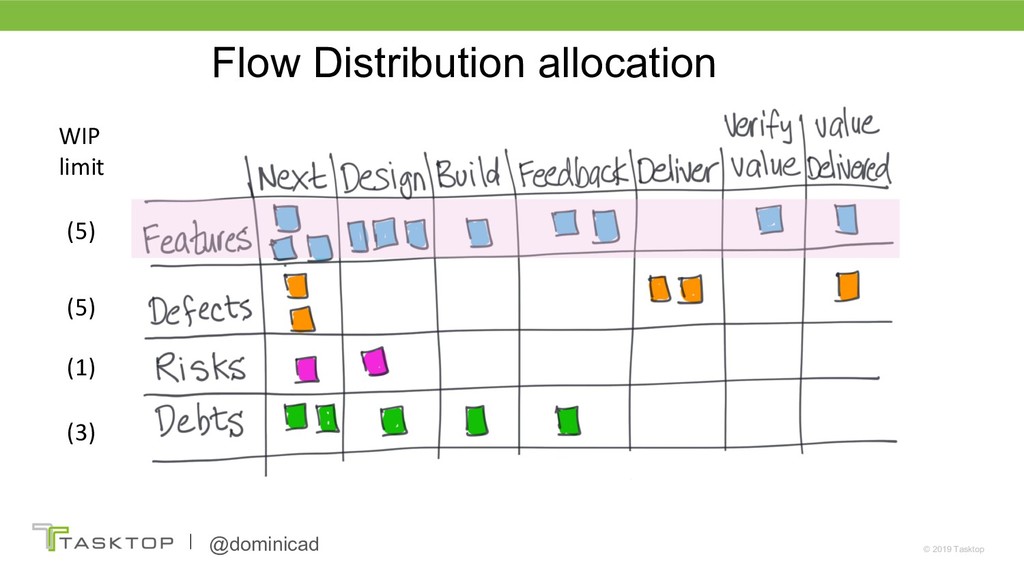
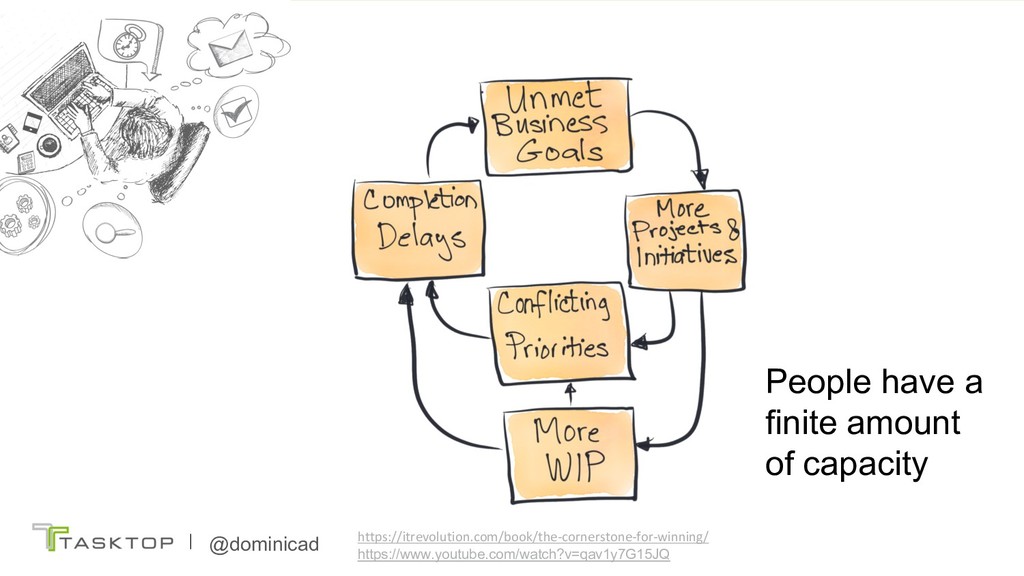
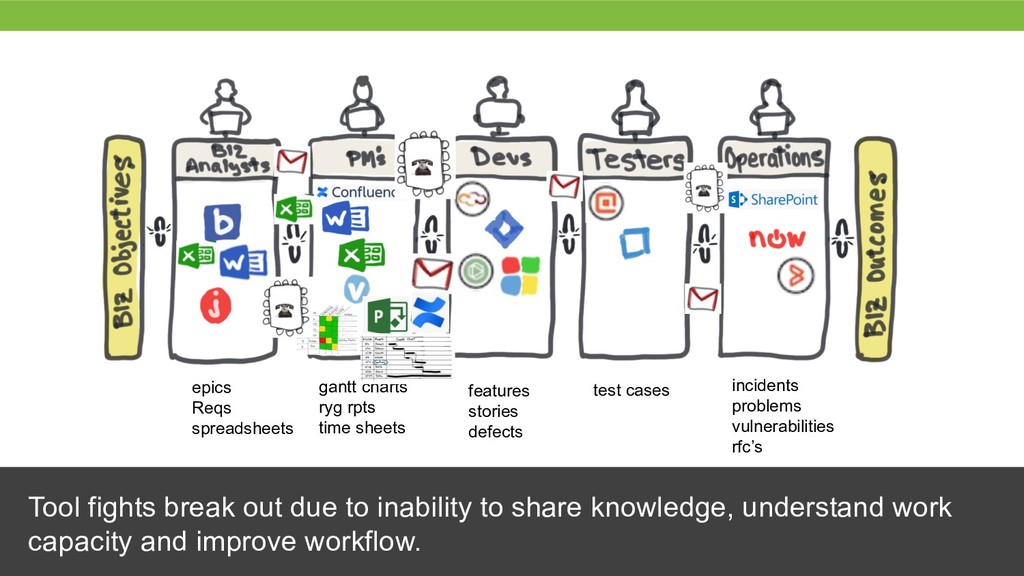
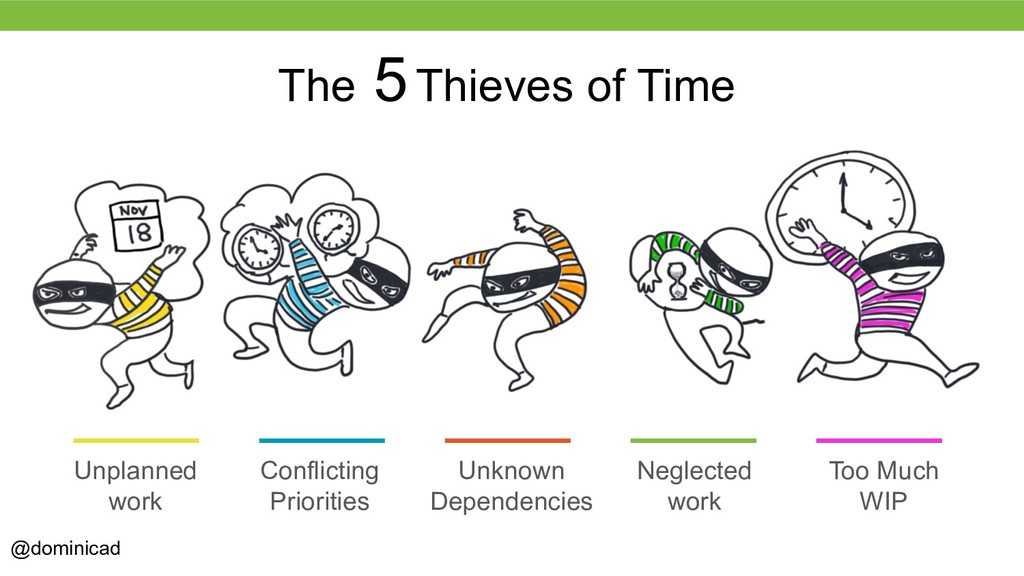
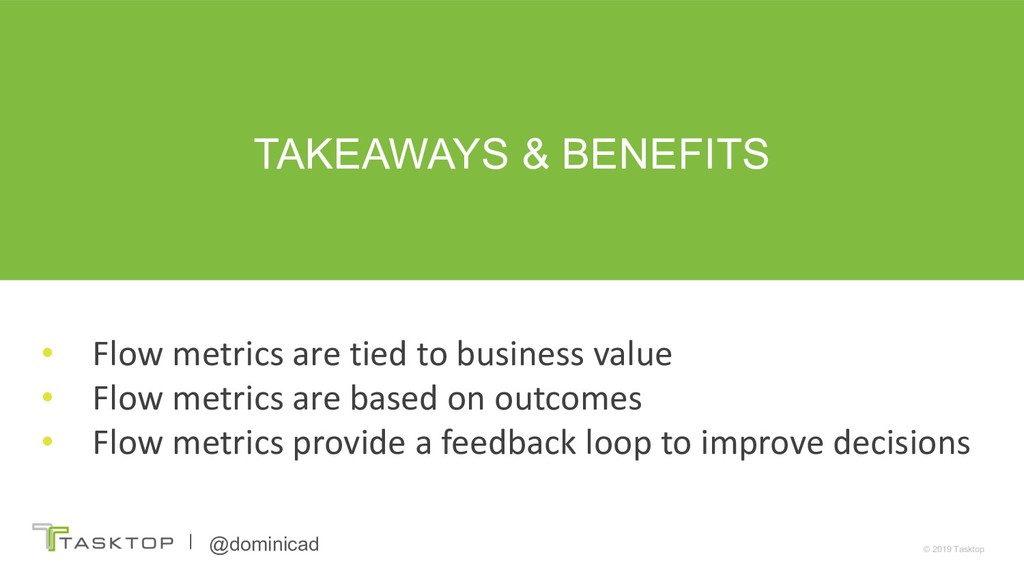
When it comes to assessing an IT transformations (such as Agile and DevOps), performance metrics have come under intense scrutiny. Traditional performance metrics, such as counting the number of lines of code or the number of software bugs should be used with caution, because there are bugs that are not worth fixing and code that is not worth maintaining. Output based performance metrics represent activities, not outcomes. To visualize and optimize the business value of your software delivery, it's helpful to measure business outcomes, versus measure how busy people are. Flow metrics help us do just that.
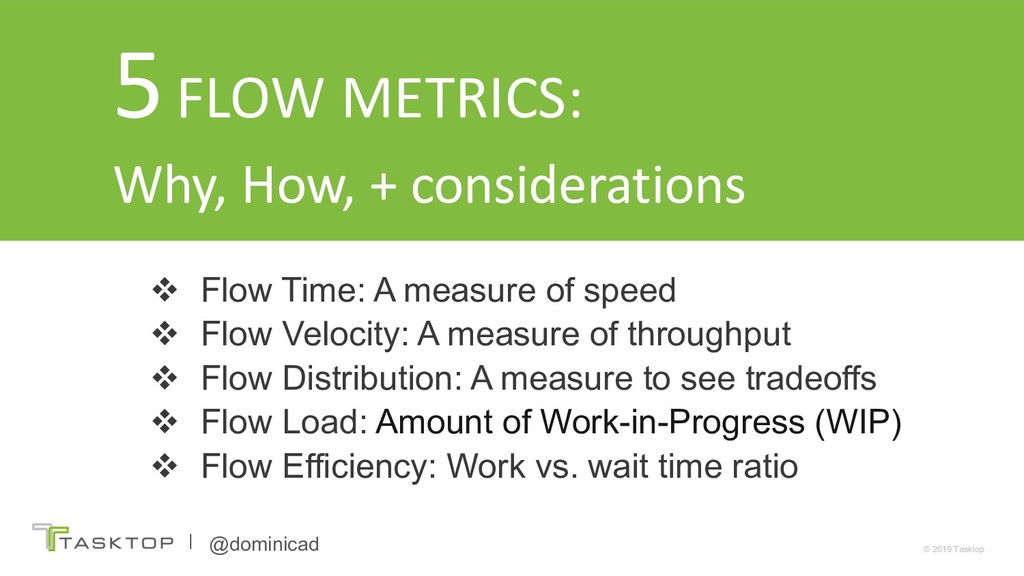
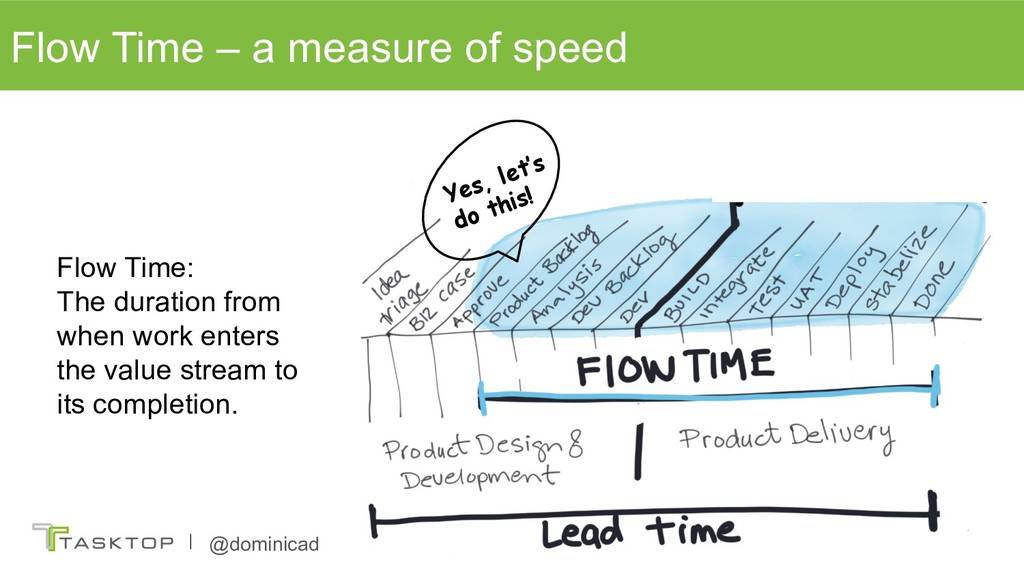
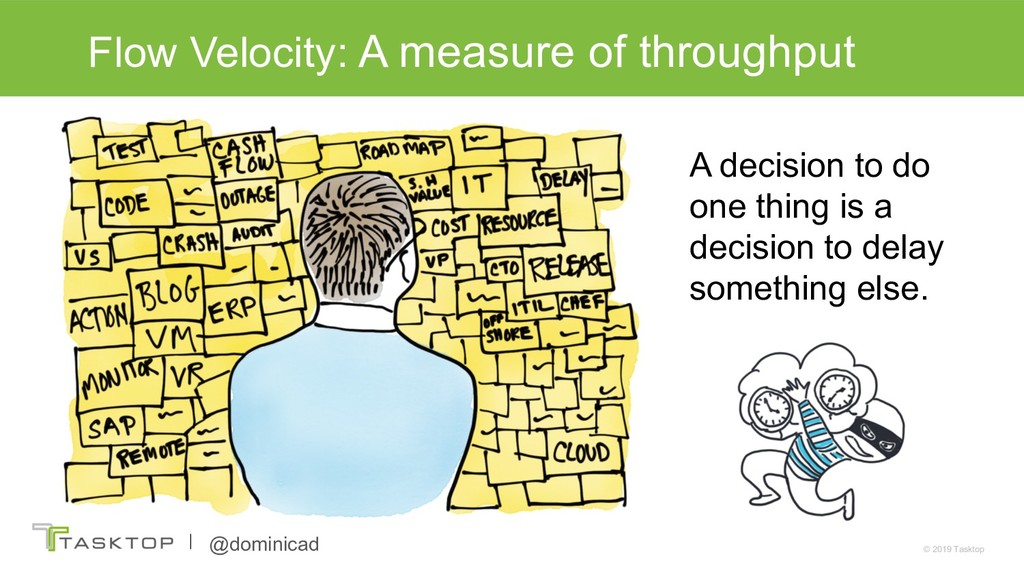
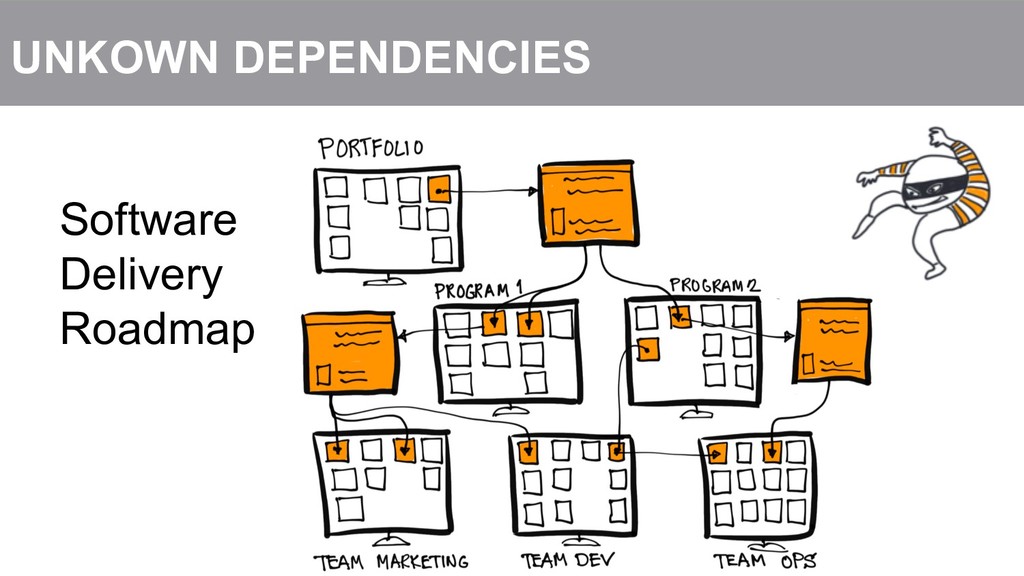
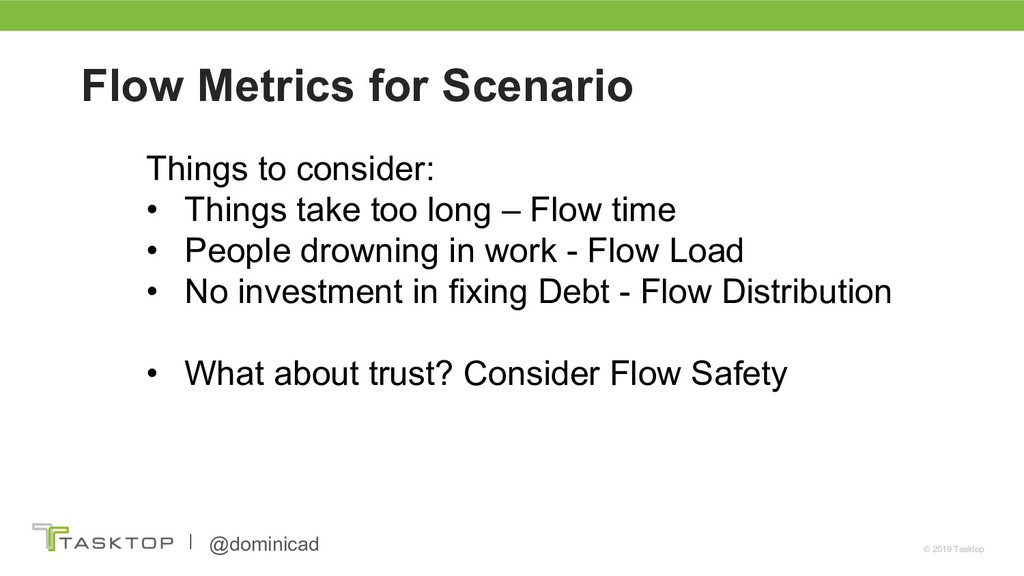
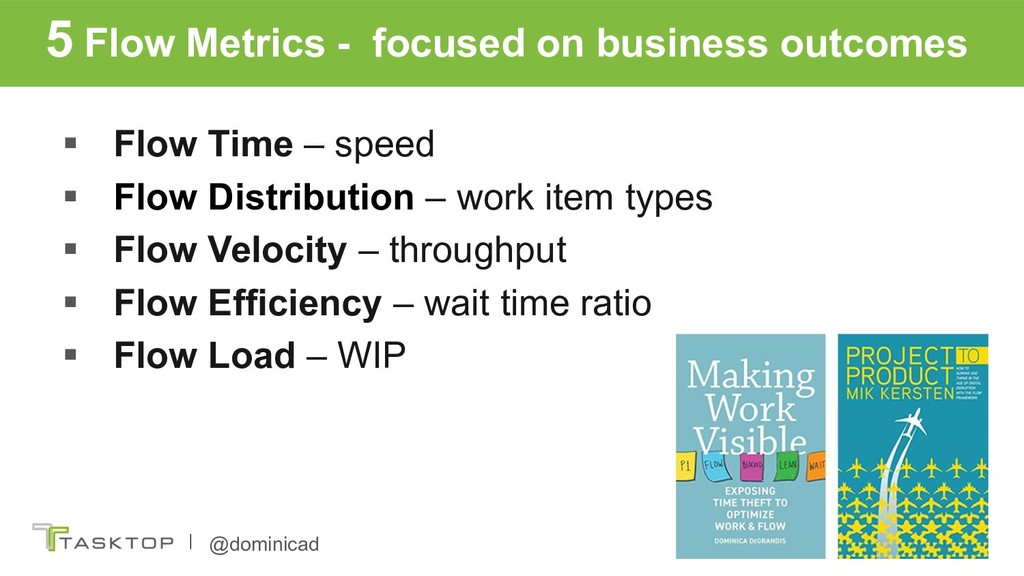
Dominica DeGrandis presents five flow metrics that reveal trends on desirable business outcomes – such as faster time-to-market, responsiveness to customers, and predictable release timeframes. The goal is to inspire you to experiment with flow metrics at your organization to help you become the voice of reason in your organization

Dominica DeGrandis

August 06, 2019
Tweet

More Decks by Dominica DeGrandis

Other Decks in Technology

Transcript

  1. © 2019 Tasktop @dominicad Making Better Business Decisions with Flow

    Metrics Dominica DeGrandis, Director Digital Transformation Author of Making Work Visible: Exposing Time Theft
  2. © 2019 Tasktop @dominicad • Few compelling sets of data

    to visualize at biz level • Delivering value to customers quickly requires fast, smooth flow of work • Flow metrics help you improve business decisions WHAT’s THE POINT?
  3. © 2019 Tasktop @dominicad Image taken with permission from Jon

    Smart presentation at DOES London 2018 – credit Klaus Leopold Barclays’ Value Stream
  4. © 2019 Tasktop @dominicad v Flow Time: A measure of

    speed v Flow Velocity: A measure of throughput v Flow Distribution: A measure to see tradeoffs v Flow Load: Amount of Work-in-Progress (WIP) v Flow Efficiency: Work vs. wait time ratio 5FLOW METRICS: Why, How, + considerations
  5. © 2019 Tasktop @dominicad Make tradeoffs clear – help set

    strategic direction Flow Distribution: A measure to see tradeoffs
  6. © 2019 Tasktop @dominicad Dominica DeGrandis Thief Neglected Work Neglected

    Work is partially completed work that gets postponed. It’s work that sits idle on the bench waiting for attention. Neglected work is a time thief b/c it either gets in the way of higher value work or it delays the delivery of important work. NEGLECTED WORK
  7. © 2019 Tasktop @dominicad Flow Metrics Exercise Materials: 1. Flow

    Metrics Data sheet 2. Flow Distribution Chart Flow Metrics Exercise Data Work Item Types Day Done Day Approved Flow time (#days) 1 feature 9-Sep-18 3-Sep-18 6 2 tech debt 9-Sep-18 29-Aug-18 11 3 feature 9-Sep-18 27-Aug-18 13 4 defect 10-Sep-18 1-Sep-18 9 5 feature 10-Sep-18 4-Sep-18 6 6 feature 11-Sep-18 6-Sep-18 5 7 defect 11-Sep-18 5-Sep-18 6 8 defect 11-Sep-18 3-Sep-18 8 9 tech debt 12-Sep-18 30-Aug-18 13 10 risk 12-Sep-18 10-Sep-18 2 11 feature 12-Sep-18 6-Sep-18 6 12 feature 13-Sep-18 5-Sep-18 8 13 defect 15-Sep-18 5-Sep-18 10 14 risk 15-Sep-18 13-Sep-18 2 15 risk 16-Sep-18 15-Sep-18 1 16 risk 18-Sep-18 18-Sep-18 0 17 tech debt 20-Sep-18 8-Sep-18 12 18 feature 19-Sep-18 6-Sep-18 13 19 risk 20-Sep-18 18-Sep-18 2 20 feature 22-Sep-18 11-Sep-18 11 21 feature 21-Sep-18 9-Sep-18 12 22 feature 21-Sep-18 10-Sep-18 11 23 feature 22-Sep-18 8-Sep-18 14 24 feature 22-Sep-18 8-Sep-18 14 25 feature 23-Sep-18 10-Sep-18 13 26 tech debt 23-Sep-18 10-Sep-18 13 To view a copy of this license, visit http://creativecommons.org/licenses/by-sa/4.0/ Dominica DeGrandis www.ddegrandis.com This work is licensed under the Creative Commons Attribution-ShareAlike 4.0 Time: 5 min
  8. © 2019 Tasktop @dominicad Flow Distribution Chart Instructions: For each

    day, calculate and draw one vertical bar showing the distribution of work item types. Use the same color marker as the color of the work items. Ex: If one Feature work item and one Defect work item were delivered on Day 9, then 50% of the vertical bar for Day 9 would be blue (feature) and 50% would be orange (defect). Flow Distribution Chart Feature Defect Tech Debt Risk 9 10 11 12 13 14 15 16 17 18 19 Day work items Completed Percentage of work item types delivered 100% 90% 80% 70% 60% 50% 40% 30% 20% 10% If no colored markers, then be creative with shading: stripes, dots, diagonal lines, etc… Flow Metrics Exercise Split Split into groups of 3: Time: 5 min
  9. © 2019 Tasktop @dominicad What story is told based on

    the outcomes shown in this chart?
  10. © 2019 Tasktop @dominicad Flow Time – a measure of

    speed Yes, let’s do this! Flow Time: The duration from when work enters the value stream to its completion.
  11. © 2019 Tasktop @dominicad Dominica DeGrandis Unplanned Work: Interruptions that

    prevent you from finishing something or from stopping at a better breaking point. Unplanned Work is a time thief b/c unplanned work usurps planned work UNPLANNED WORK Unplanned Work: • Delays planned work • Steals your predictability The enemy of getting work done is not you're lack of talent - it's being interrupted.
  12. © 2019 Tasktop @dominicad Look at Flow time date Unplanned

    work delays Planned work Measuring Flow Time
  13. © 2019 Tasktop @dominicad Flow Metrics Exercise Materials: 1. Flow

    Metrics Data sheet 2. Flow Time Chart Flow Metrics Exercise Data Work Item Types Day Done Day Approved Flow time (#days) 1 feature 9-Sep-18 3-Sep-18 6 2 tech debt 9-Sep-18 29-Aug-18 11 3 feature 9-Sep-18 27-Aug-18 13 4 defect 10-Sep-18 1-Sep-18 9 5 feature 10-Sep-18 4-Sep-18 6 6 feature 11-Sep-18 6-Sep-18 5 7 defect 11-Sep-18 5-Sep-18 6 8 defect 11-Sep-18 3-Sep-18 8 9 tech debt 12-Sep-18 30-Aug-18 13 10 risk 12-Sep-18 10-Sep-18 2 11 feature 12-Sep-18 6-Sep-18 6 12 feature 13-Sep-18 5-Sep-18 8 13 defect 15-Sep-18 5-Sep-18 10 14 risk 15-Sep-18 13-Sep-18 2 15 risk 16-Sep-18 15-Sep-18 1 16 risk 18-Sep-18 18-Sep-18 0 17 tech debt 20-Sep-18 8-Sep-18 12 18 feature 19-Sep-18 6-Sep-18 13 19 risk 20-Sep-18 18-Sep-18 2 20 feature 22-Sep-18 11-Sep-18 11 21 feature 21-Sep-18 9-Sep-18 12 22 feature 21-Sep-18 10-Sep-18 11 23 feature 22-Sep-18 8-Sep-18 14 24 feature 22-Sep-18 8-Sep-18 14 25 feature 23-Sep-18 10-Sep-18 13 26 tech debt 23-Sep-18 10-Sep-18 13 To view a copy of this license, visit http://creativecommons.org/licenses/by-sa/4.0/ Dominica DeGrandis www.ddegrandis.com This work is licensed under the Creative Commons Attribution-ShareAlike 4.0 Time: 5 min
  14. © 2019 Tasktop @dominicad Flow Time and Flow Velocity (Throughput)

    Chart Day 9 10 11 12 13 14 15 16 17 18 19 20 21 22 23 Day work completed # of days to complete work item 14 13 12 11 10 9 8 7 6 5 4 3 2 1 0 5 4 3 2 1 Histogram: # of completed items per day Feature Defect Tech Debt Risk Day 9 Day 10 Day 11 Day 12 Day 13 Day 14 Day 15 Day 16 17 18 19 Flow Time Chart Instructions: Plot 1 dot per completed work item, using the same color marker as the color of the work item. Do not connect the dots. Flow Velocity Chart Instructions: Draw one vertical bar per day (above the Flow Time chart) to create a histogram that shows the number of work items completed for each day. Complete just the “Flow Time Chart” Instructions. Save the “Flow Velocity Chart” portion for later. . Time: 5 min
  15. © 2019 Tasktop @dominicad What story is told based on

    the outcomes shown in this Flow time chart? Flow Time Outcomes
  16. © 2019 Tasktop @dominicad Flow Velocity: A measure of throughput

    A decision to do one thing is a decision to delay something else.
  17. © 2019 Tasktop @dominicad Flow Metrics Exercise Materials: 1. Flow

    Metrics Data sheet 2. Flow Velocity Chart Flow Metrics Exercise Data Work Item Types Day Done Day Approved Flow time (#days) 1 feature 9-Sep-18 3-Sep-18 6 2 tech debt 9-Sep-18 29-Aug-18 11 3 feature 9-Sep-18 27-Aug-18 13 4 defect 10-Sep-18 1-Sep-18 9 5 feature 10-Sep-18 4-Sep-18 6 6 feature 11-Sep-18 6-Sep-18 5 7 defect 11-Sep-18 5-Sep-18 6 8 defect 11-Sep-18 3-Sep-18 8 9 tech debt 12-Sep-18 30-Aug-18 13 10 risk 12-Sep-18 10-Sep-18 2 11 feature 12-Sep-18 6-Sep-18 6 12 feature 13-Sep-18 5-Sep-18 8 13 defect 15-Sep-18 5-Sep-18 10 14 risk 15-Sep-18 13-Sep-18 2 15 risk 16-Sep-18 15-Sep-18 1 16 risk 18-Sep-18 18-Sep-18 0 17 tech debt 20-Sep-18 8-Sep-18 12 18 feature 19-Sep-18 6-Sep-18 13 19 risk 20-Sep-18 18-Sep-18 2 20 feature 22-Sep-18 11-Sep-18 11 21 feature 21-Sep-18 9-Sep-18 12 22 feature 21-Sep-18 10-Sep-18 11 23 feature 22-Sep-18 8-Sep-18 14 24 feature 22-Sep-18 8-Sep-18 14 25 feature 23-Sep-18 10-Sep-18 13 26 tech debt 23-Sep-18 10-Sep-18 13 To view a copy of this license, visit http://creativecommons.org/licenses/by-sa/4.0/ Dominica DeGrandis www.ddegrandis.com This work is licensed under the Creative Commons Attribution-ShareAlike 4.0 Time: 3 min
  18. © 2019 Tasktop @dominicad Flow Time and Flow Velocity (Throughput)

    Chart Day 9 10 11 12 13 14 15 16 17 18 19 20 21 22 23 Day work completed # of days to complete work item 14 13 12 11 10 9 8 7 6 5 4 3 2 1 0 5 4 3 2 1 Histogram: # of completed items per day Feature Defect Tech Debt Risk Day 9 Day 10 Day 11 Day 12 Day 13 Day 14 Day 15 Day 16 17 18 19 Flow Time Chart Instructions: Plot 1 dot per completed work item, using the same color marker as the color of the work item. Do not connect the dots. Flow Velocity Chart Instructions: Draw one vertical bar per day (above the Flow Time chart) to create a histogram that shows the number of work items completed for each day. . Time: 3 min
  19. © 2019 Tasktop @dominicad What story is told based on

    the outcomes shown in this Flow time chart? Flow Velocity Outcomes
  20. © 2019 Tasktop @dominicad Flow Load: Amount of Work-in-Progress (WIP)

    Flow Load: All the partially completed work. All the work-in- progress (WIP) in the value stream
  21. DevOps - you build it you run it - that

    means you need full stack engineers, right? The Rise of the Full Stack Engineer StackOverflow survey showing Devs who considered themselves FSE grew from 29% in 2013 to 52% in 2019
  22. The Fallacy of the Full Stack Engineer • Design overall

    architecture of the web application. • Maintain quality and ensure responsiveness of applications. • Collaborate with the rest of the engineering team to design and launch new features. • Maintain code integrity and organization. • Experience working with graphic designers and converting designs to visual elements. • Understanding/ implementation of security and data protection. • High experience {{back-end programming languages: PHP, Python, Ruby, Java, .NET, JavaScript}} • Proficient experience using {{advanced JavaScript libraries and frameworks such as AngularJS, KnockoutJS, BackboneJS, ReactJS, DurandalJS etc.}}. • Development experience for both mobile and desktop. • Understanding of server-side languages including {{such-as Jade, EJS, Jinja, etc.}}. • Experience with cloud message APIs and usage of push notifications. • Knowledge of code versioning tools {{such as Git, Mercurial or SVN}}. https://www.skillgigs.com/full-stack-developer
  23. • exhaustion • cynicism • burnout: lost energy, enthusiasm, &

    confidence • lower quality • depression • health problems Maslach Burnout Inventory (MBI) Costs from Cognitive Overload https://www.youtube.com/watch?v=gRPBkCW0R5E&feature=youtu.be https://www.mindgarden.com/117-maslach-burnout-inventory
  24. © 2019 Tasktop @dominicad WIP is a leading indicator •

    WIP is a leading indicator • The single most important factor that affects wait time is capacity utilization Why Work-in-Progress Matters
  25. © 2019 Tasktop @dominicad @dominicad “If we have data, let’s

    look at data. If all we have are opinions, let’s go with mine.” - Jim Barksdale Be the voice of reason.
  26. © 2019 Tasktop @dominicad @dominicad Flow Efficiency: The percentage of

    time where work is in an active state vs. a wait state. Why Flow Efficiency - Expose wait time Benefit: Learn how much wait time exists in Value Stream to drive discussion to improve decisions on prioritization, capacity & utilization.
  27. © 2019 Tasktop @dominicad @dominicad “Things take too long” is

    a universal problem work request Disconnects in communication interferes with collaboration & delays delivery
  28. © 2019 Tasktop @dominicad consolidation, replication, and strangle approach. epics

    Reqs spreadsheets features stories defects test cases incidents problems vulnerabilities rfc’s gantt charts ryg rpts time sheets Tool fights break out due to inability to share knowledge, understand work capacity and improve workflow.
  29. © 2019 Tasktop @dominicad Scenario: Engagement level of your team

    is low High utilization Key people are leaving Question for the table: What changes and trends in which flow metrics would you expect to see given the above scenario? Exercise: Flow Metrics Discussion Time: 3 min
  30. © 2019 Tasktop @dominicad Team “Low engagement, Key people leaving”

    Flow Metrics for Scenario Things to consider: • Things take too long – Flow time • People drowning in work - Flow Load • No investment in fixing Debt - Flow Distribution • What about trust? Consider Flow Safety
  31. © 2019 Tasktop @dominicad @dominicad A metric to gage safety

    Examples: • On my team, failure causes inquiry and not blame. • Our leadership is open to hearing bad news. • In my org, failures are learning opportunities and messengers are not punished. • People on our team trust one another @nicolefv https://www.youtube.com/watch?v=avauW5FAWCw promoters passives detractors Flow Safety: A measure of trust
  32. © 2019 Tasktop @dominicad @dominicad Considerations: 1. If we improve

    one metric, what is the impact to other metrics? 2. What signals will you look for to recognize when one metric is optimized good enough and it’s time to prioritize other metrics? 3. Improvement takes time – how to know when it starts?
  33. © 2019 Tasktop @dominicad @dominicad Dominica DeGrandis The 5Thieves of

    Time Unplanned work Conflicting Priorities Unknown Dependencies Neglected work Too Much WIP
  34. © 2019 Tasktop @dominicad TAKEAWAYS & BENEFITS • Flow metrics

    are tied to business value • Flow metrics are based on outcomes • Flow metrics provide a feedback loop to improve decisions
  35. © 2019 Tasktop @dominicad IT can't be successful without business

    support and business people can’t support IT if ideas aren't framed in terms they understand. Involve your business people
  36. © 2019 Tasktop @dominicad § Flow Time – speed §

    Flow Distribution – work item types § Flow Velocity – throughput § Flow Efficiency – wait time ratio § Flow Load – WIP 5 Flow Metrics - focused on business outcomes
  37. © 2019 Tasktop @dominicad @dominicad How to Get started with

    Flow Metrics Start capturing 1 work item type in 1 VS and 1 flow metric Homework: “Find 1 business leader & 1 IT leader and take steps toward alignment. It's up to you.” Ross Clanton
  38. © 2019 Tasktop @dominicad Email: [email protected] Subject: flow To receive:

    • copy of presentation deck • Flow 101 workshop info • Value Stream Canvas exercise • Tasktop tool integration video showing integrations between ServiceNow & Jira • excerpts of Making Work Visible • Forrester report on Value Stream Mgmt