Upgrade to Pro — share decks privately, control downloads, hide ads and more …

Prometheus at JustWatch

Prometheus at JustWatch

This Talk introduces JustWatch and gives and overview of why and how we use Prometheus to meet our SLOs.

Dominik Schulz

January 23, 2017
Tweet

More Decks by Dominik Schulz

Other Decks in Technology

Transcript

  1. JustWatch is a new kind of international adtech and data

    company solely focused on the movie industry. JustWatch is providing data driven video advertising campaigns focused on the revenue relevant power users mostly on YouTube and Facebook. JustWatch has exclusive first party data about movie taste and purchase behavior and minimizes waste coverage worldwide on scale.
  2. Why are able to reach this efficiency? JustWatch has exclusive

    first party data and technology B2C International Movie and TV-Show Apps B2B Next Generation Movie Marketing
  3. JustWatch collects anonymized data about purchase behavior and movie taste

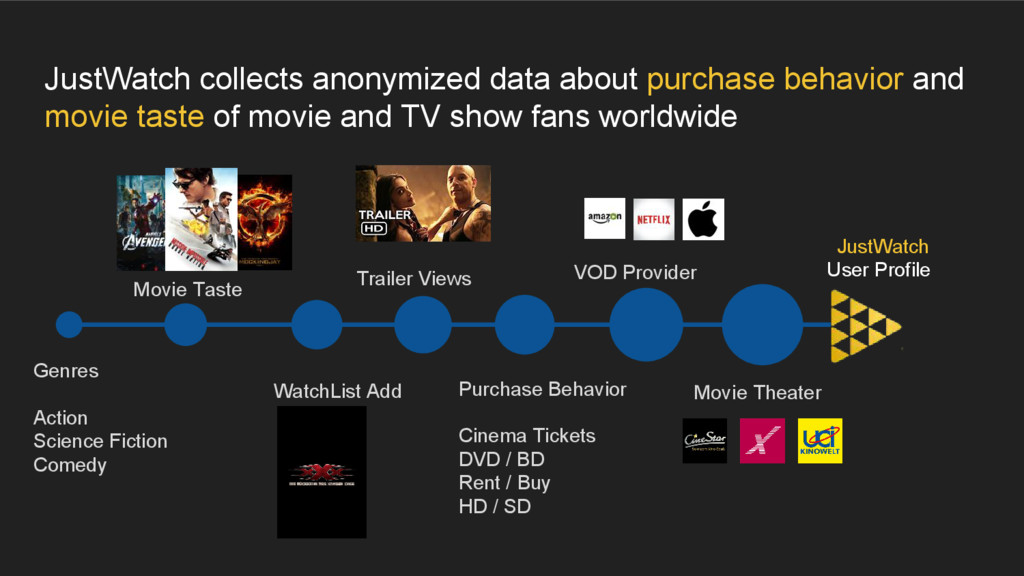
    of movie and TV show fans worldwide JustWatch User Profile Genres Action Science Fiction Comedy Movie Taste WatchList Add Trailer Views Purchase Behavior Cinema Tickets DVD / BD Rent / Buy HD / SD VOD Provider Movie Theater
  4. JustWatch is growing rapidly in currently 24 countries, adding more

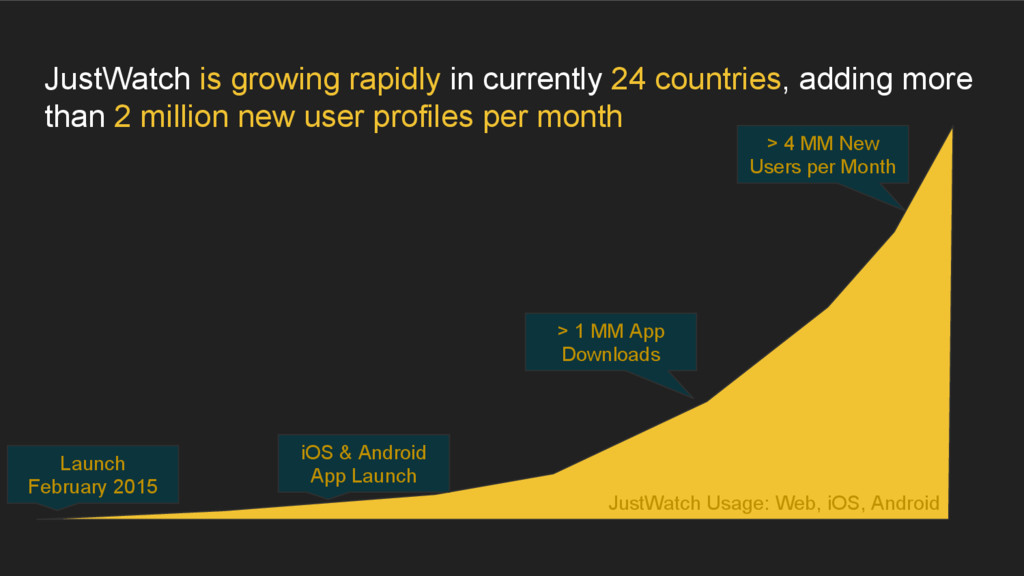
    than 2 million new user profiles per month JustWatch Usage: Web, iOS, Android Launch February 2015 iOS & Android App Launch > 1 MM App Downloads > 4 MM New Users per Month
  5. We build and maintain over 50 stateless 12 Factor micro-services

    written in Go and deploy to AWS, GCE and Kubernetes using ChatOps. Everything is monitored by Prometheus
  6. We run a handful of Prometheus servers, at least a

    dozen exporters and maintain several custom exporters.
  7. How do you make sure thousands of instances of your

    app around the world are responsive?
  8. Make your AngularJS and Ionic apps send telemetry data to

    a Go micro-service that feeds to Prometheus
  9. <script type="text/javascript"> // globally saving the initial start time window.startupTime

    = new Date(); window.componentsLoaded = []; // later somewhere else, normally in angular window.componentsLoaded.push('translations'); // translations finished window.componentsLoaded.push('movies'); // movies finished window.componentsLoaded.push('tvshows'); // tvshows finished </script>
  10. <script type="text/javascript"> // in angular triggered via event, simplified for

    slides if window.componentsLoaded.length == 3 { var elapsed = new Date() - window.startupTime; $http({ url: `https://events.justwatch.com/event/pageload/${elapsed}`, method: 'POST', data: { mobile: window.isMobile, platform: window.platform } }); } </script>
  11. // prometheus pageload histogram PageloadSum := prometheus.NewHistogramVec( prometheus.HistogramOpts{ Name: "telemetry_pageload_time_seconds",

    Help: "Pageload time in seconds", Buckets: []float64{1.0, 2.0, 3.0, 5.0, 7.0, 10.0, 15.0, 20.0, 30.0, 60.0}, }, []string{"platform", "device", "country"}, ) func eventPageloadHandler(w http.ResponseWriter, r *http.Request) { [...] country := getCountryCodeFromRequest(r) // examines RemoteAddr and X-Forwarded-For PageloadSum.WithLabelValues( platform, device, country ).Observe( float64(duration) / 1000.0 ) w.WriteHeader(http.StatusNoContent) } mux.HandleFunc( "/event/pageload/", prometheus.InstrumentHandlerFunc("event-pageload", eventPageloadHandler) )
  12. • Device Types: count(sum(telemetry_pageload_time_seconds_bucket) by(device)) • -> 3 (web, mobile,

    bot) • Platforms: count(sum(telemetry_pageload_time_seconds_bucket) by(platform)) • -> 4 (web, ios, android, unknown) • Buckets: count(sum(telemetry_pageload_time_seconds_bucket) by(le)) • -> 10+1 • Countries: count(sum(telemetry_pageload_time_seconds_bucket) by(country)) • -> 229 • 3 * 4 * 11 * 229 • 30228 Timeseries • (Number of Pods per Service: >= 3) • (>= 90684)
  13. telemetry_pageload_time_prod_count = sum(rate(telemetry_pageload_time_seconds_count{env="prod"}[1h])) Example: 10 Pageload Time Reports per Second

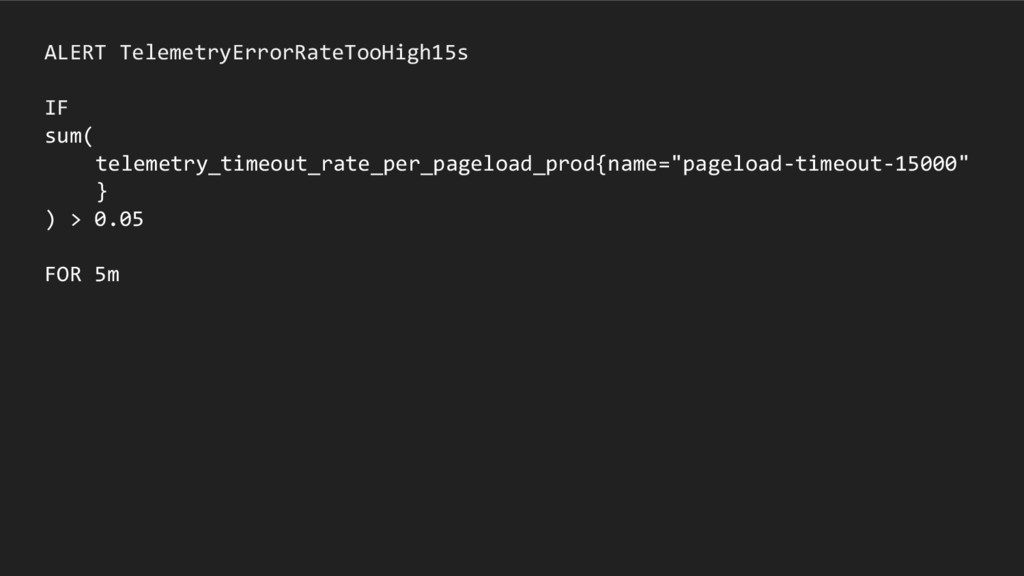
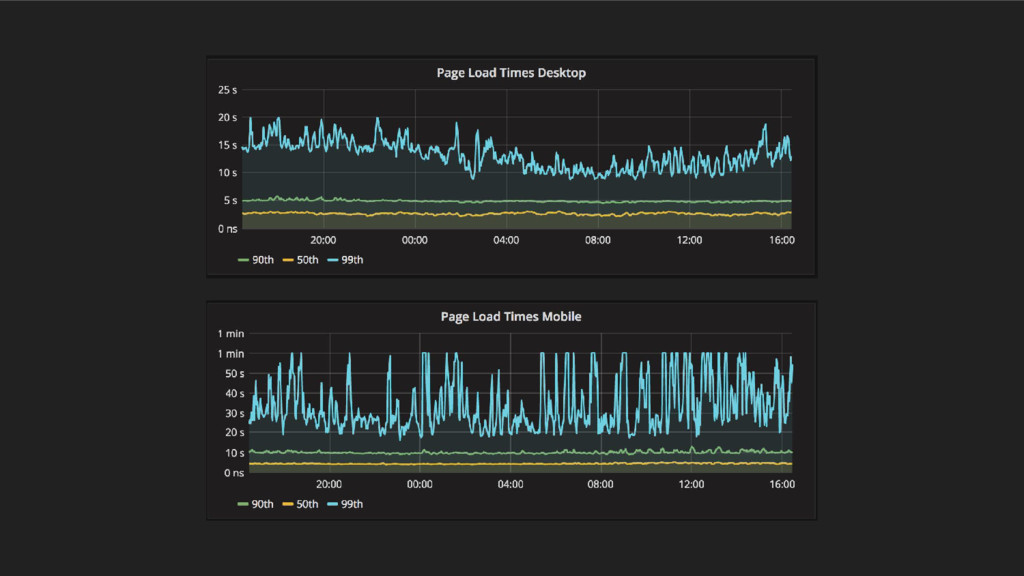
    telemetry_events_prod_by_name_dev = sum(rate(telemetry_events_total{env="prod"}[1h])) by(name,device) Example: 0.05 Pageload Timeouts per Second on Mobile after 15s telemetry_timeout_rate_per_pageload_prod = sum(telemetry_events_prod_by_name_dev{device!="bot"}) by (name) / ignoring(name) group_left telemetry_pageload_time_prod_count Example: 0.16 Pageload Timeouts (5s) per Pageload Report (16%)
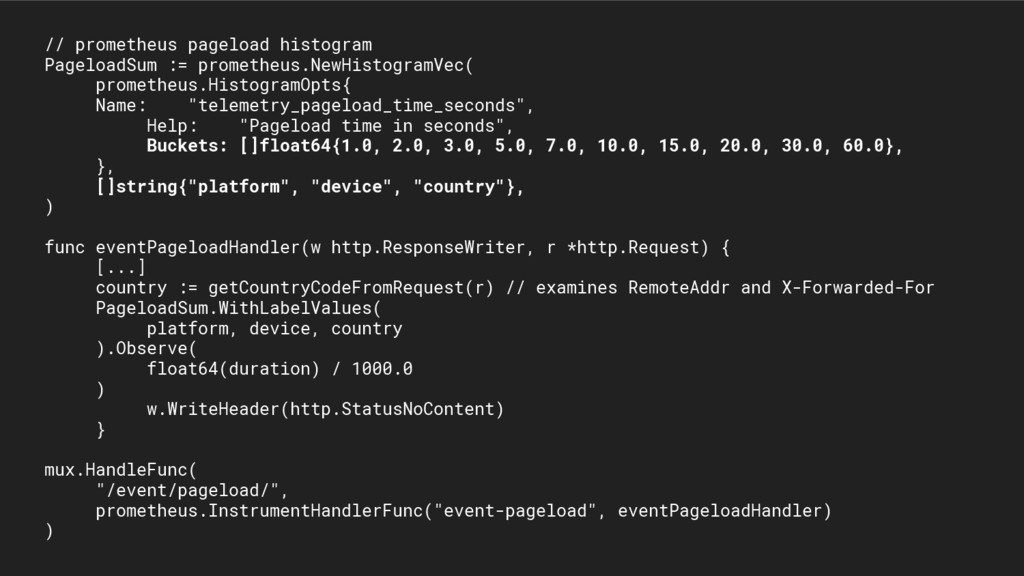
  14. We’re hiring. AdTech Engineers Site Reliability Engineers Fullstack Engineers Work

    with awesome people and state of the art technology in a self-funded, profitable startup.