Upgrade to Pro — share decks privately, control downloads, hide ads and more …

[KCD Czech] eBPF Meets the GPU: Future of AI In...

Sponsored · SiteGround - Reliable hosting with speed, security, and support you can count on.

[KCD Czech] eBPF Meets the GPU: Future of AI Infra Observability

GPUs are the new black box. As AI workloads take over production, SREs are left blind your observability stack stops at the CPU boundary. When an inference job degrades at 3am, you have no idea where to start looking.
This talk covers how eBPF is being pushed beyond the CPU, from tracing inference pipelines with zero code changes to injecting eBPF inside GPU kernels and where research is going on that matter.

Avatar for Donia Chaiehloudj

Donia Chaiehloudj

May 21, 2026

More Decks by Donia Chaiehloudj

Other Decks in Programming
Transcript

  1. eBPF Meets the GPU The Future of AI Infrastructure Observability

    Donia Chaiehloudj, Software Engineer & Community KCD Provence organiser 🌞
  2. Agenda • GPU 101 • What is eBPF • The

    observability gap • A landscape of eBPF tools for GPU Observability • The future of eBPF for AI Infrastructure • Practical Toolkit @doniacld
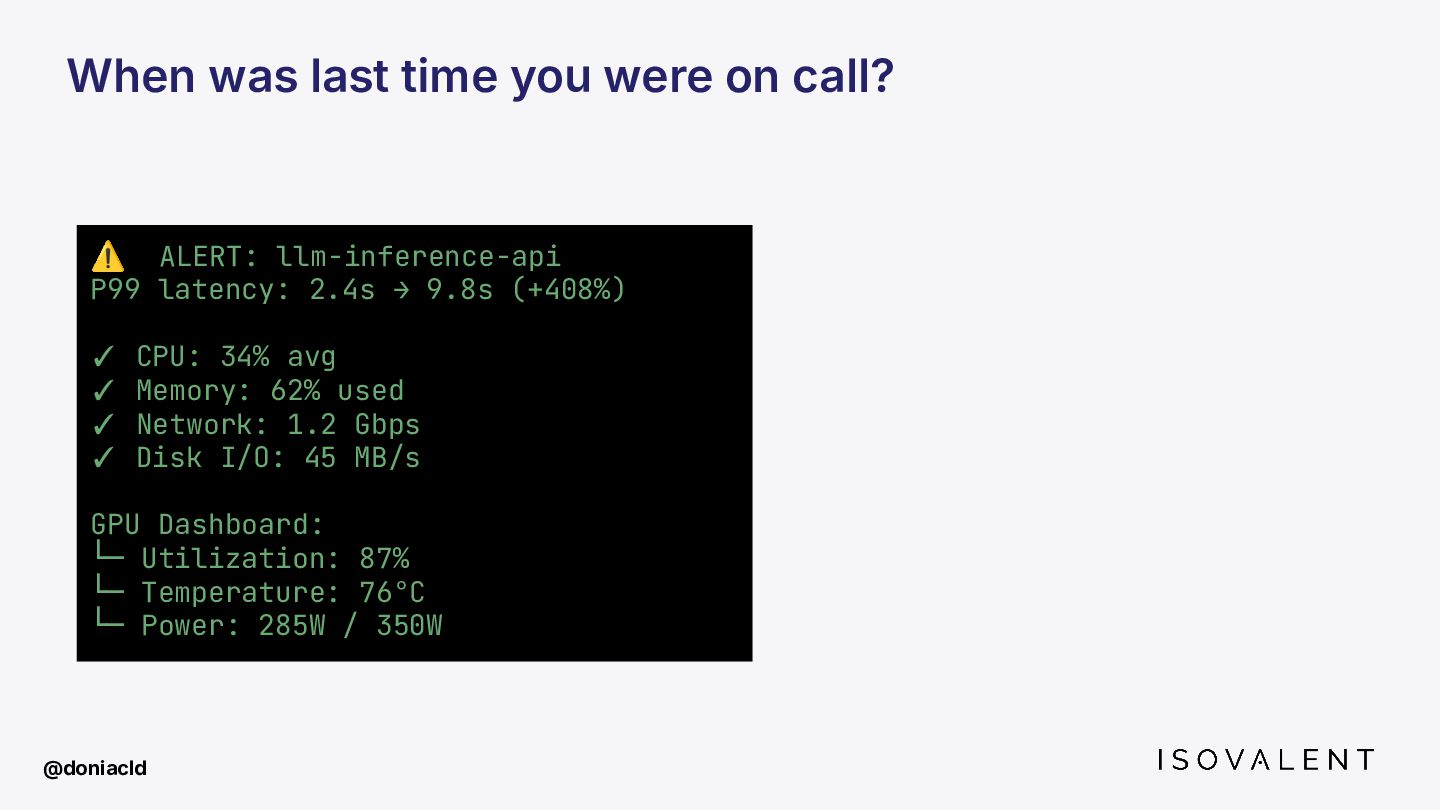
  3. When was last time you were on call? ⚠ ALERT:

    llm-inference-api P99 latency: 2.4s → 9.8s (+408%) ✓ CPU: 34% avg ✓ Memory: 62% used ✓ Network: 1.2 Gbps ✓ Disk I/O: 45 MB/s GPU Dashboard: └─ Utilization: 87% └─ Temperature: 76°C └─ Power: 285W / 350W @doniacld
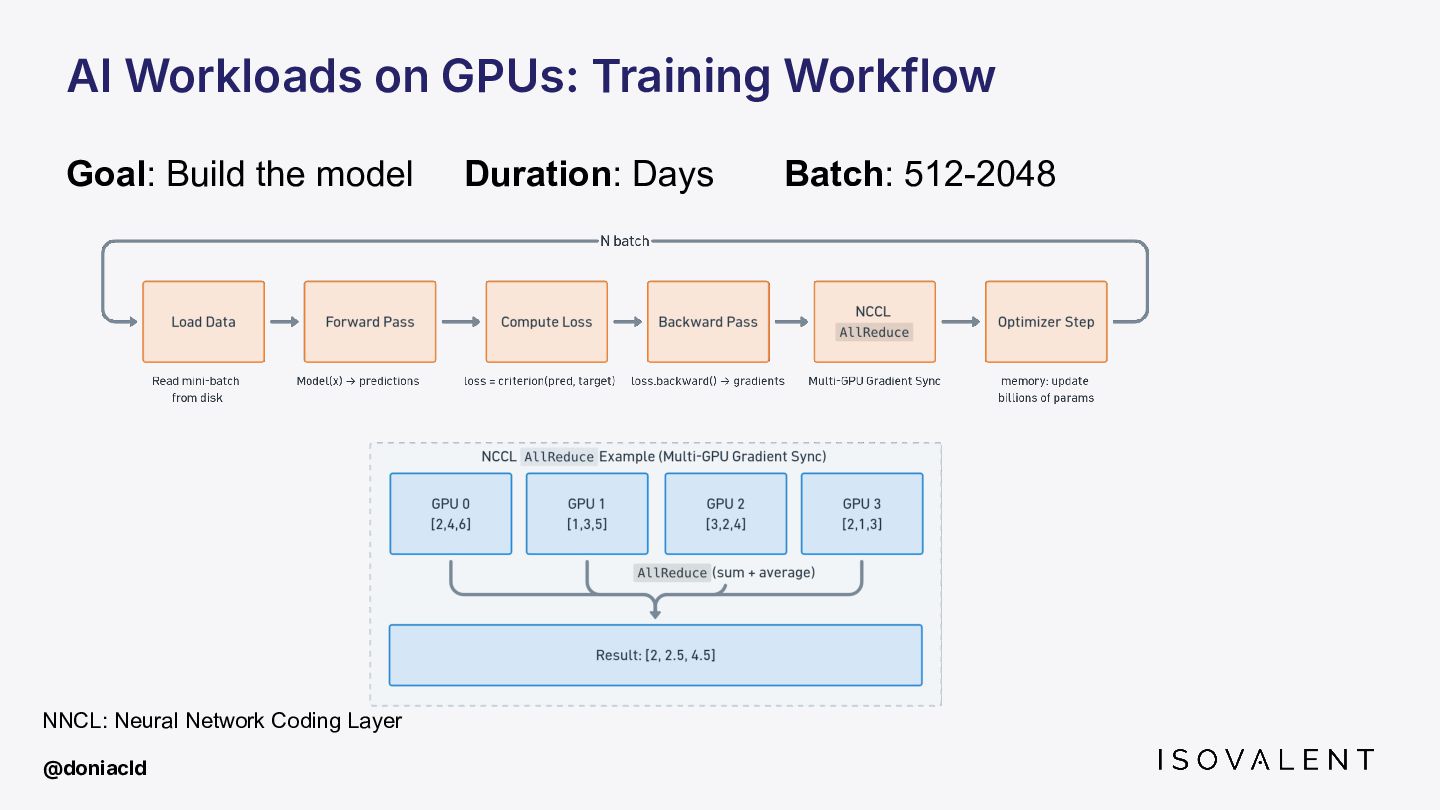
  4. AI Workloads on GPUs: Training Workflow Goal: Build the model

    Duration: Days Batch: 512-2048 NNCL: Neural Network Coding Layer @doniacld
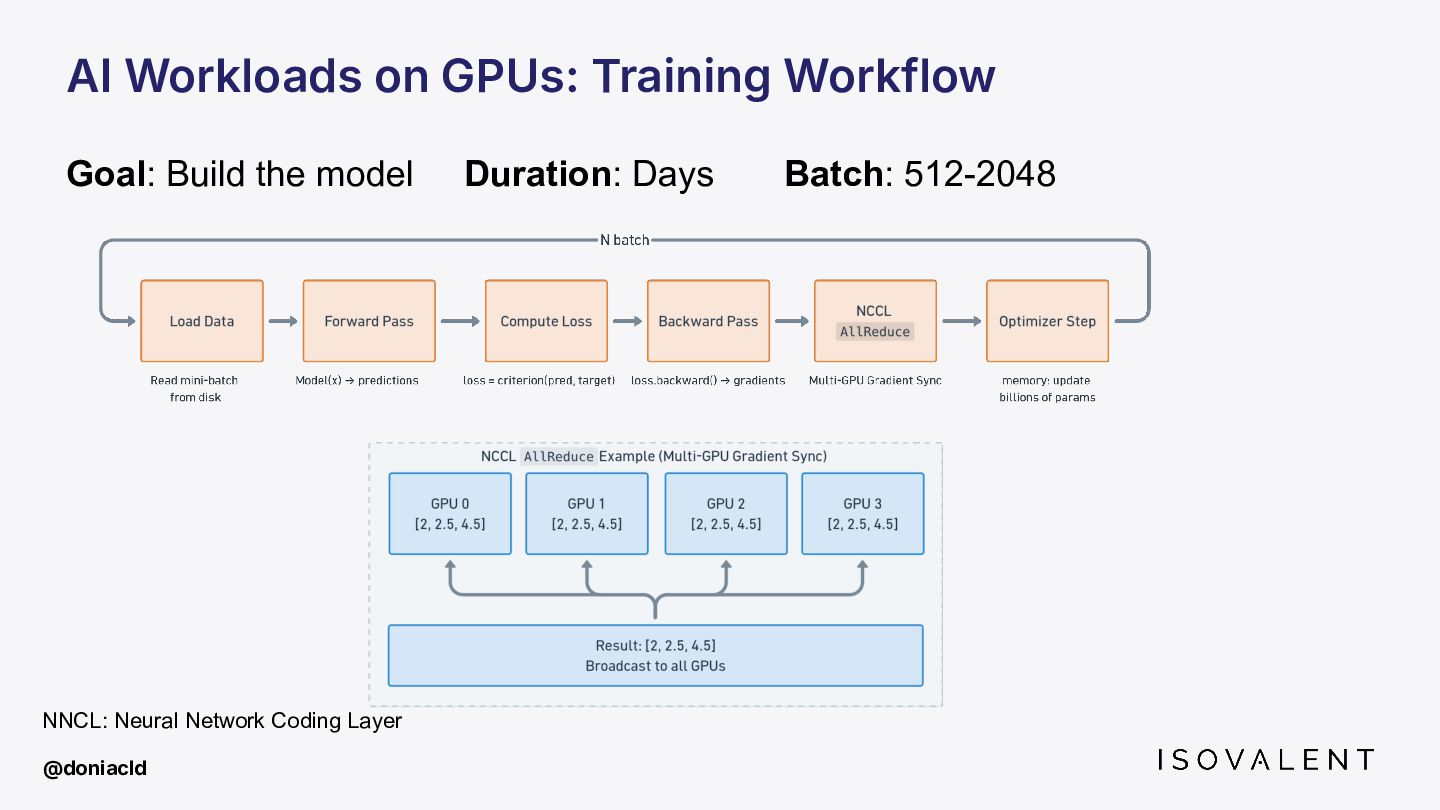
  5. AI Workloads on GPUs: Training Workflow Goal: Build the model

    Duration: Days Batch: 512-2048 @doniacld NNCL: Neural Network Coding Layer
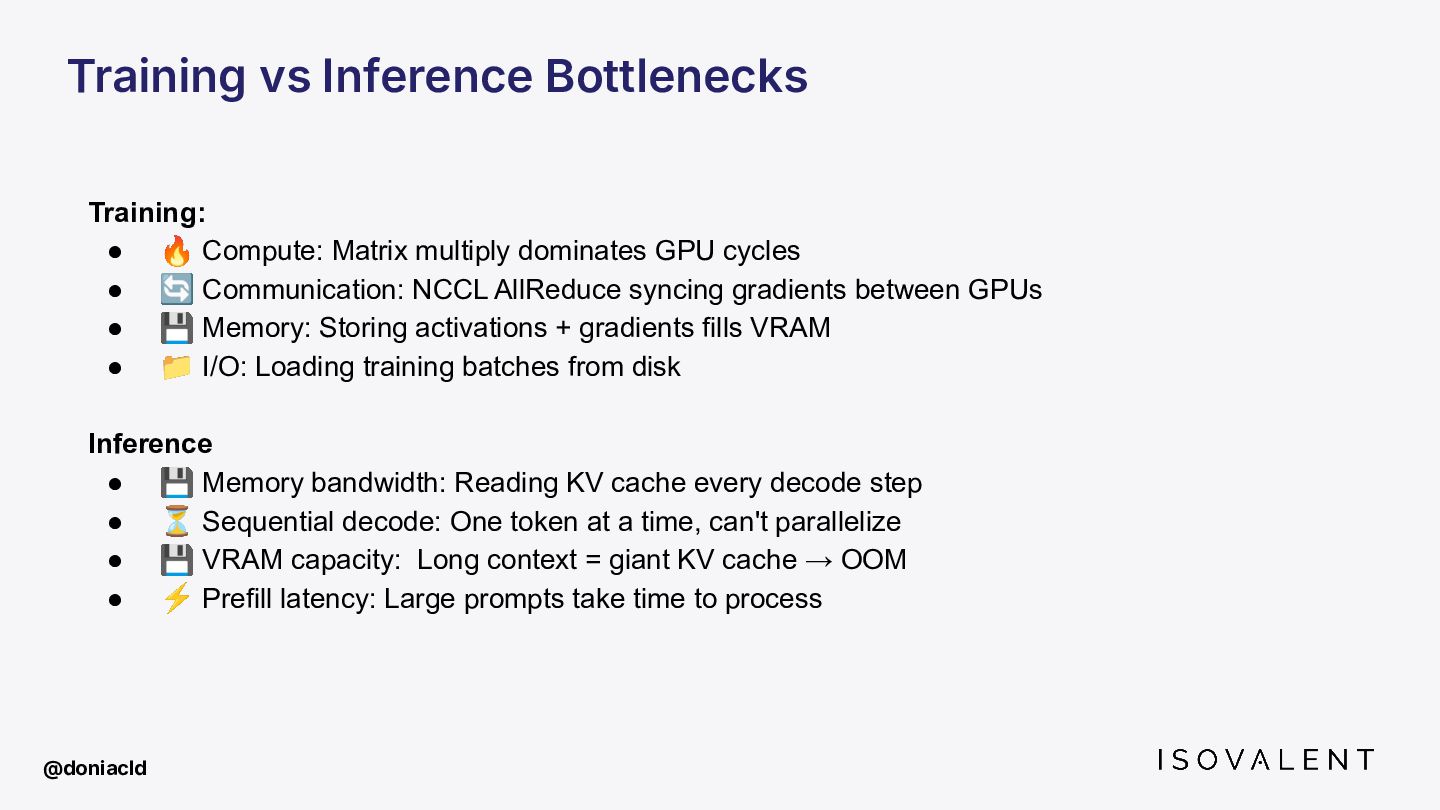
  6. Training vs Inference Bottlenecks Training: • 🔥 Compute: Matrix multiply

    dominates GPU cycles • 🔄 Communication: NCCL AllReduce syncing gradients between GPUs • 💾 Memory: Storing activations + gradients fills VRAM • 📁 I/O: Loading training batches from disk Inference • 💾 Memory bandwidth: Reading KV cache every decode step • ⏳ Sequential decode: One token at a time, can't parallelize • 💾 VRAM capacity: Long context = giant KV cache → OOM • ⚡ Prefill latency: Large prompts take time to process @doniacld
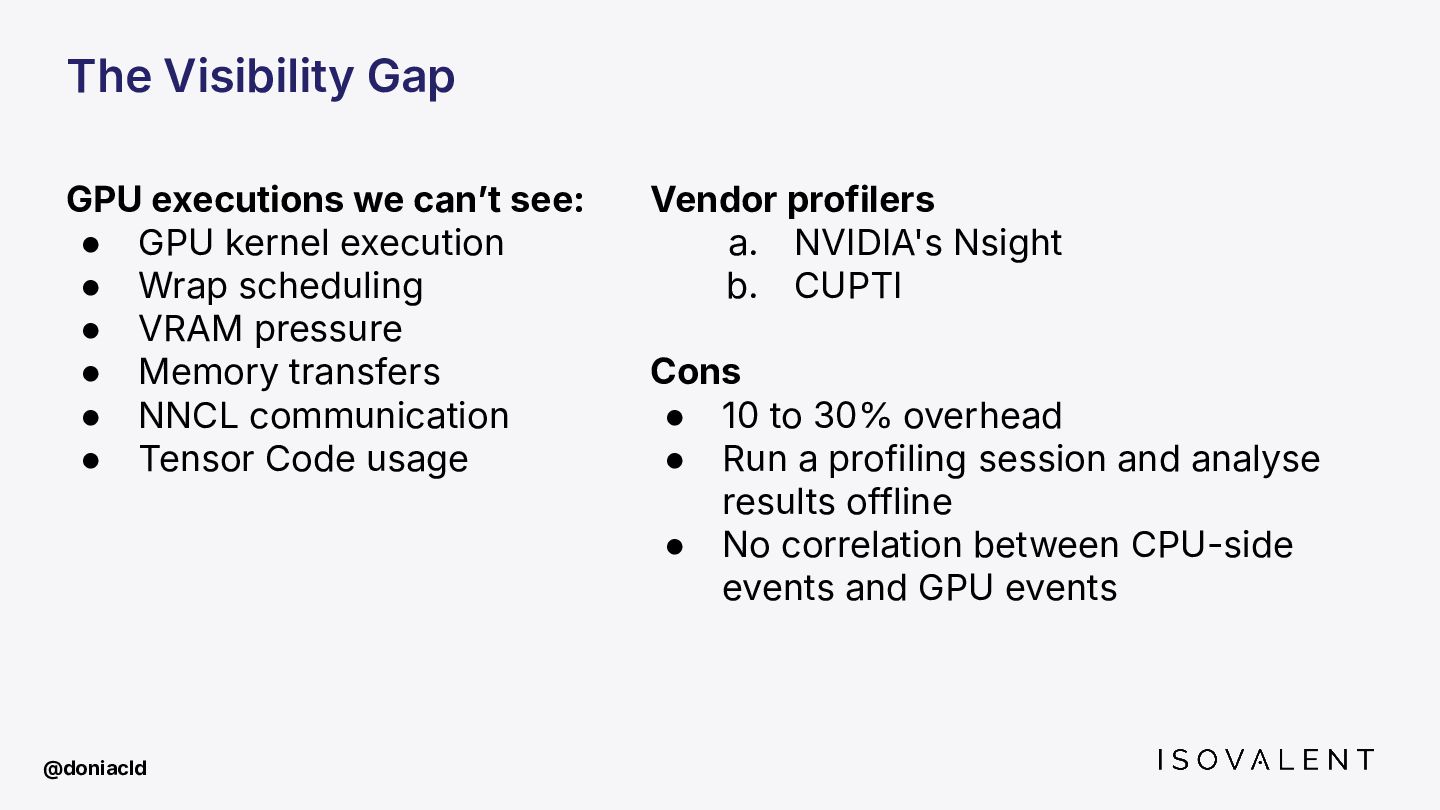
  7. The Visibility Gap GPU executions we canʼt see: • GPU

    kernel execution • Wrap scheduling • VRAM pressure • Memory transfers • NNCL communication • Tensor Code usage Vendor profilers a. NVIDIA's Nsight b. CUPTI Cons • 10 to 30% overhead • Run a profiling session and analyse results offline • No correlation between CPU-side events and GPU events @doniacld
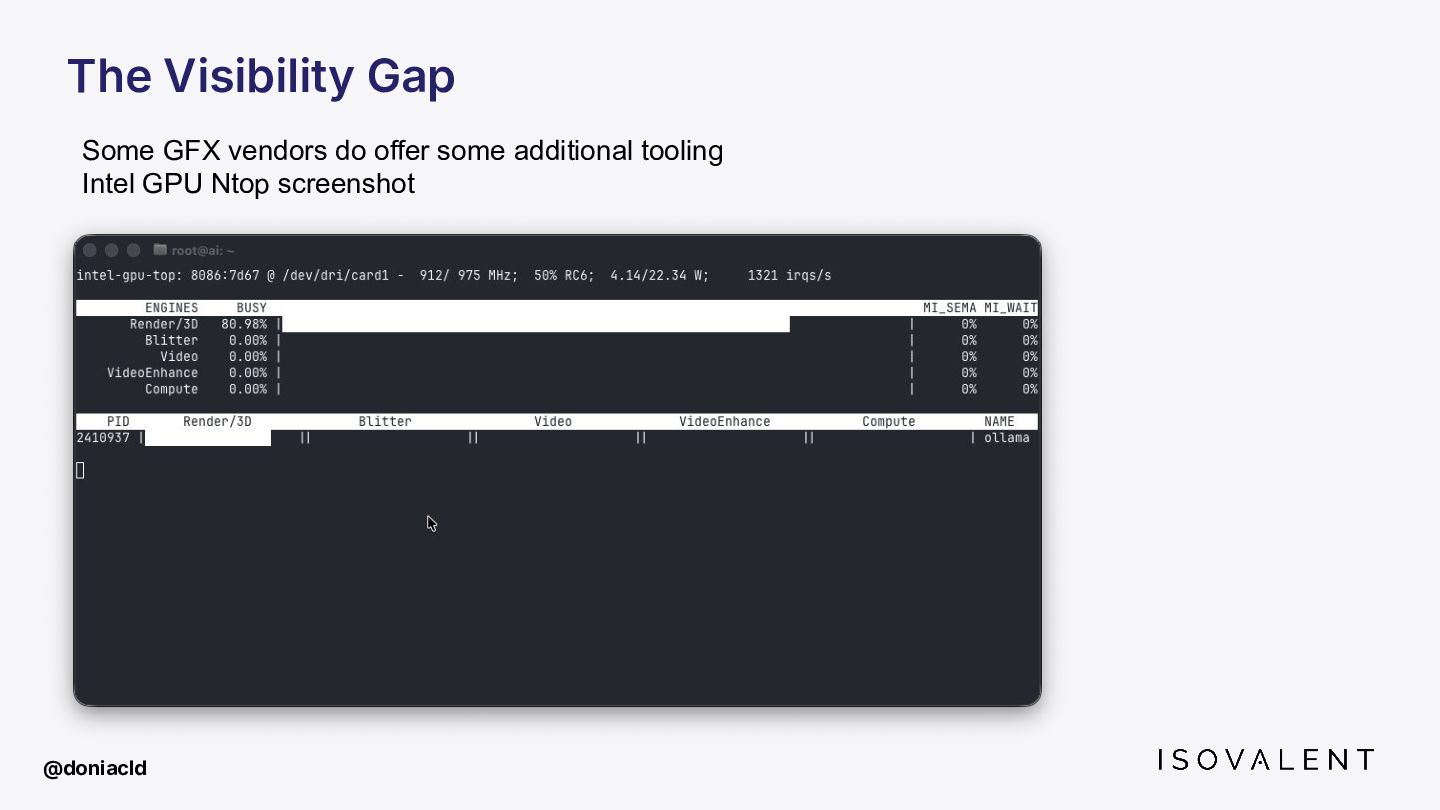
  8. The Visibility Gap @doniacld Some GFX vendors do offer some

    additional tooling Intel GPU Ntop screenshot
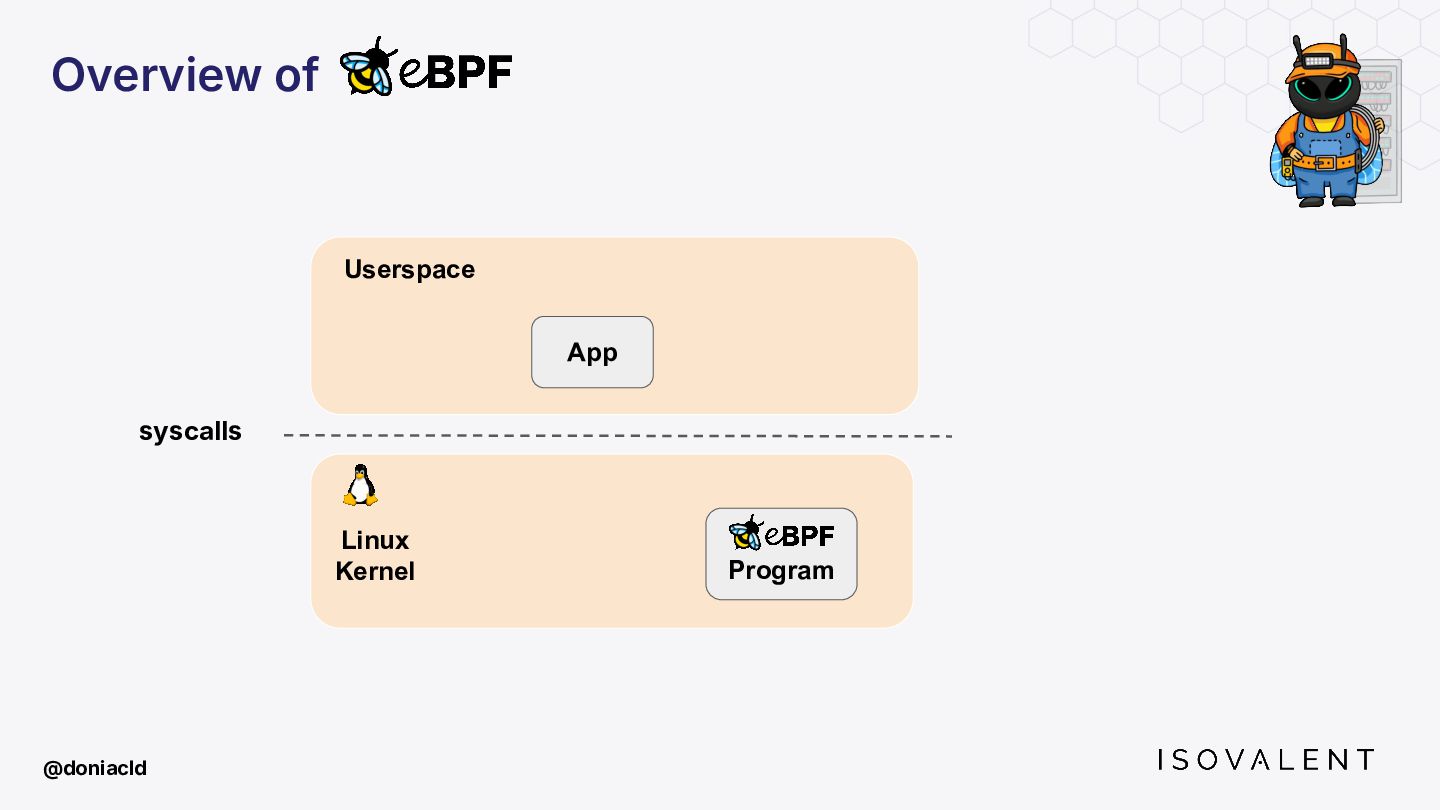
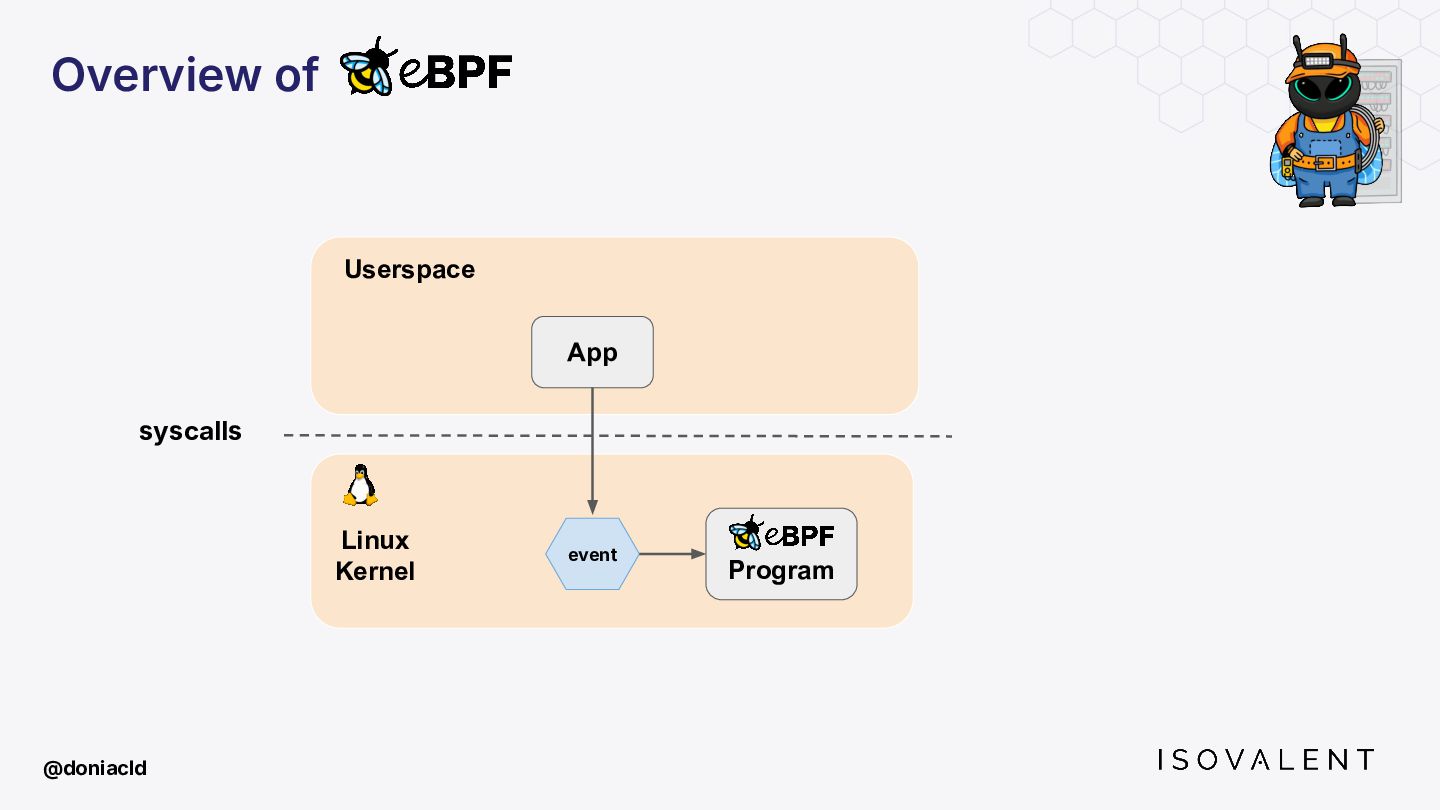
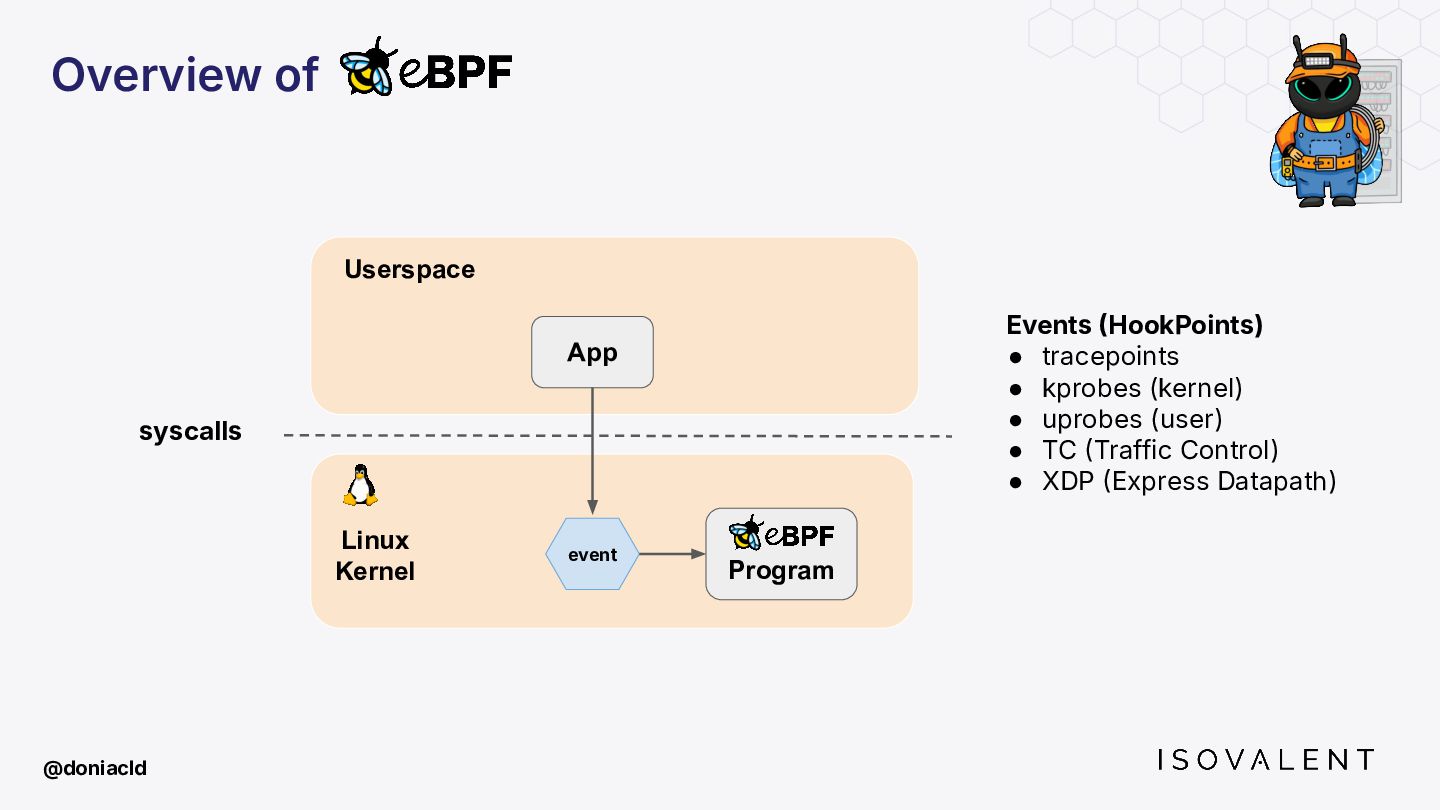
  9. @doniacld Program App Linux Kernel Userspace syscalls event Events HookPoints)

    • tracepoints • kprobes (kernel) • uprobes (user) • TC Traffic Control) • XDP Express Datapath) Overview of
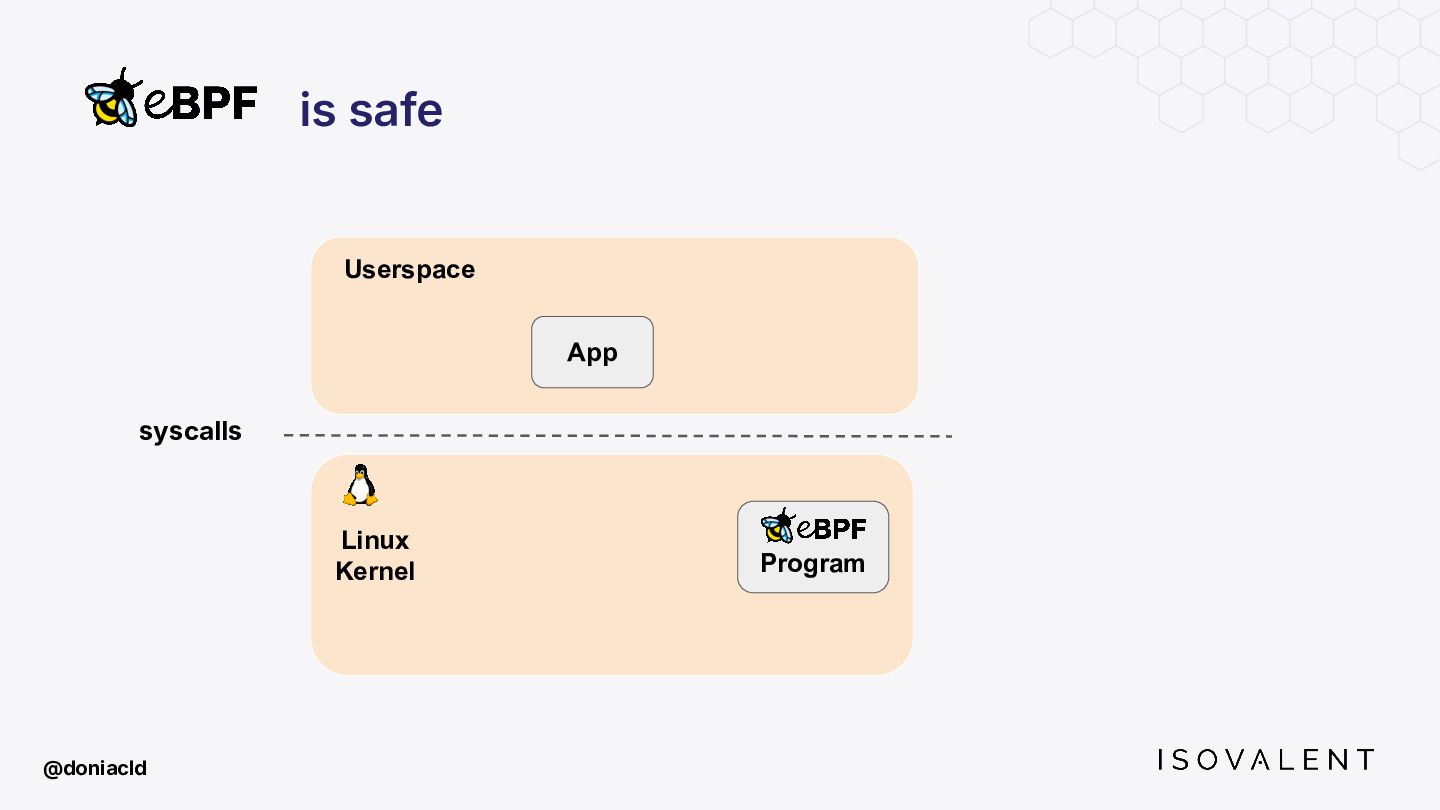
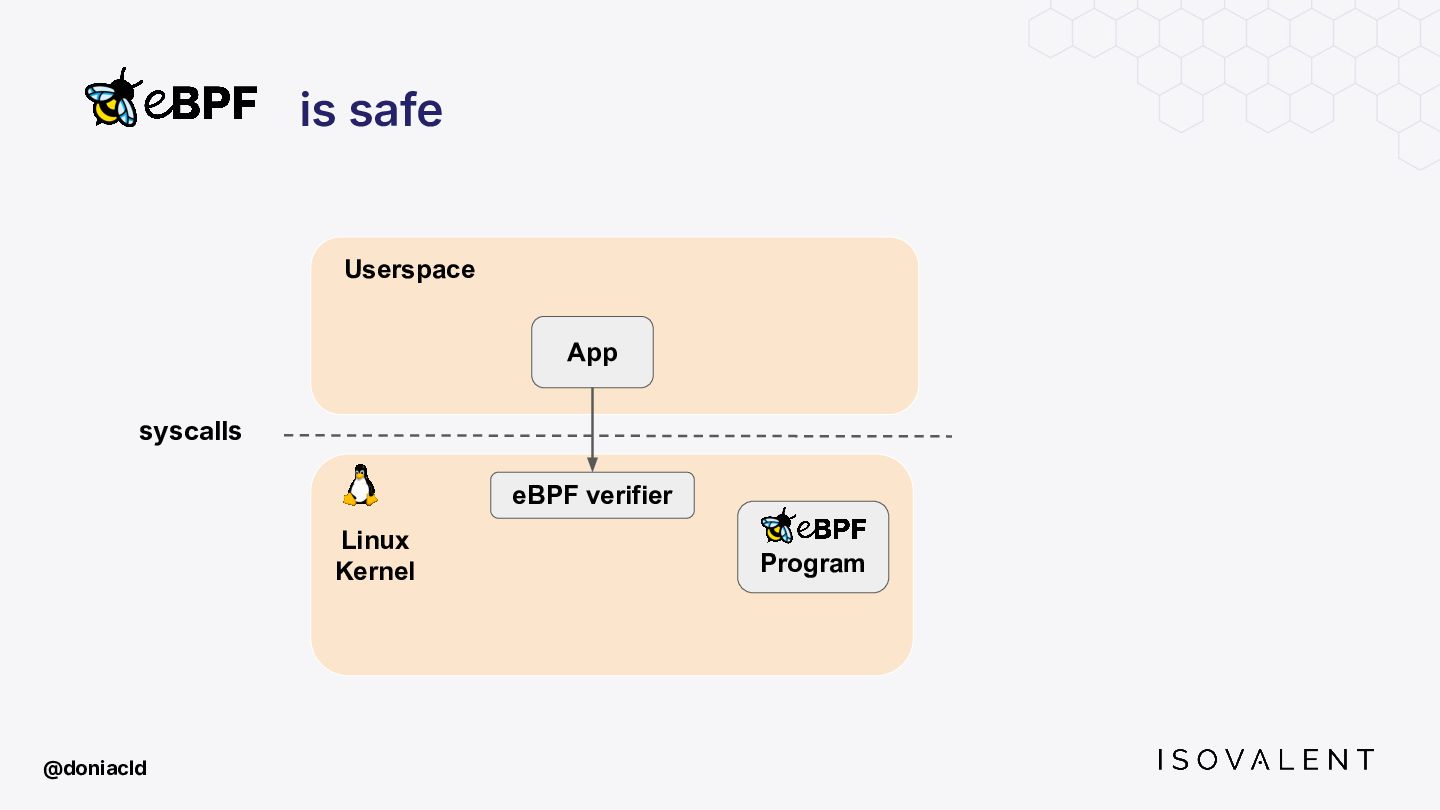
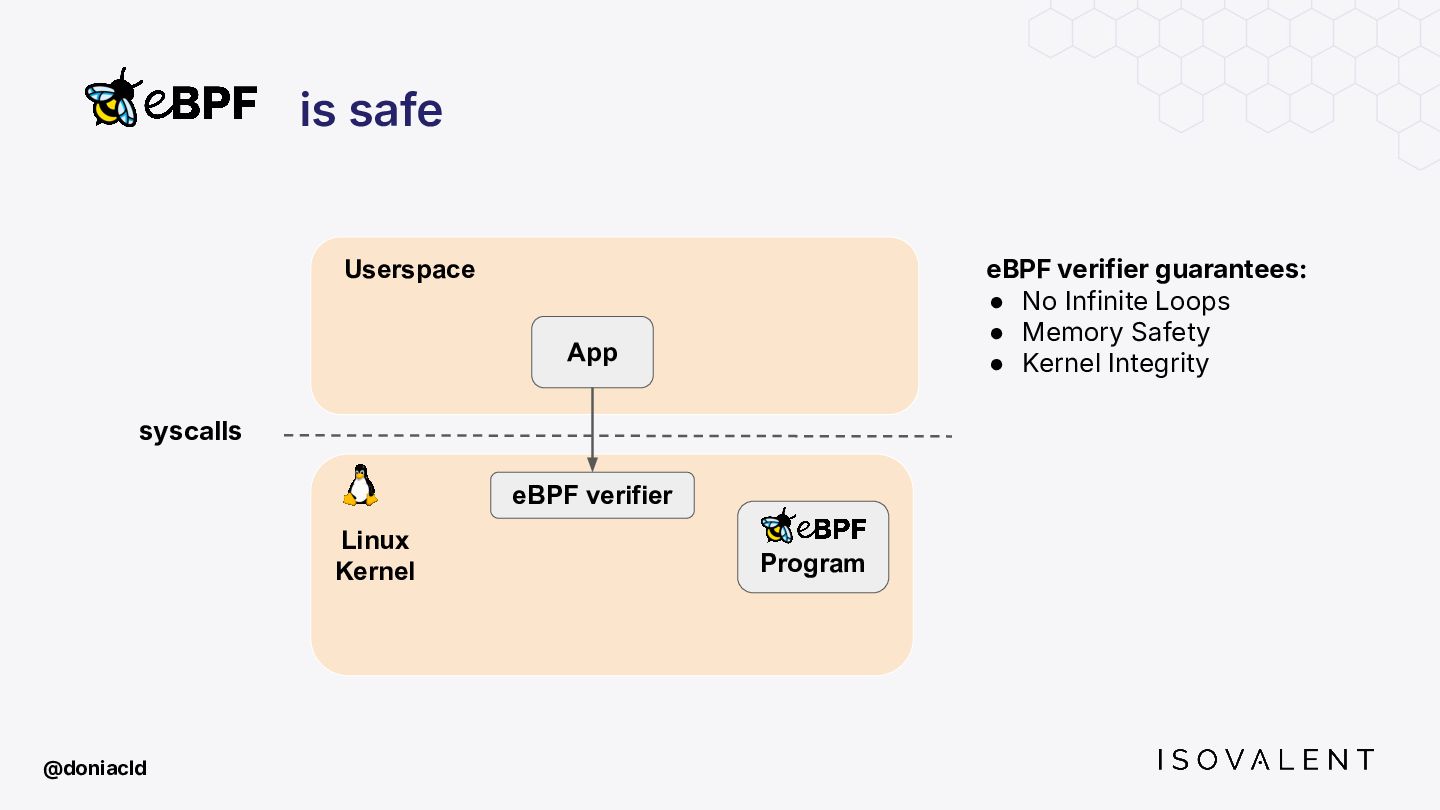
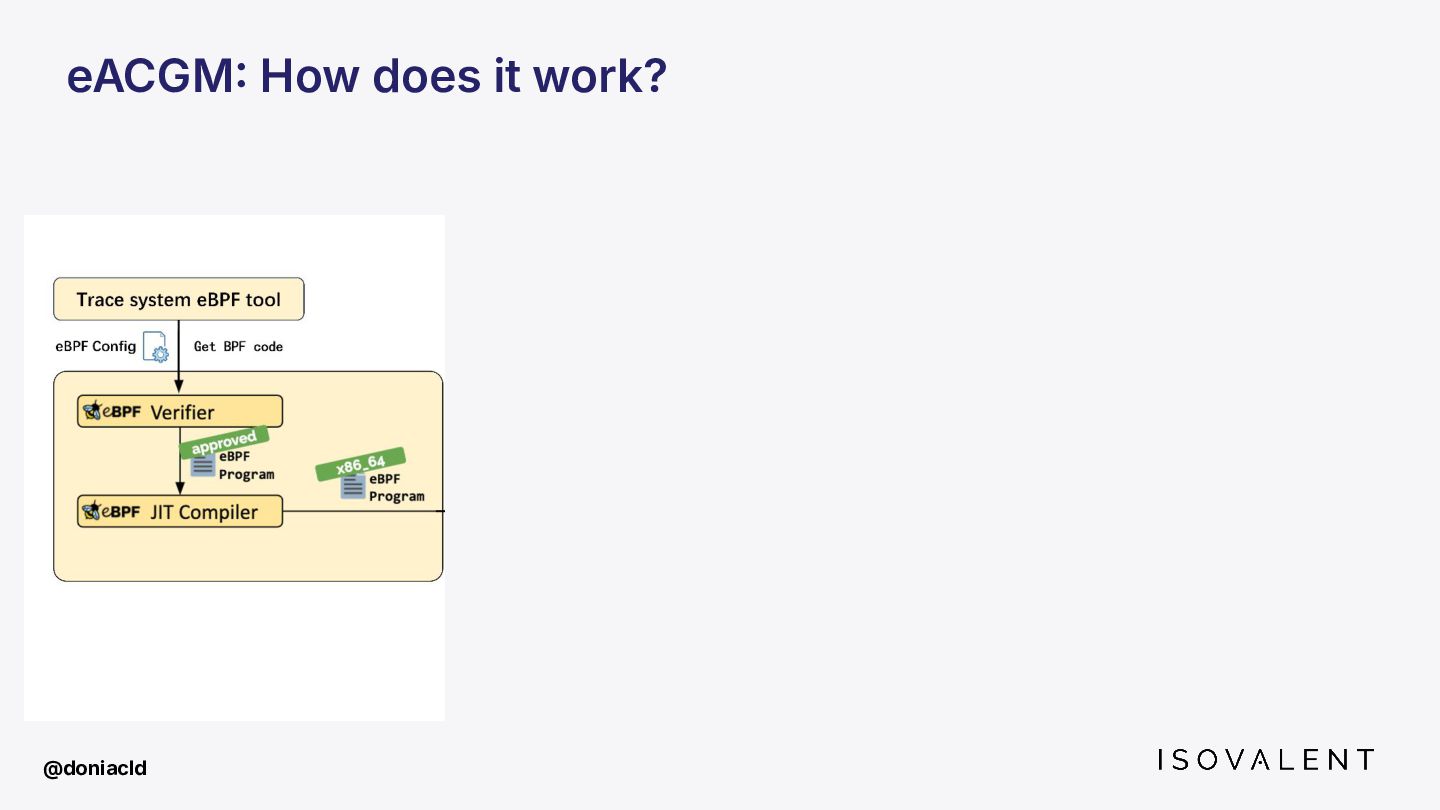
  10. @doniacld Program App Linux Kernel Userspace syscalls eBPF verifier eBPF

    verifier guarantees: • No Infinite Loops • Memory Safety • Kernel Integrity is safe
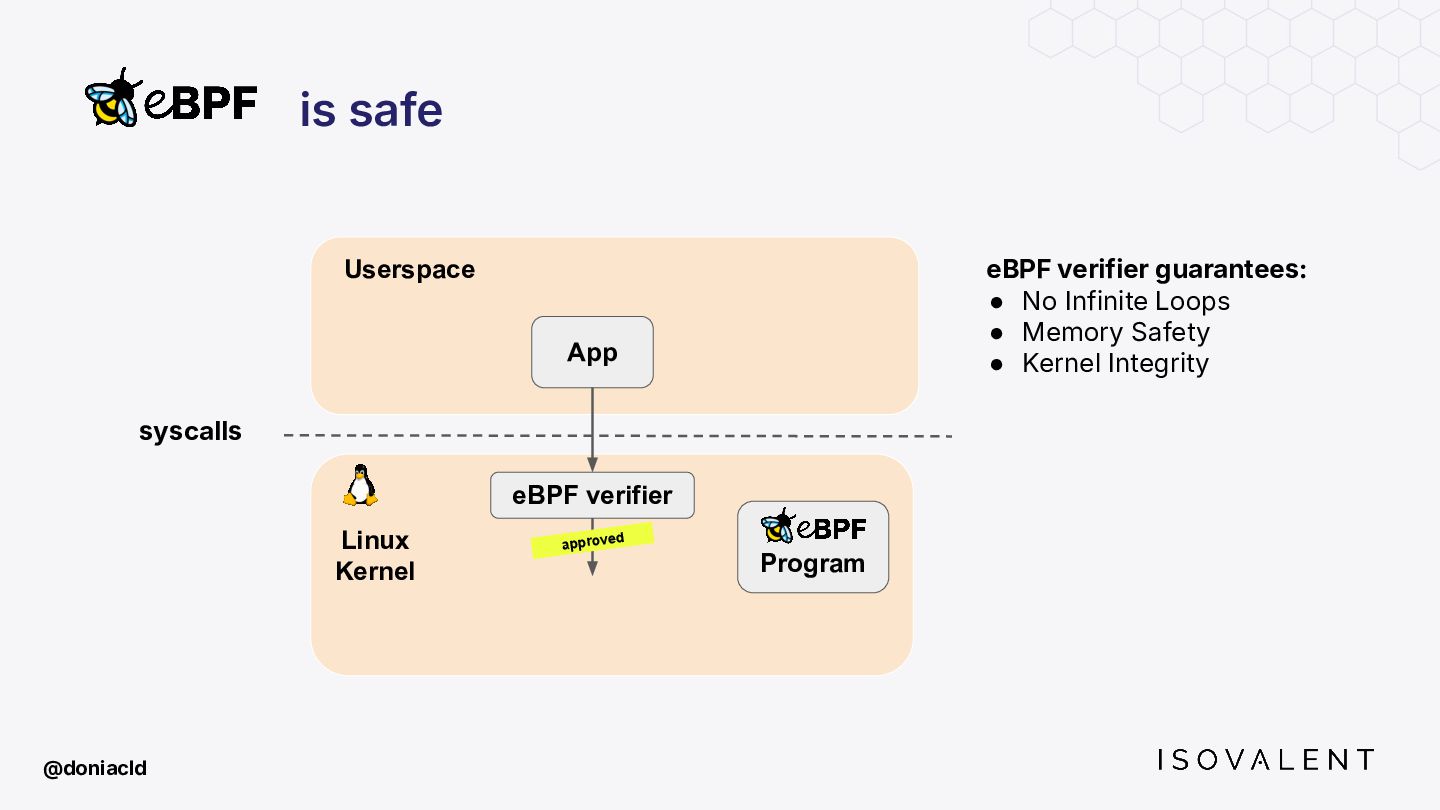
  11. @doniacld Program App Linux Kernel Userspace syscalls eBPF verifier approved

    eBPF verifier guarantees: • No Infinite Loops • Memory Safety • Kernel Integrity is safe
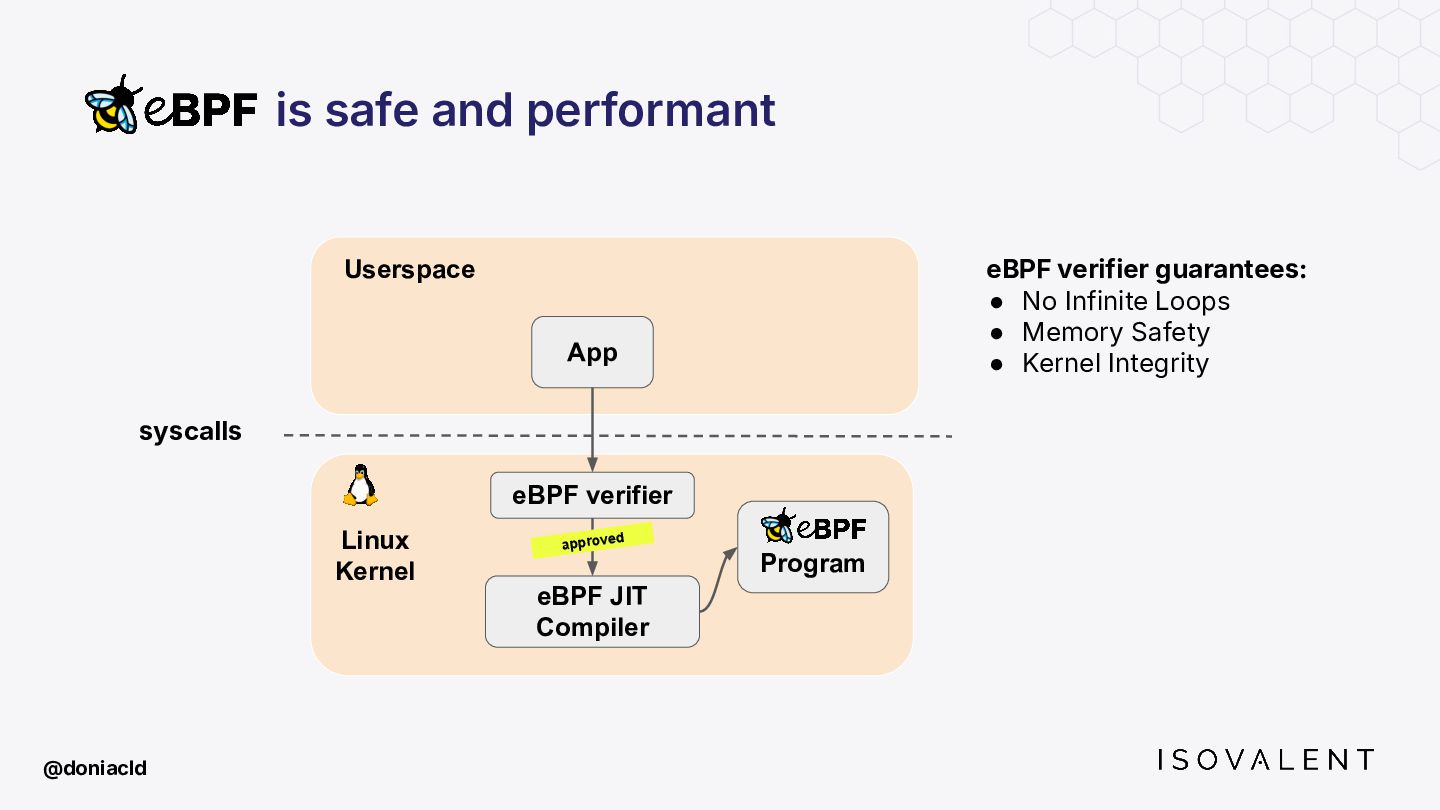
  12. @doniacld Program App Linux Kernel Userspace syscalls eBPF verifier eBPF

    JIT Compiler approved eBPF verifier guarantees: • No Infinite Loops • Memory Safety • Kernel Integrity is safe and performant
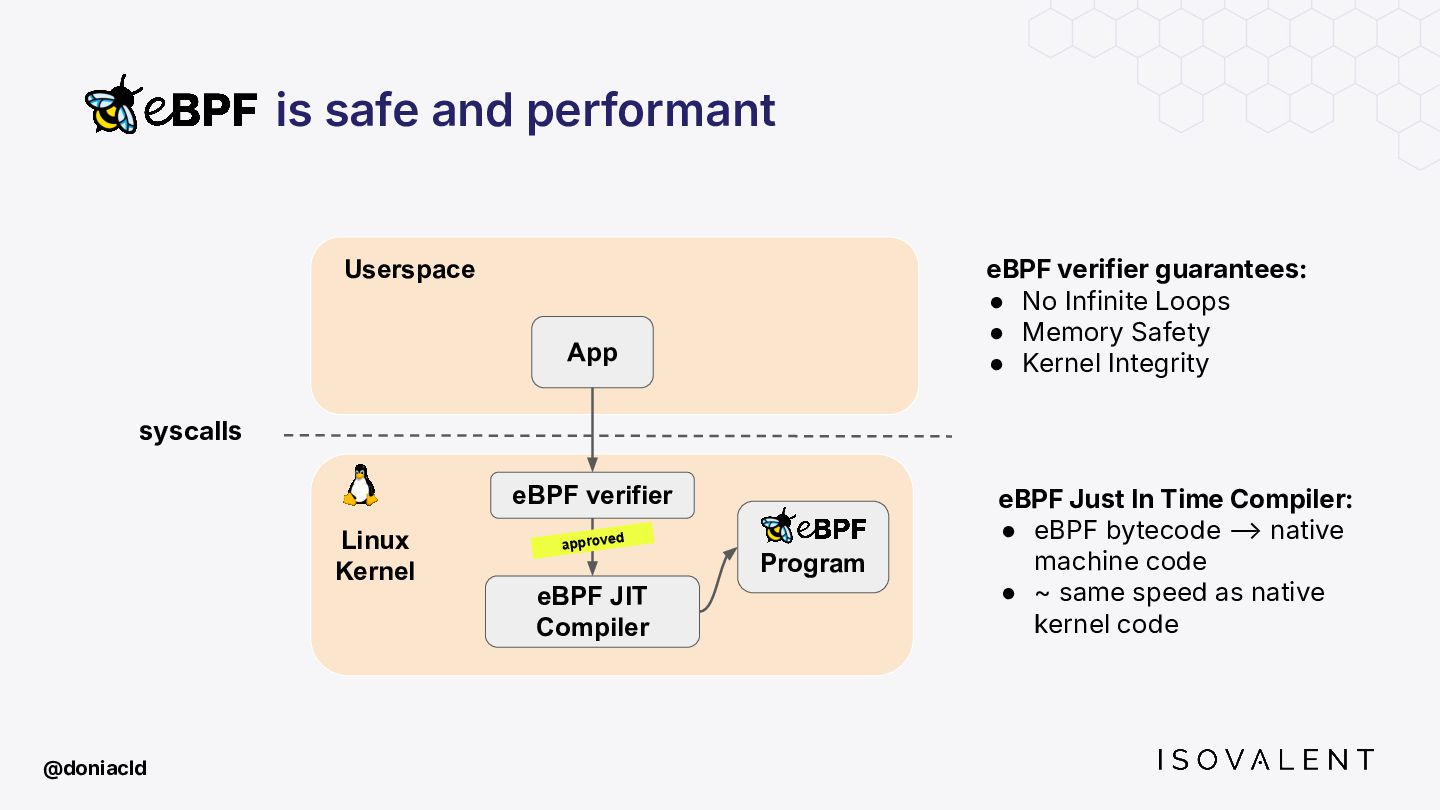
  13. @doniacld Program App Linux Kernel Userspace syscalls eBPF verifier eBPF

    JIT Compiler approved eBPF verifier guarantees: • No Infinite Loops • Memory Safety • Kernel Integrity eBPF Just In Time Compiler: • eBPF bytecode ⟶ native machine code • ~ same speed as native kernel code is safe and performant
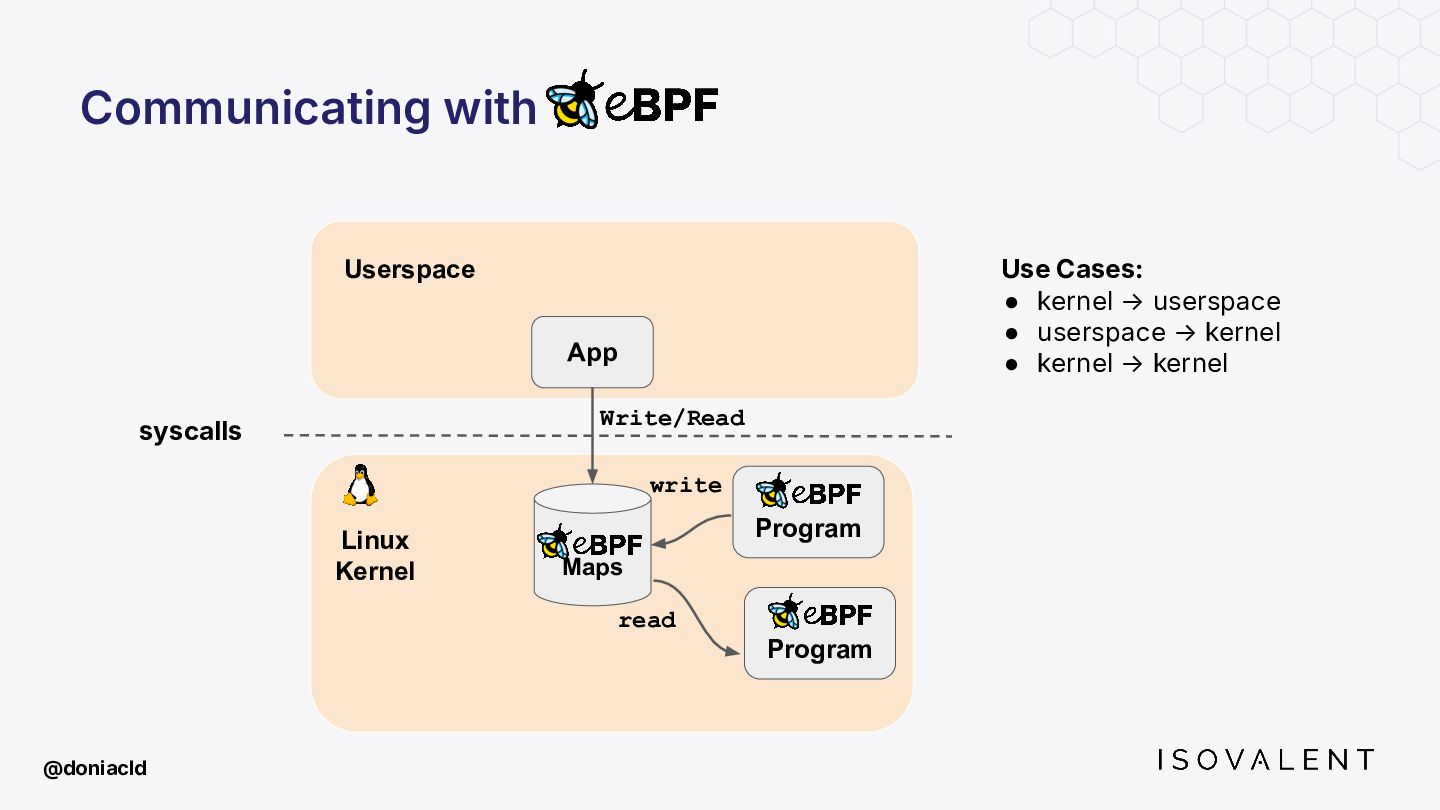
  14. @doniacld App Linux Kernel Userspace Program syscalls Maps Use Cases:

    • kernel → userspace • userspace → kernel • kernel → kernel Program write read Communicating with Write/Read
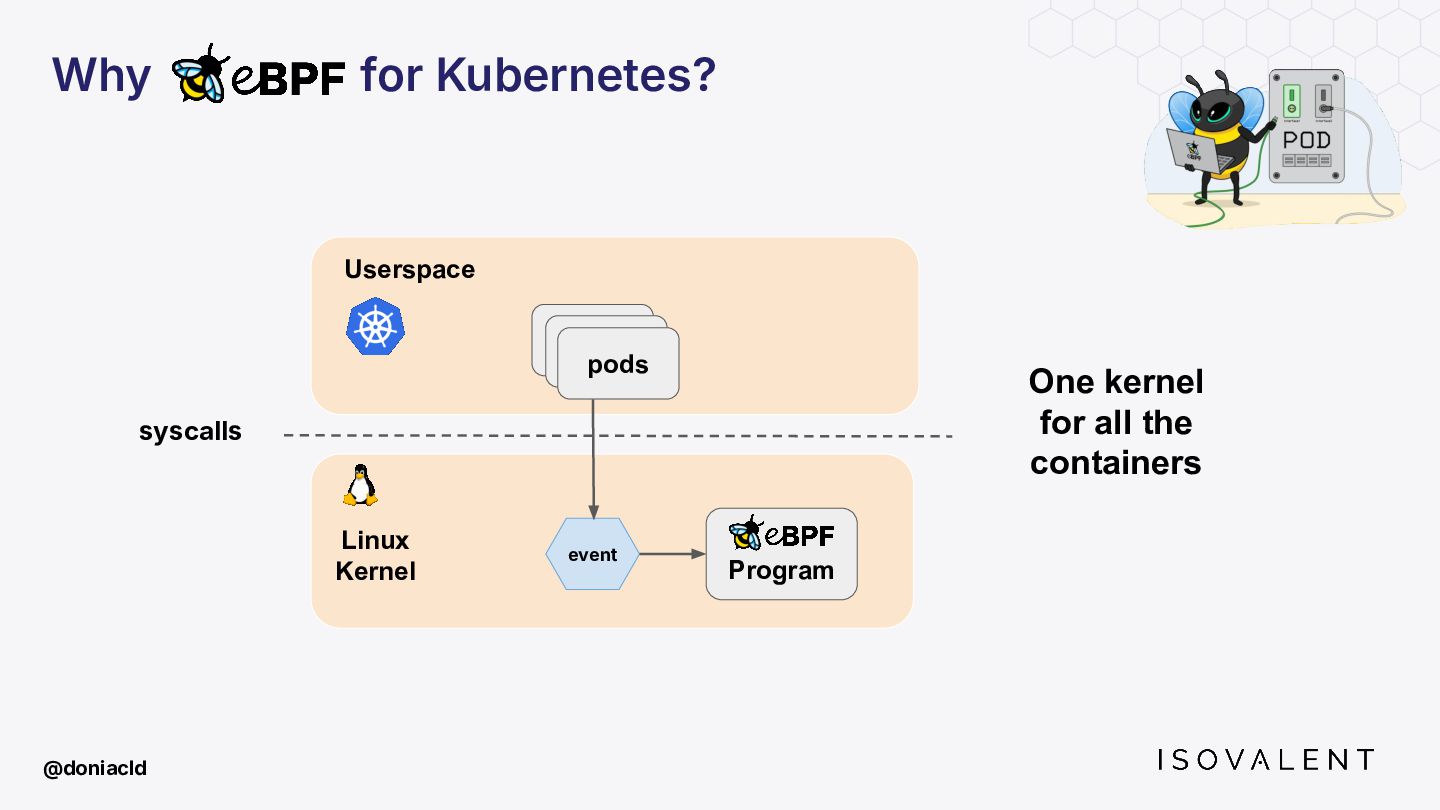
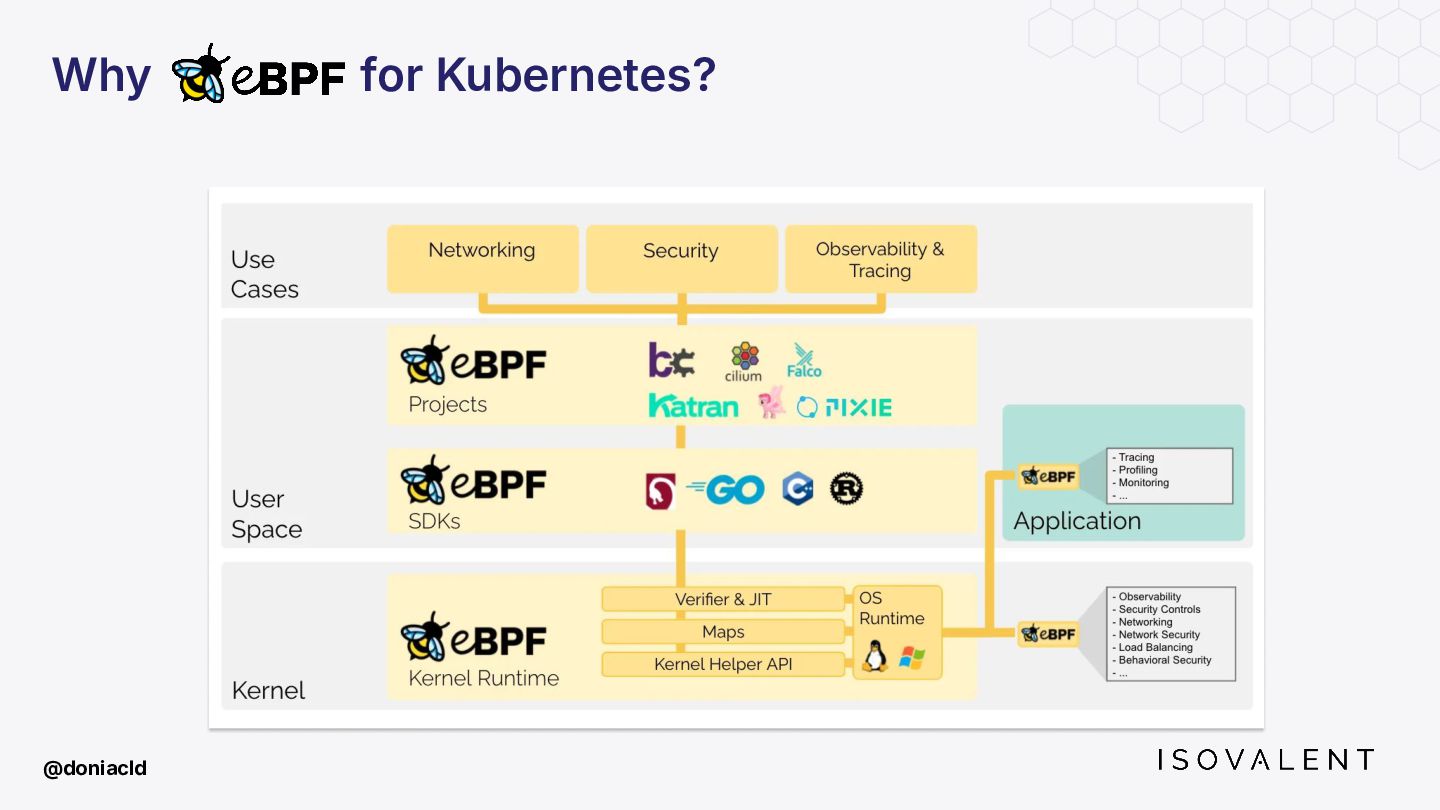
  15. @doniacld Program pod Linux Kernel Userspace event pod pods One

    kernel for all the containers syscalls Why for Kubernetes?
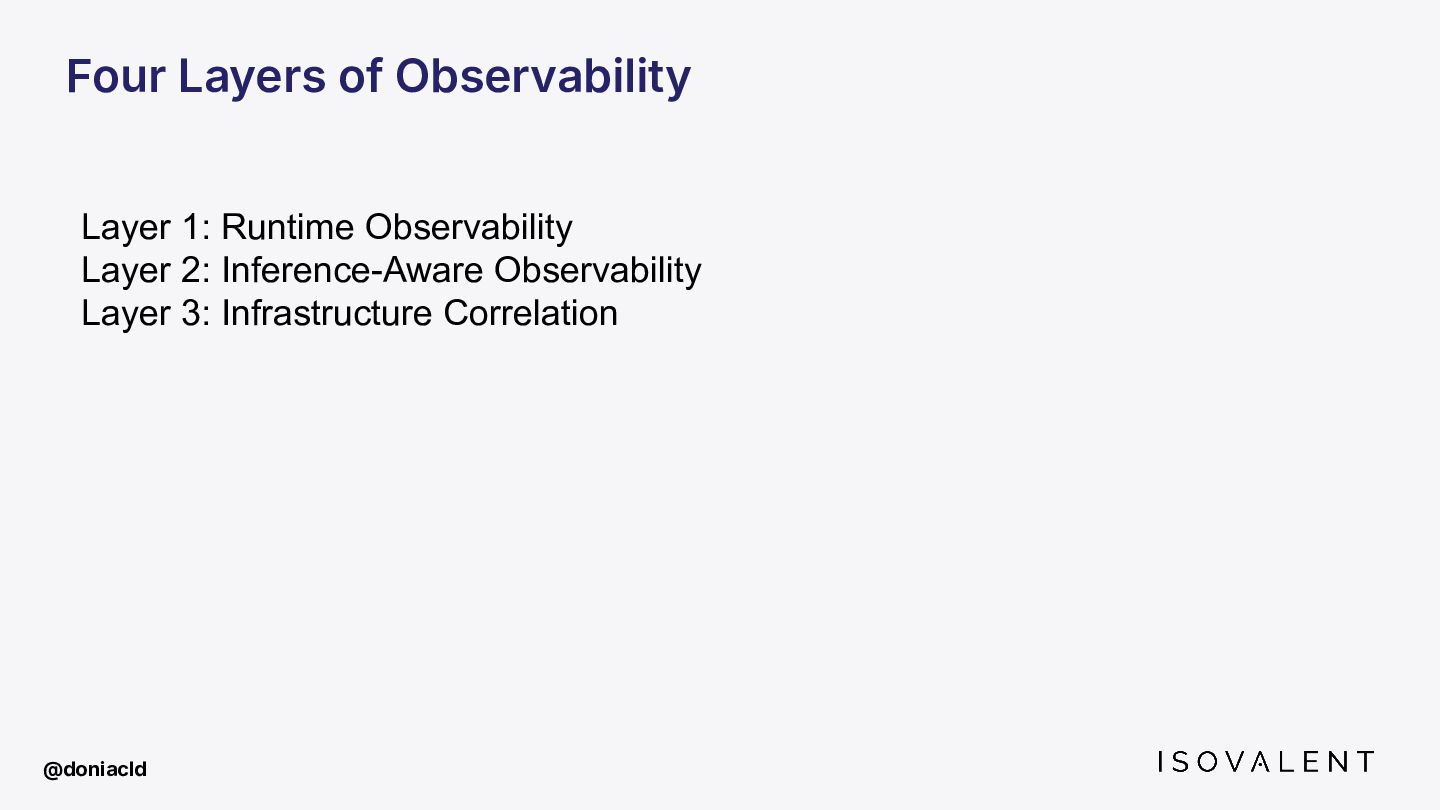
  16. Four Layers of Observability Layer 1: Runtime Observability Layer 2:

    Inference-Aware Observability Layer 3: Infrastructure Correlation @doniacld
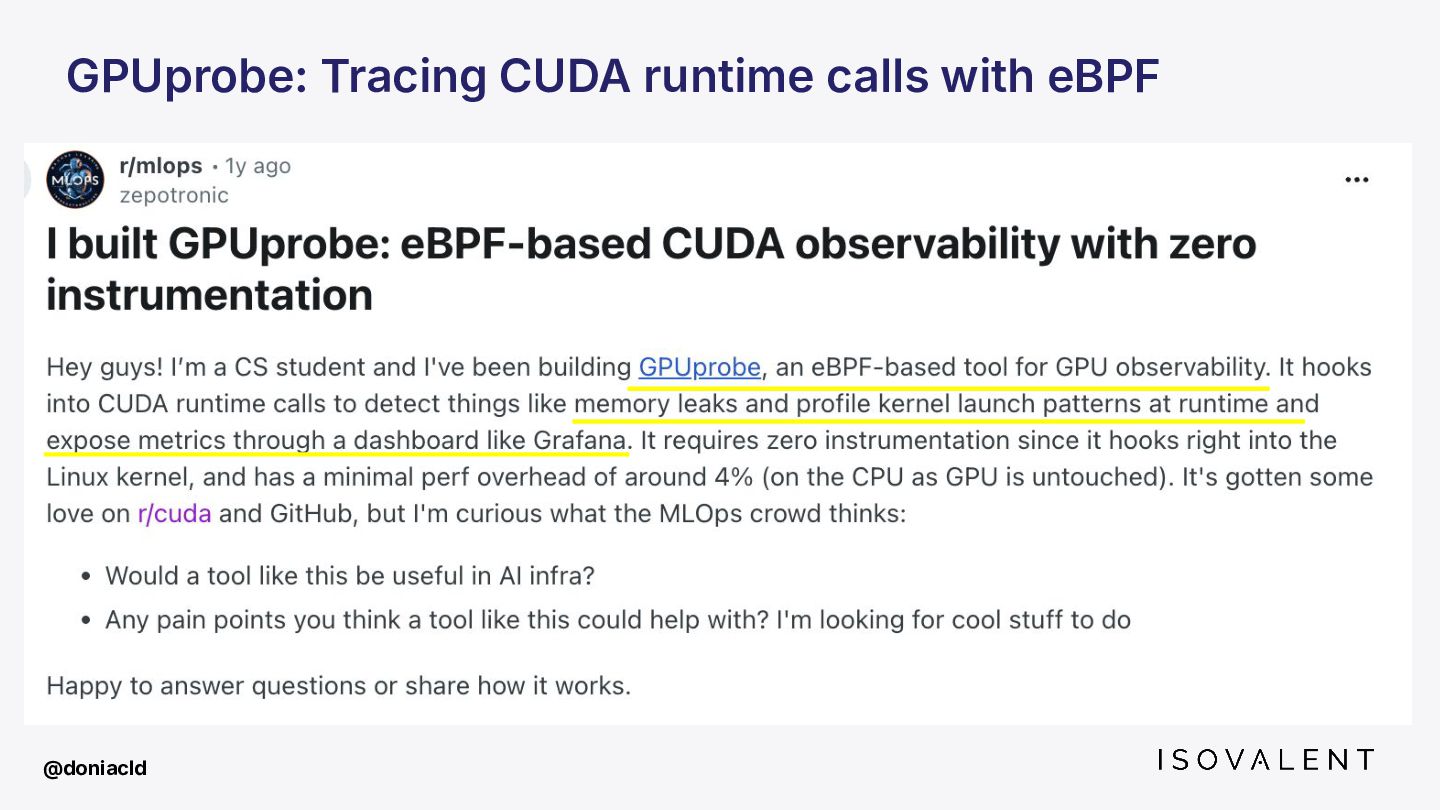
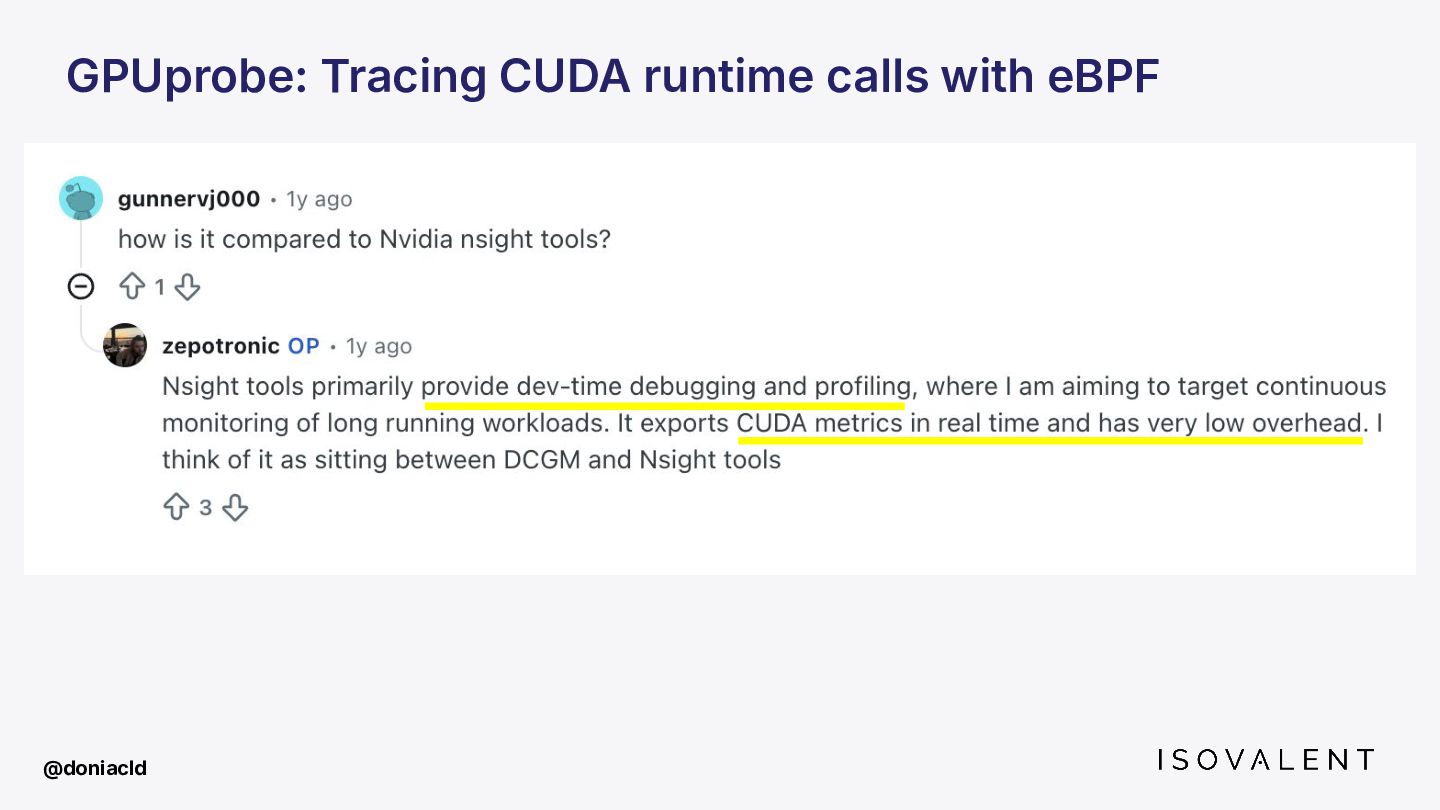
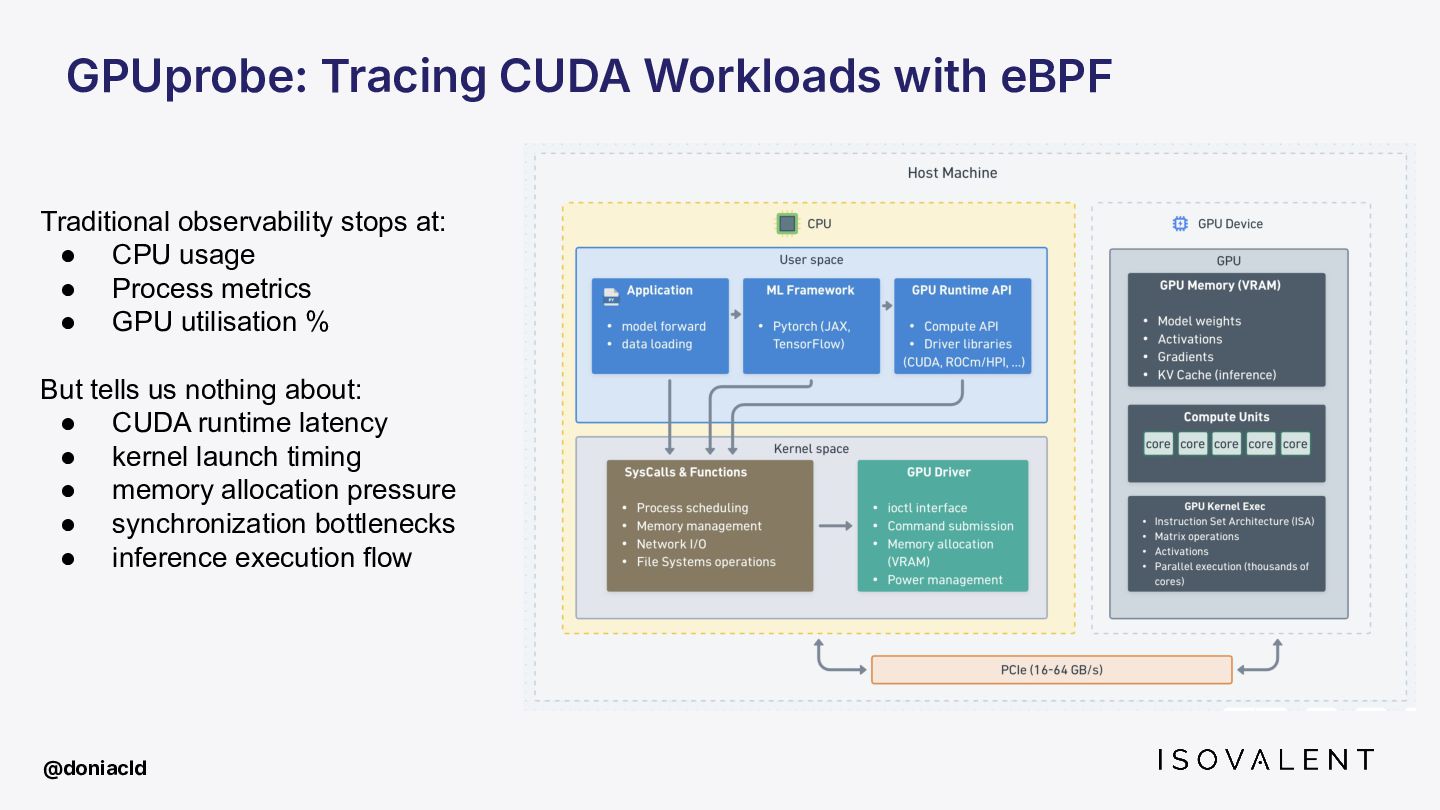
  17. GPUprobe: Tracing CUDA Workloads with eBPF Traditional observability stops at:

    • CPU usage • Process metrics • GPU utilisation % But tells us nothing about: • CUDA runtime latency • kernel launch timing • memory allocation pressure • synchronization bottlenecks • inference execution flow @doniacld
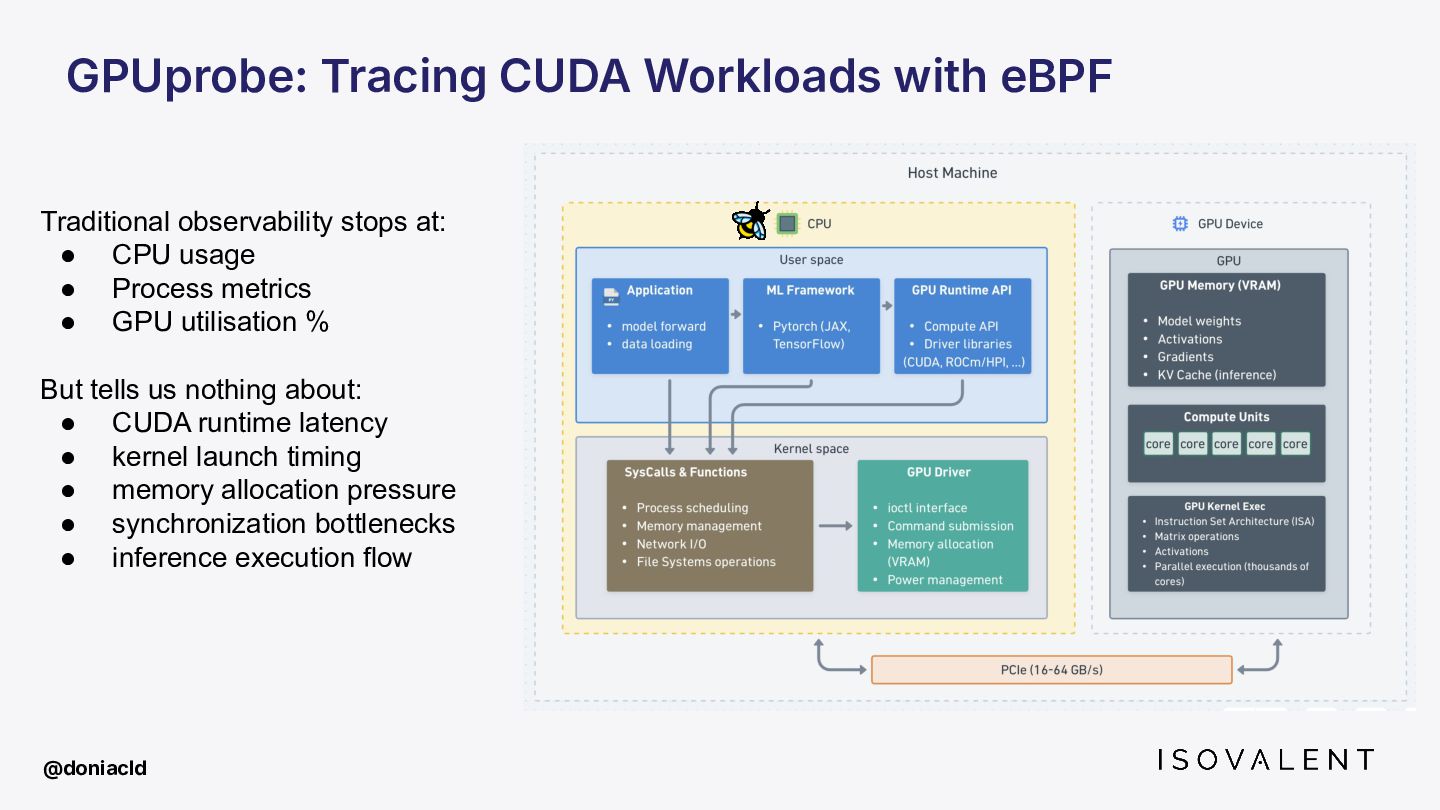
  18. GPUprobe: Tracing CUDA Workloads with eBPF Traditional observability stops at:

    • CPU usage • Process metrics • GPU utilisation % But tells us nothing about: • CUDA runtime latency • kernel launch timing • memory allocation pressure • synchronization bottlenecks • inference execution flow @doniacld
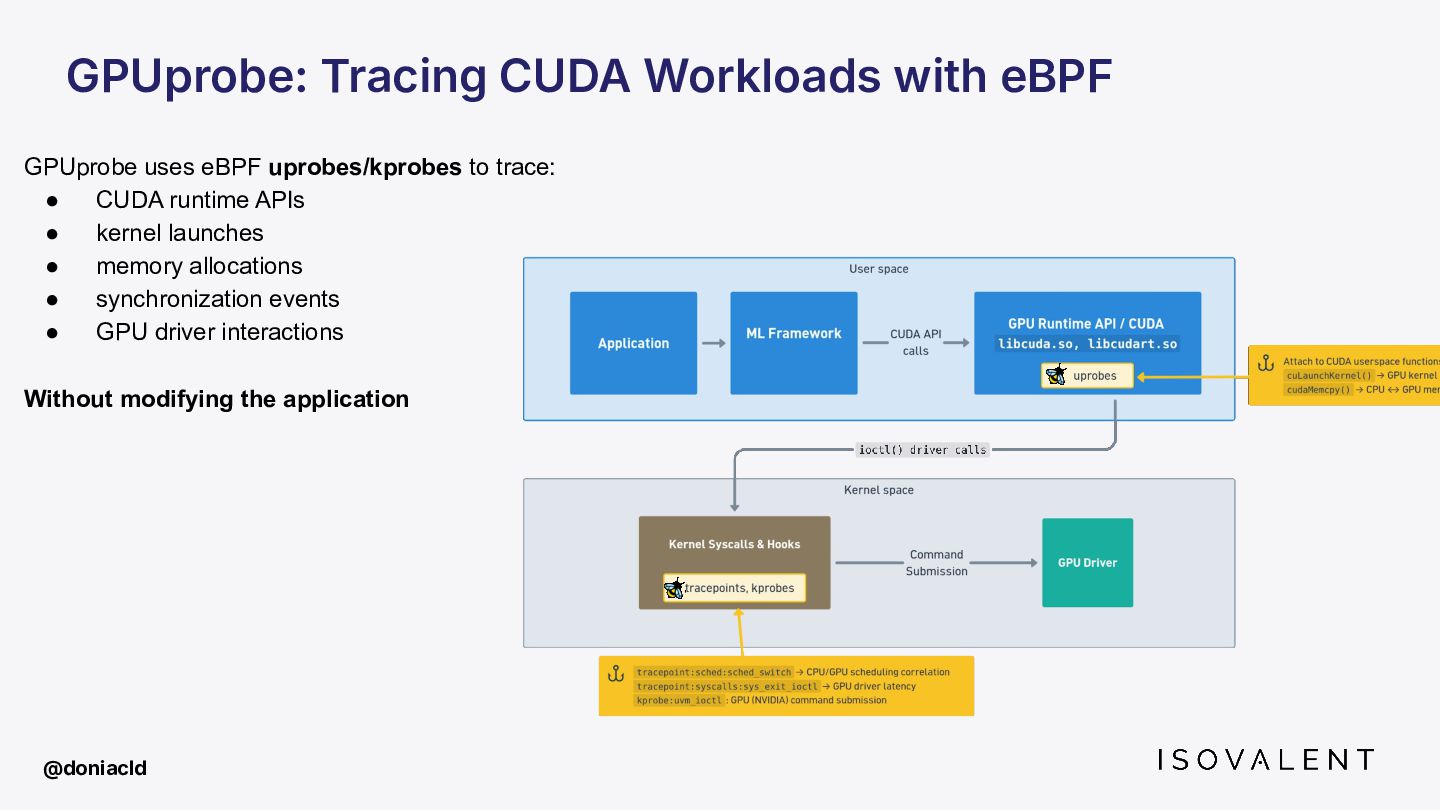
  19. GPUprobe: Tracing CUDA Workloads with eBPF GPUprobe uses eBPF uprobes/kprobes

    to trace: • CUDA runtime APIs • kernel launches • memory allocations • synchronization events • GPU driver interactions Without modifying the application @doniacld
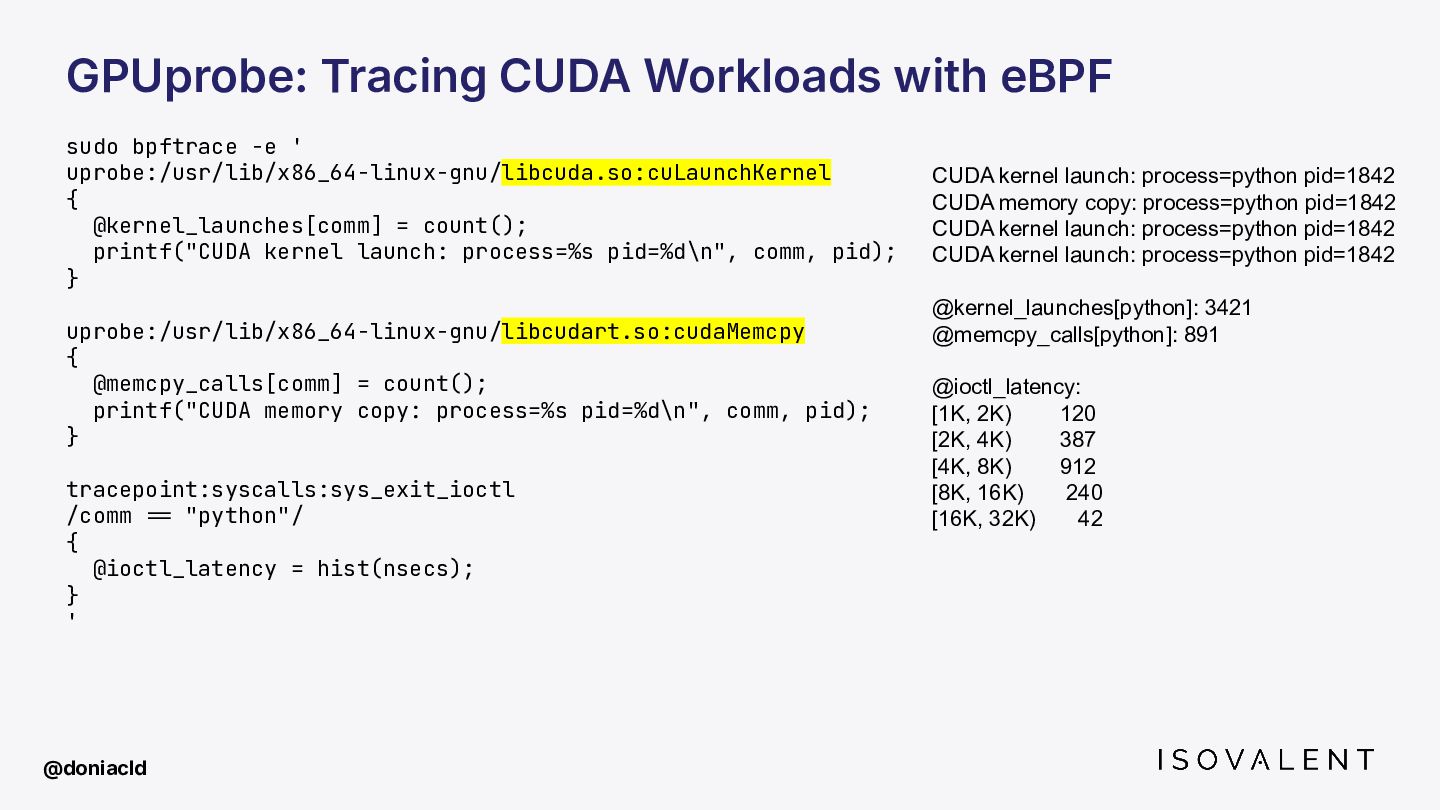
  20. GPUprobe: Tracing CUDA Workloads with eBPF sudo bpftrace -e '

    uprobe:/usr/lib/x86_64-linux-gnu/libcuda.so:cuLaunchKernel { @kernel_launches[comm] = count(); printf("CUDA kernel launch: process=%s pid=%d\n", comm, pid); } uprobe:/usr/lib/x86_64-linux-gnu/libcudart.so:cudaMemcpy { @memcpy_calls[comm] = count(); printf("CUDA memory copy: process=%s pid=%d\n", comm, pid); } tracepoint:syscalls:sys_exit_ioctl /comm -= "python"/ { @ioctl_latency = hist(nsecs); } ' CUDA kernel launch: process=python pid=1842 CUDA memory copy: process=python pid=1842 CUDA kernel launch: process=python pid=1842 CUDA kernel launch: process=python pid=1842 @kernel_launches[python]: 3421 @memcpy_calls[python]: 891 @ioctl_latency: [1K, 2K) 120 [2K, 4K) 387 [4K, 8K) 912 [8K, 16K) 240 [16K, 32K) 42 @doniacld
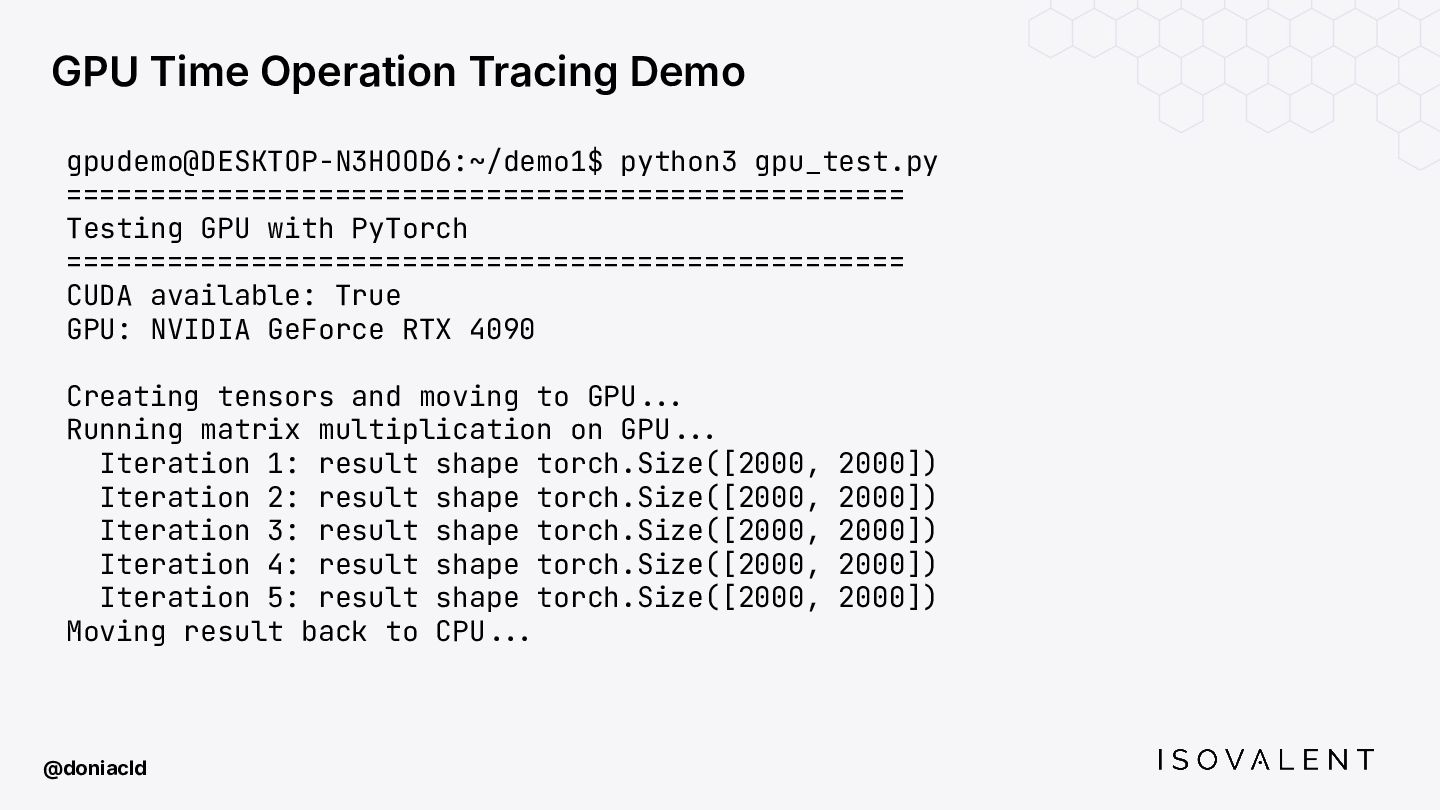
  21. @doniacld GPU Time Operation Tracing Demo gpudemo@DESKTOP-N3HOOD6:~/demo1$ python3 gpu_test.py ==================================================

    Testing GPU with PyTorch ================================================== CUDA available: True GPU: NVIDIA GeForce RTX 4090 Creating tensors and moving to GPU--. Running matrix multiplication on GPU--. Iteration 1: result shape torch.Size([2000, 2000]) Iteration 2: result shape torch.Size([2000, 2000]) Iteration 3: result shape torch.Size([2000, 2000]) Iteration 4: result shape torch.Size([2000, 2000]) Iteration 5: result shape torch.Size([2000, 2000]) Moving result back to CPU--.
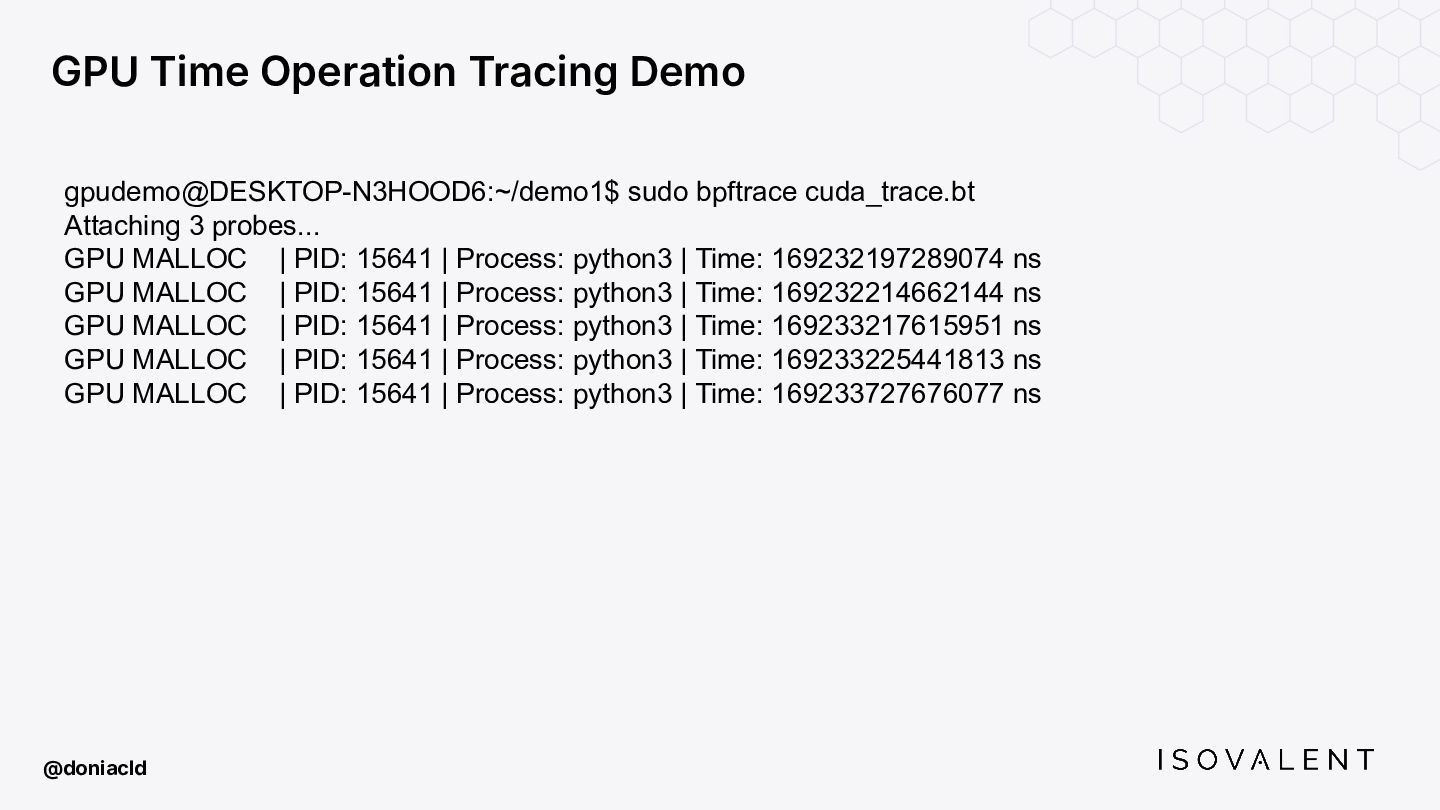
  22. @doniacld GPU Time Operation Tracing Demo gpudemo@DESKTOP-N3HOOD6:~/demo1$ sudo bpftrace cuda_trace.bt

    Attaching 3 probes... GPU MALLOC | PID: 15641 | Process: python3 | Time: 169232197289074 ns GPU MALLOC | PID: 15641 | Process: python3 | Time: 169232214662144 ns GPU MALLOC | PID: 15641 | Process: python3 | Time: 169233217615951 ns GPU MALLOC | PID: 15641 | Process: python3 | Time: 169233225441813 ns GPU MALLOC | PID: 15641 | Process: python3 | Time: 169233727676077 ns
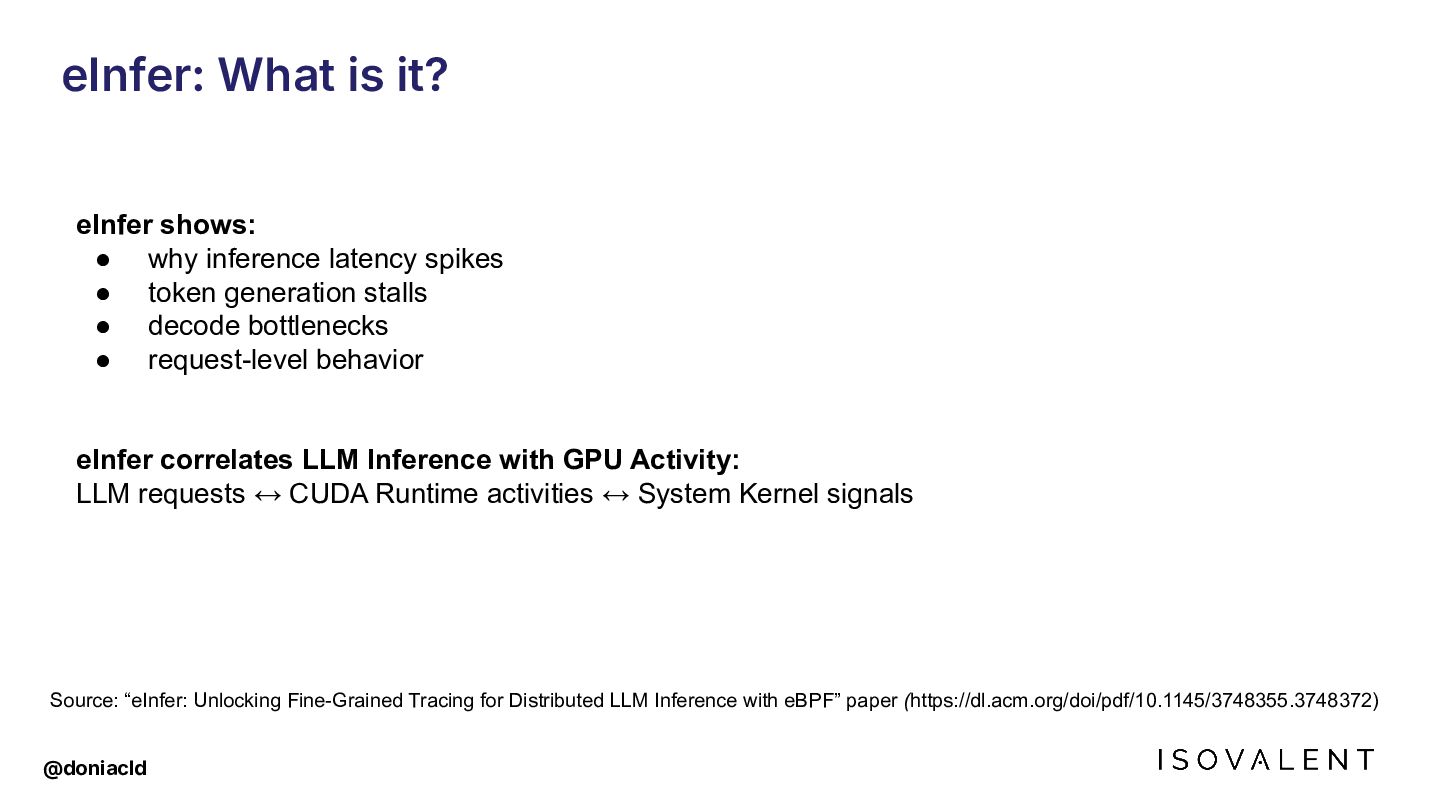
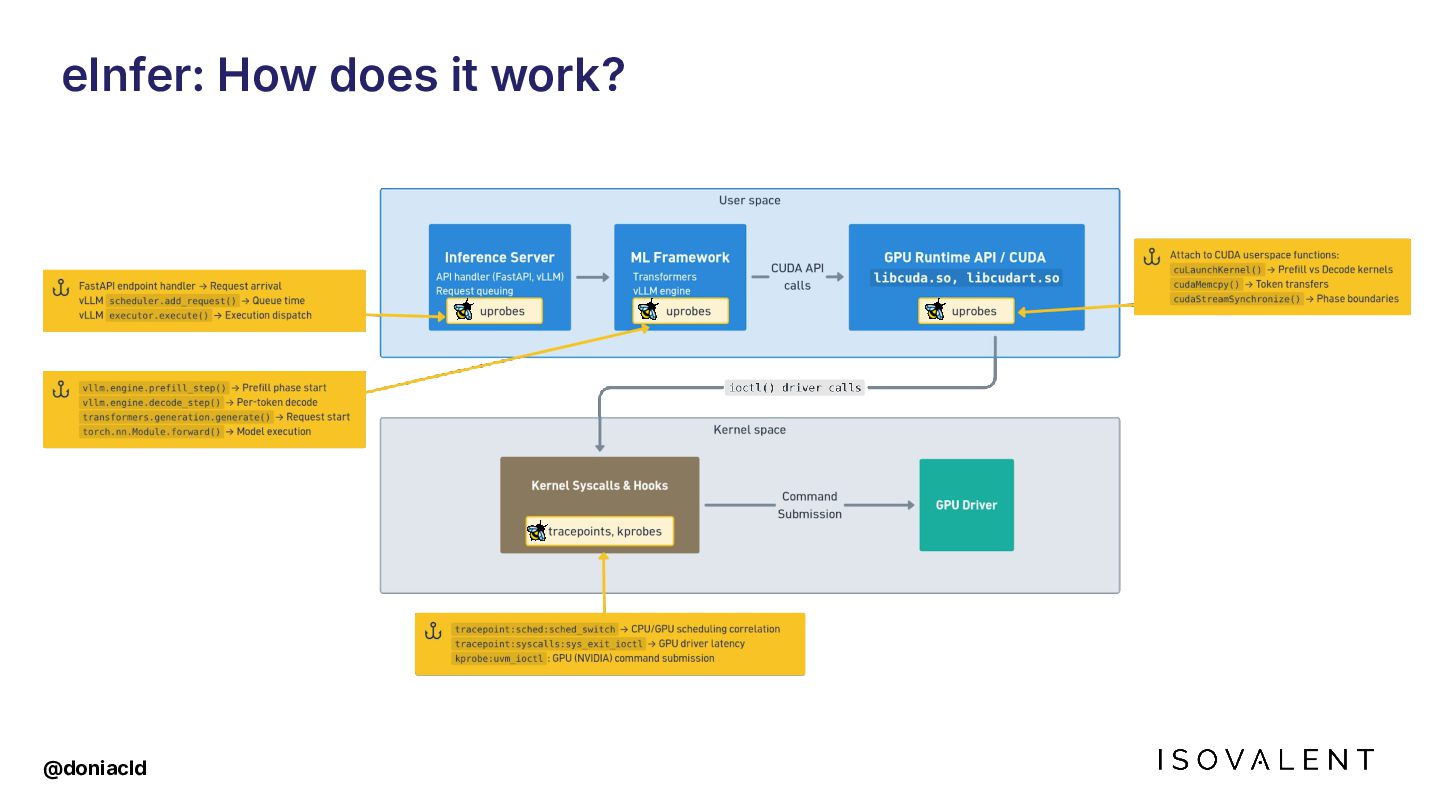
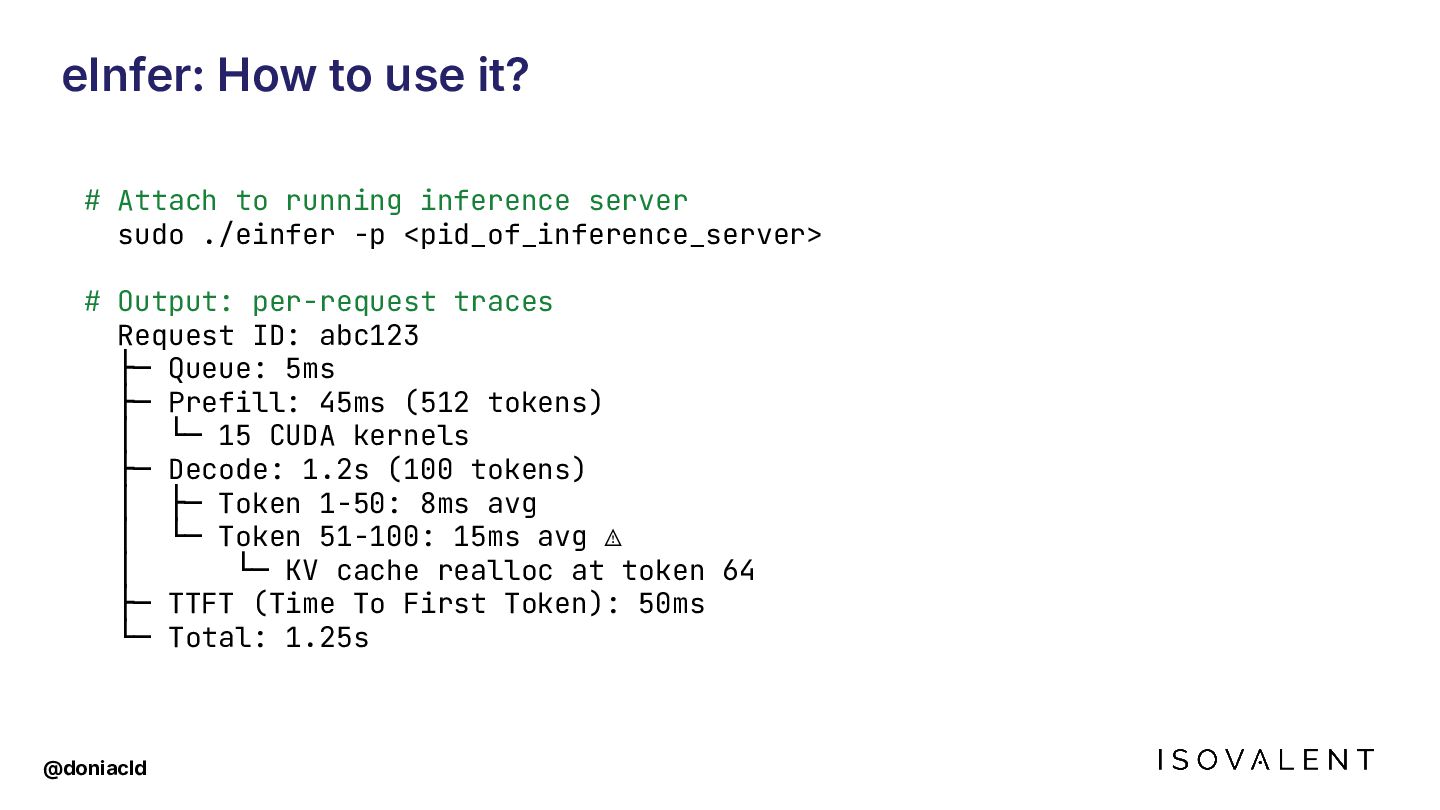
  23. eInfer: What is it? eInfer shows: • why inference latency

    spikes • token generation stalls • decode bottlenecks • request-level behavior Source: “eInfer: Unlocking Fine-Grained Tracing for Distributed LLM Inference with eBPF” paper (https://dl.acm.org/doi/pdf/10.1145/3748355.3748372) eInfer correlates LLM Inference with GPU Activity: LLM requests ↔ CUDA Runtime activities ↔ System Kernel signals @doniacld
  24. eInfer: How to use it? # Attach to running inference

    server sudo ./einfer -p <pid_of_inference_server> # Output: per-request traces Request ID: abc123 ├─ Queue: 5ms ├─ Prefill: 45ms (512 tokens) │ └─ 15 CUDA kernels ├─ Decode: 1.2s (100 tokens) │ ├─ Token 1-50: 8ms avg │ └─ Token 51-100: 15ms avg ⚠ │ └─ KV cache realloc at token 64 ├─ TTFT (Time To First Token): 50ms └─ Total: 1.25s @doniacld
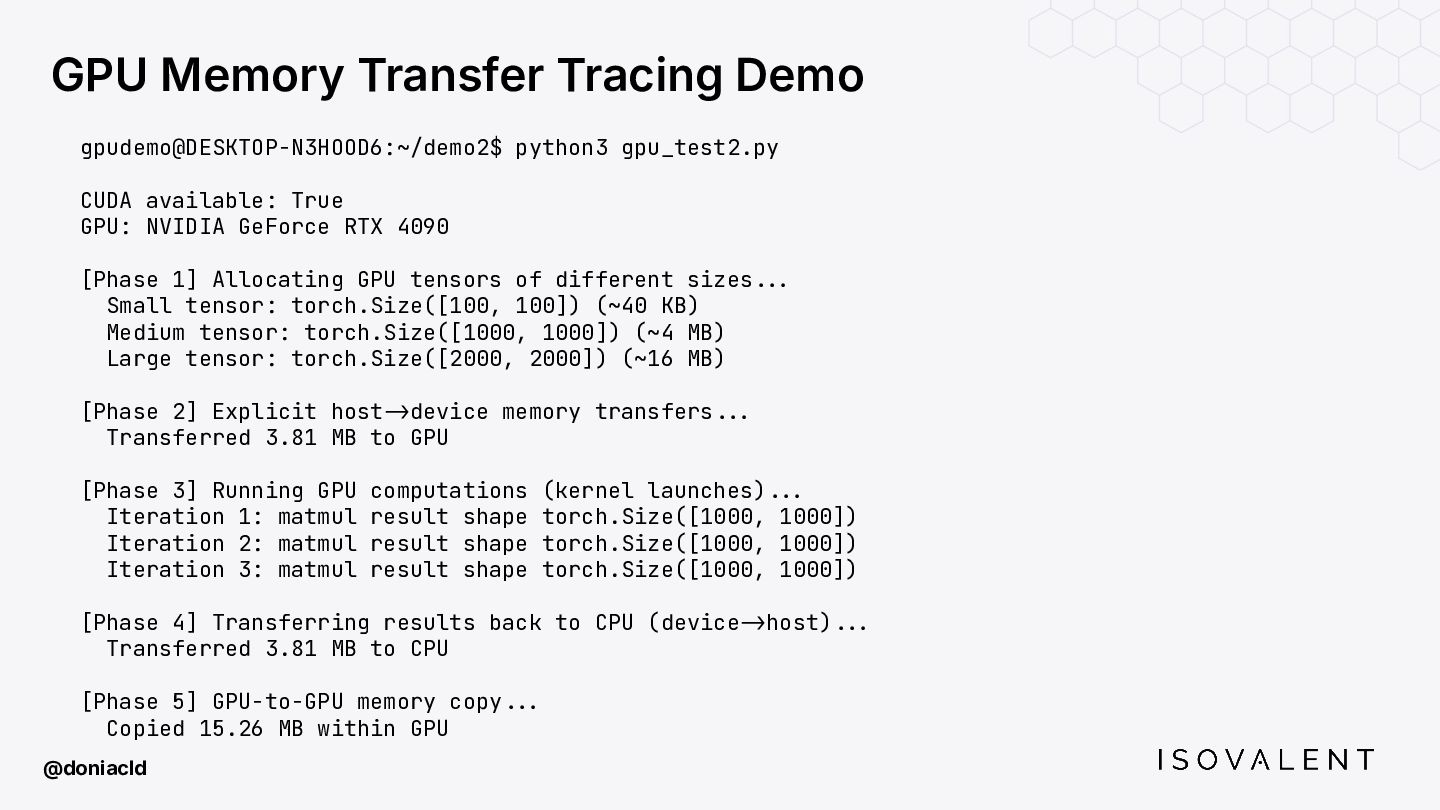
  25. @doniacld GPU Memory Transfer Tracing Demo gpudemo@DESKTOP-N3HOOD6:~/demo2$ python3 gpu_test2.py CUDA

    available: True GPU: NVIDIA GeForce RTX 4090 [Phase 1] Allocating GPU tensors of different sizes--. Small tensor: torch.Size([100, 100]) (~40 KB) Medium tensor: torch.Size([1000, 1000]) (~4 MB) Large tensor: torch.Size([2000, 2000]) (~16 MB) [Phase 2] Explicit host->device memory transfers--. Transferred 3.81 MB to GPU [Phase 3] Running GPU computations (kernel launches)--. Iteration 1: matmul result shape torch.Size([1000, 1000]) Iteration 2: matmul result shape torch.Size([1000, 1000]) Iteration 3: matmul result shape torch.Size([1000, 1000]) [Phase 4] Transferring results back to CPU (device->host)--. Transferred 3.81 MB to CPU [Phase 5] GPU-to-GPU memory copy--. Copied 15.26 MB within GPU
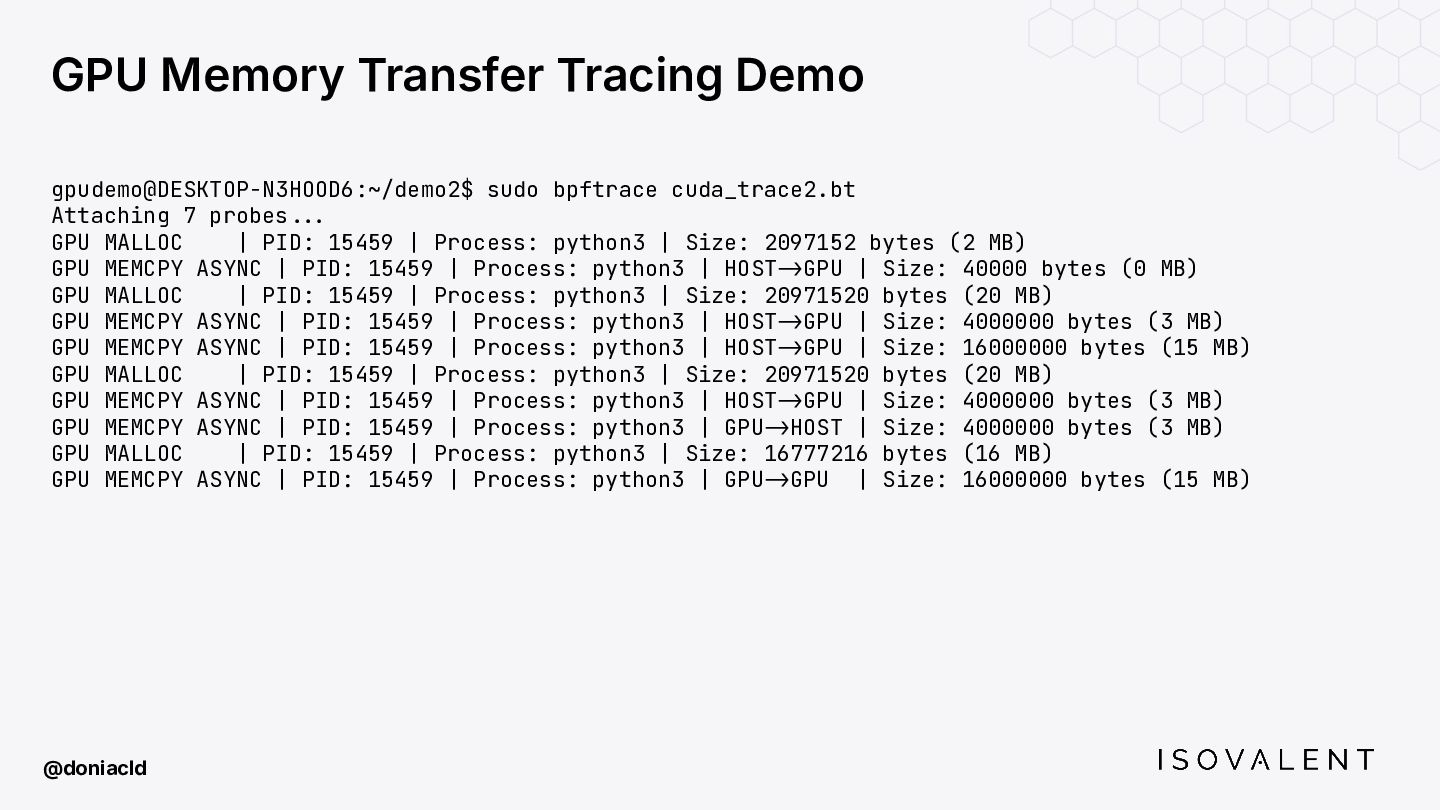
  26. @doniacld GPU Memory Transfer Tracing Demo gpudemo@DESKTOP-N3HOOD6:~/demo2$ sudo bpftrace cuda_trace2.bt

    Attaching 7 probes--. GPU MALLOC | PID: 15459 | Process: python3 | Size: 2097152 bytes (2 MB) GPU MEMCPY ASYNC | PID: 15459 | Process: python3 | HOST->GPU | Size: 40000 bytes (0 MB) GPU MALLOC | PID: 15459 | Process: python3 | Size: 20971520 bytes (20 MB) GPU MEMCPY ASYNC | PID: 15459 | Process: python3 | HOST->GPU | Size: 4000000 bytes (3 MB) GPU MEMCPY ASYNC | PID: 15459 | Process: python3 | HOST->GPU | Size: 16000000 bytes (15 MB) GPU MALLOC | PID: 15459 | Process: python3 | Size: 20971520 bytes (20 MB) GPU MEMCPY ASYNC | PID: 15459 | Process: python3 | HOST->GPU | Size: 4000000 bytes (3 MB) GPU MEMCPY ASYNC | PID: 15459 | Process: python3 | GPU->HOST | Size: 4000000 bytes (3 MB) GPU MALLOC | PID: 15459 | Process: python3 | Size: 16777216 bytes (16 MB) GPU MEMCPY ASYNC | PID: 15459 | Process: python3 | GPU->GPU | Size: 16000000 bytes (15 MB)
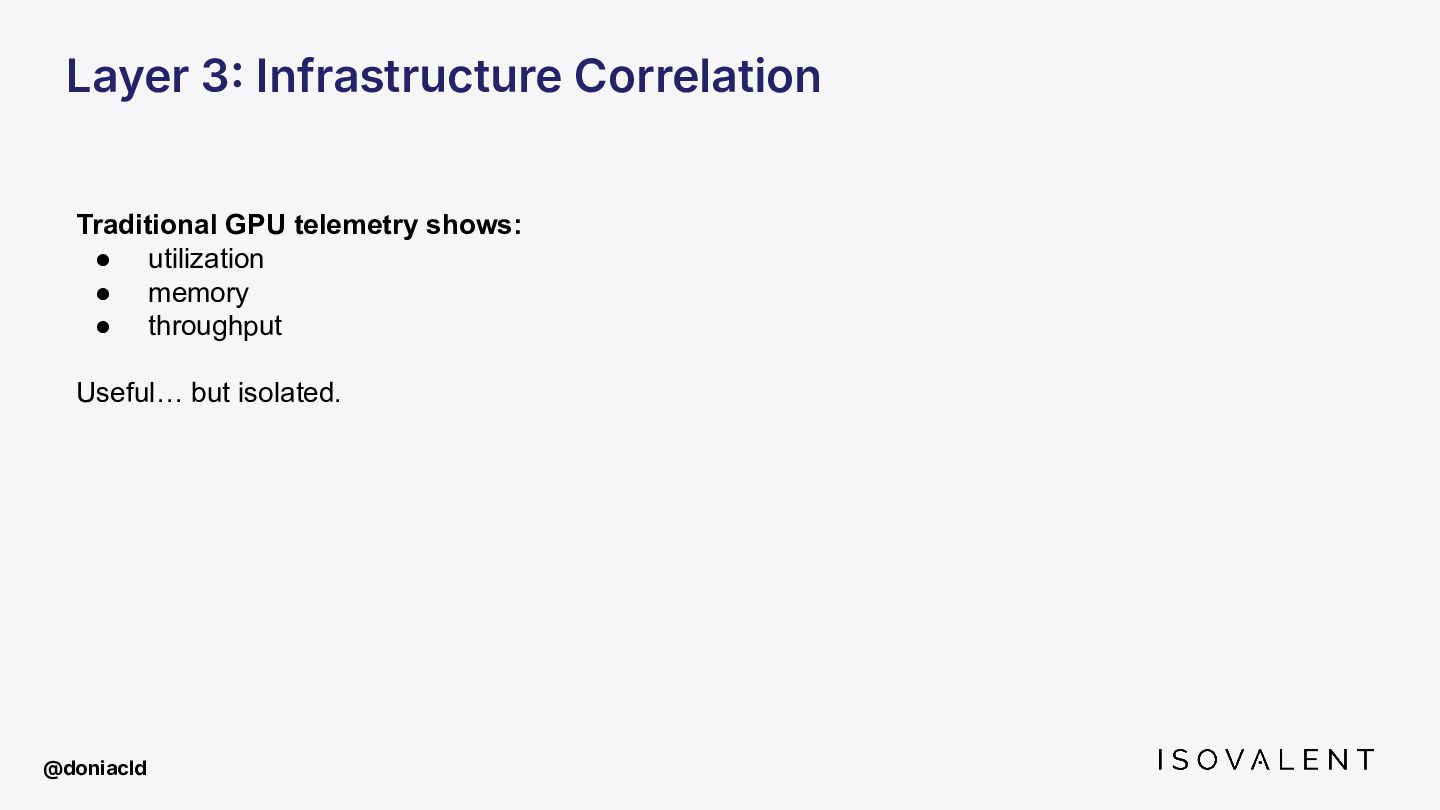
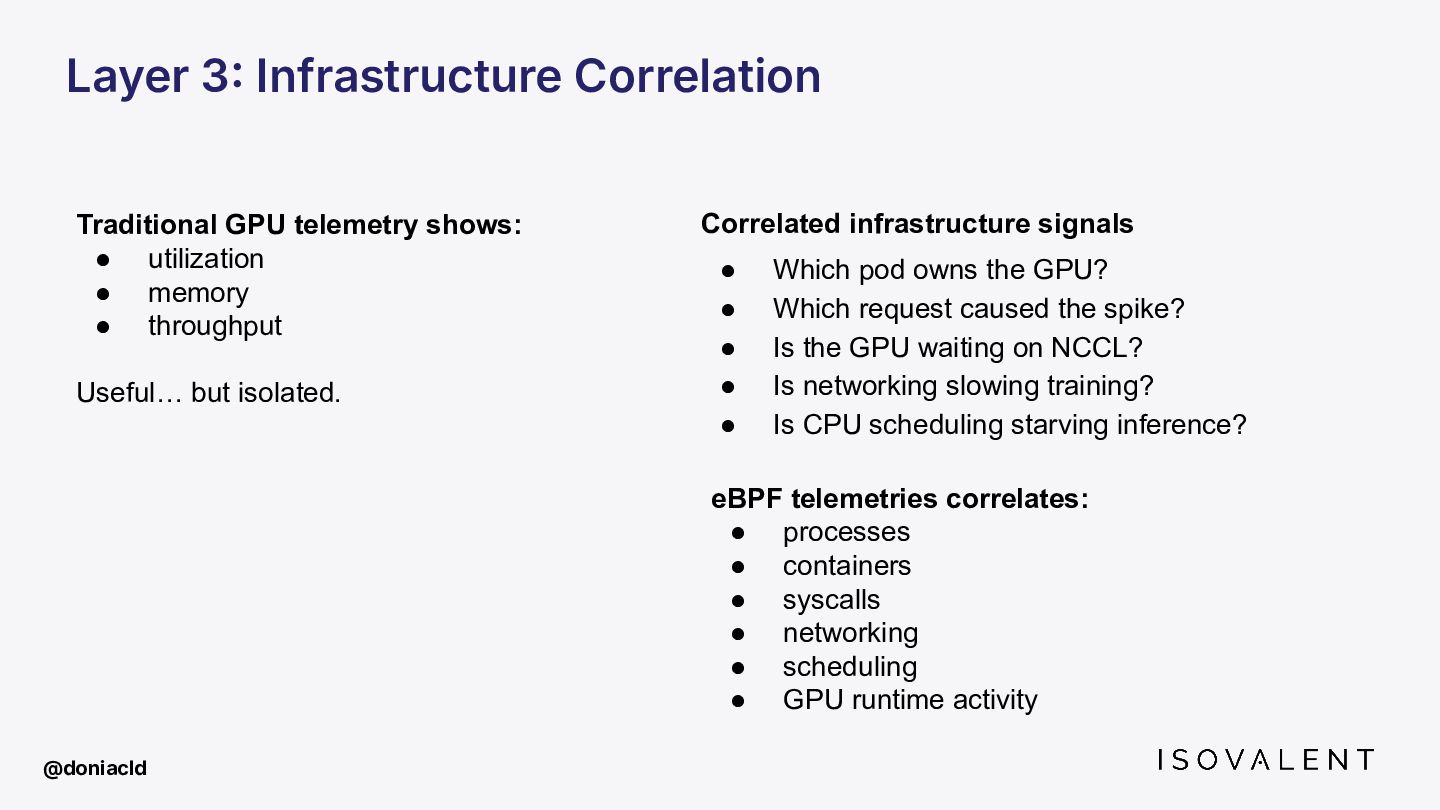
  27. Layer 3 Infrastructure Correlation Traditional GPU telemetry shows: • utilization

    • memory • throughput Useful… but isolated. @doniacld
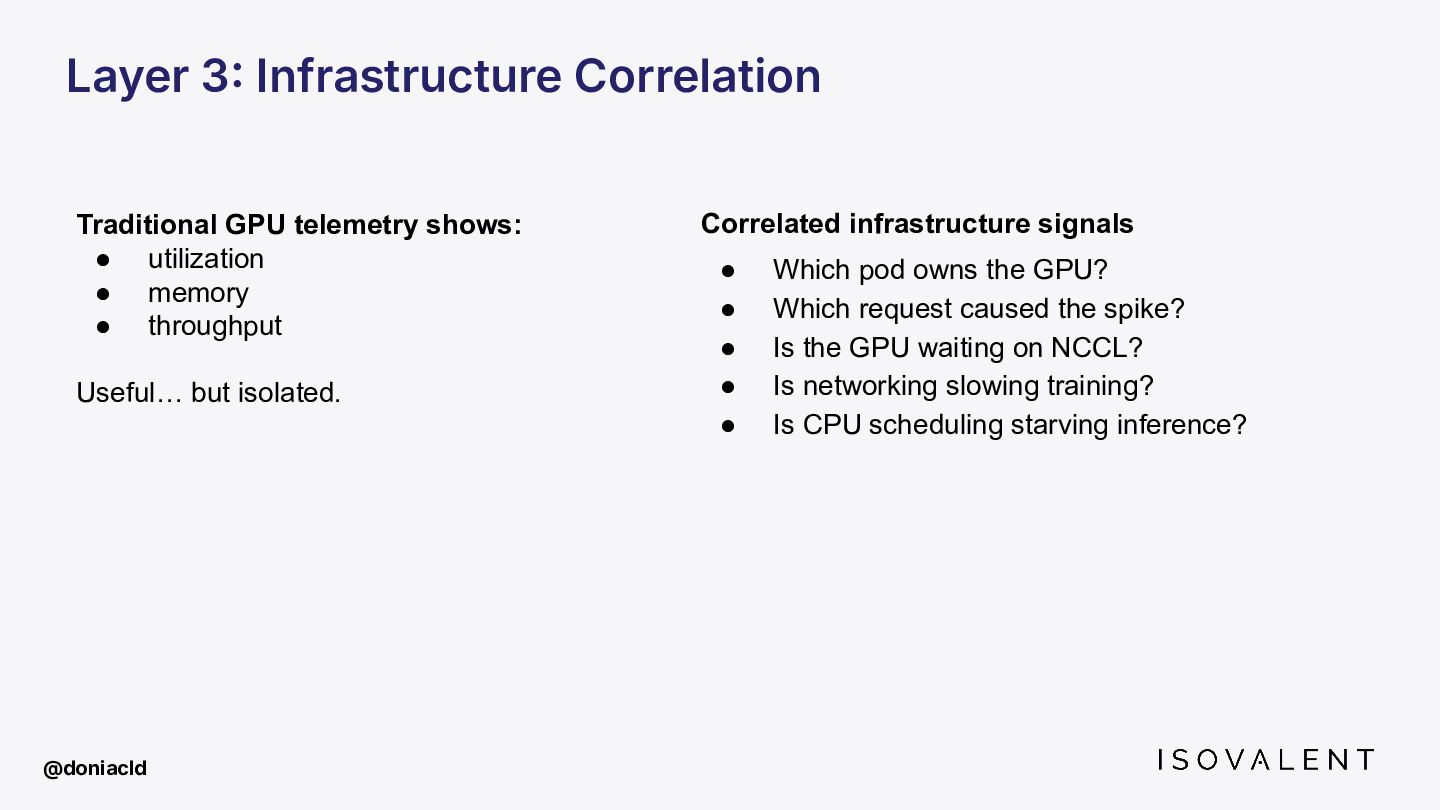
  28. Traditional GPU telemetry shows: • utilization • memory • throughput

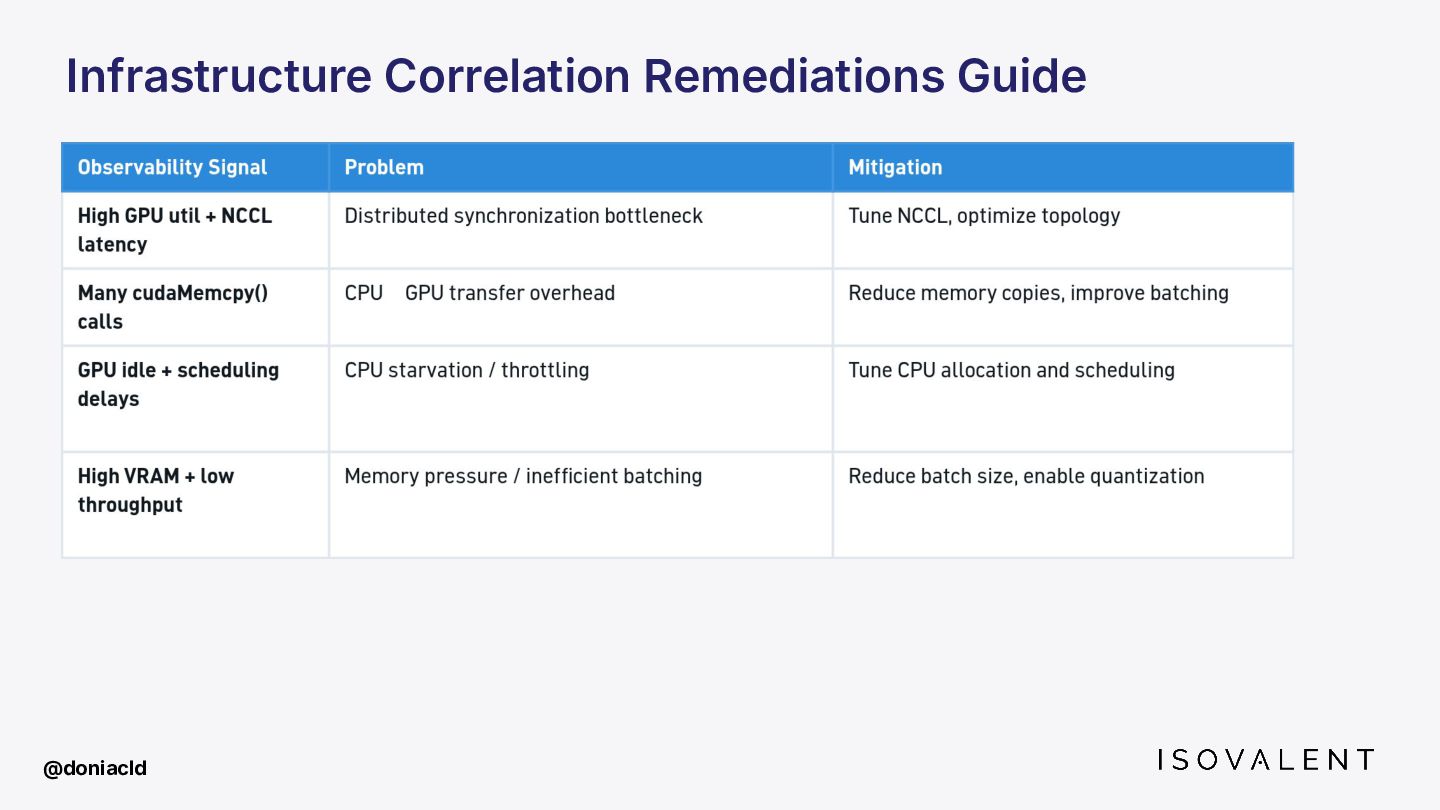
    Useful… but isolated. Correlated infrastructure signals • Which pod owns the GPU? • Which request caused the spike? • Is the GPU waiting on NCCL? • Is networking slowing training? • Is CPU scheduling starving inference? Layer 3 Infrastructure Correlation @doniacld
  29. Traditional GPU telemetry shows: • utilization • memory • throughput

    Useful… but isolated. Correlated infrastructure signals • Which pod owns the GPU? • Which request caused the spike? • Is the GPU waiting on NCCL? • Is networking slowing training? • Is CPU scheduling starving inference? eBPF telemetries correlates: • processes • containers • syscalls • networking • scheduling • GPU runtime activity Layer 3 Infrastructure Correlation @doniacld
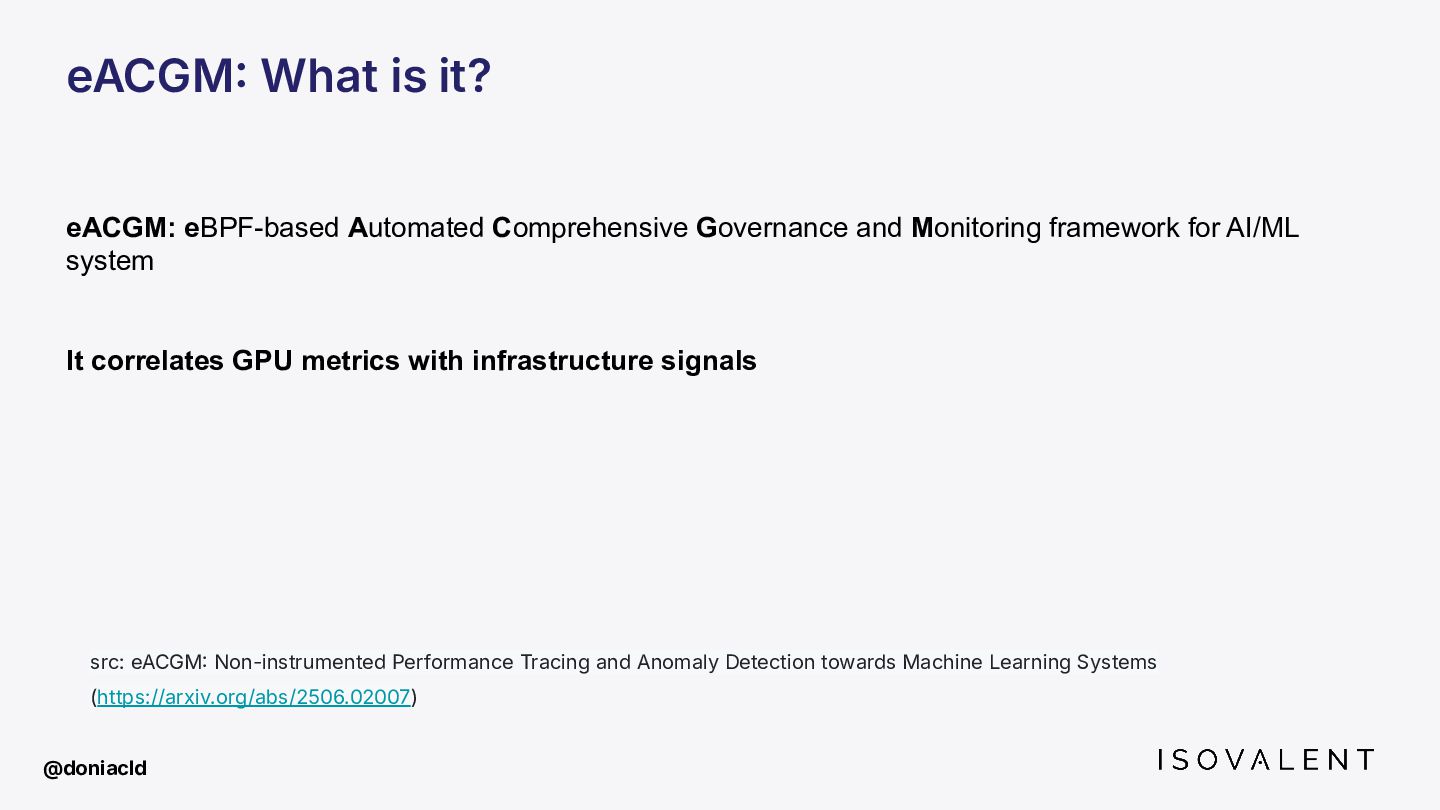
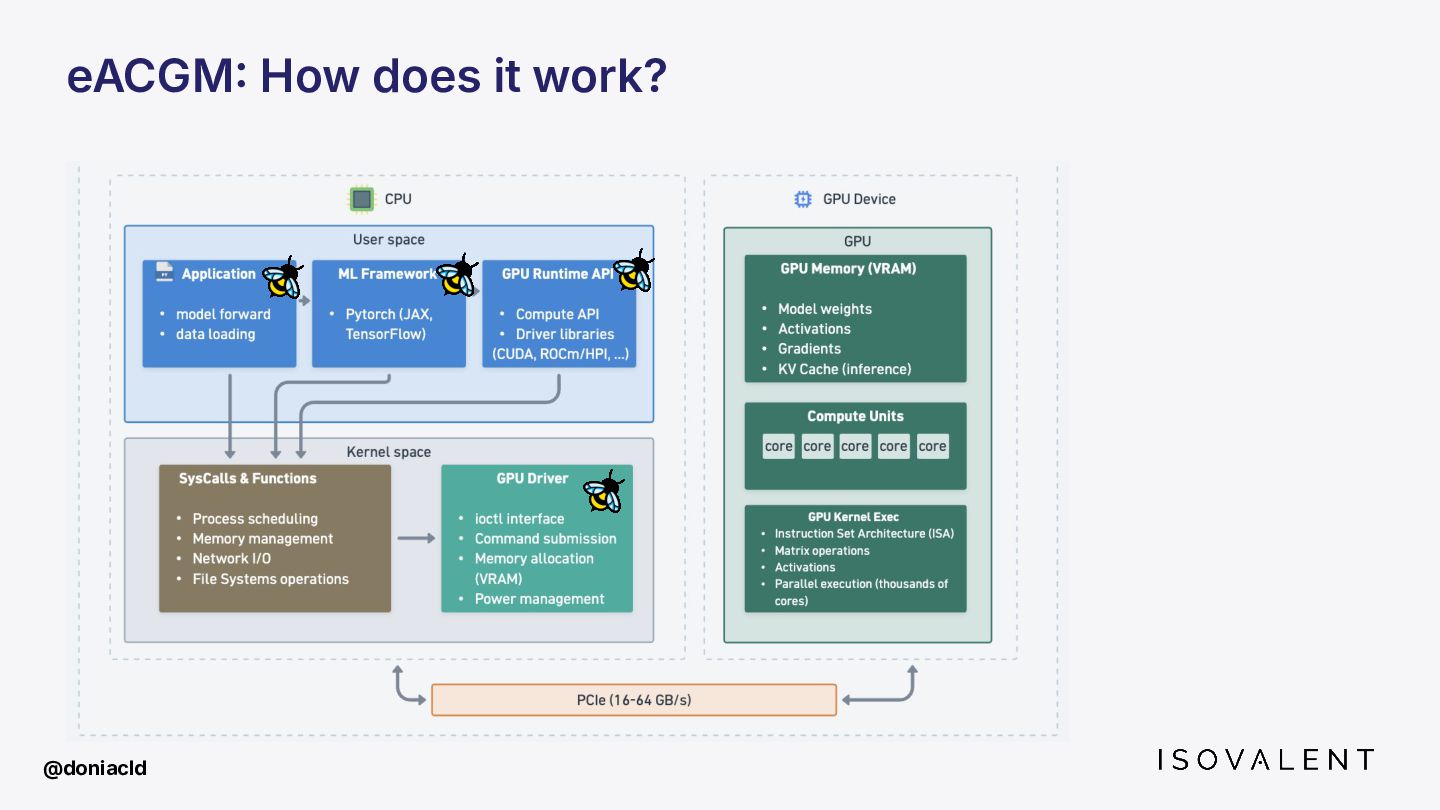
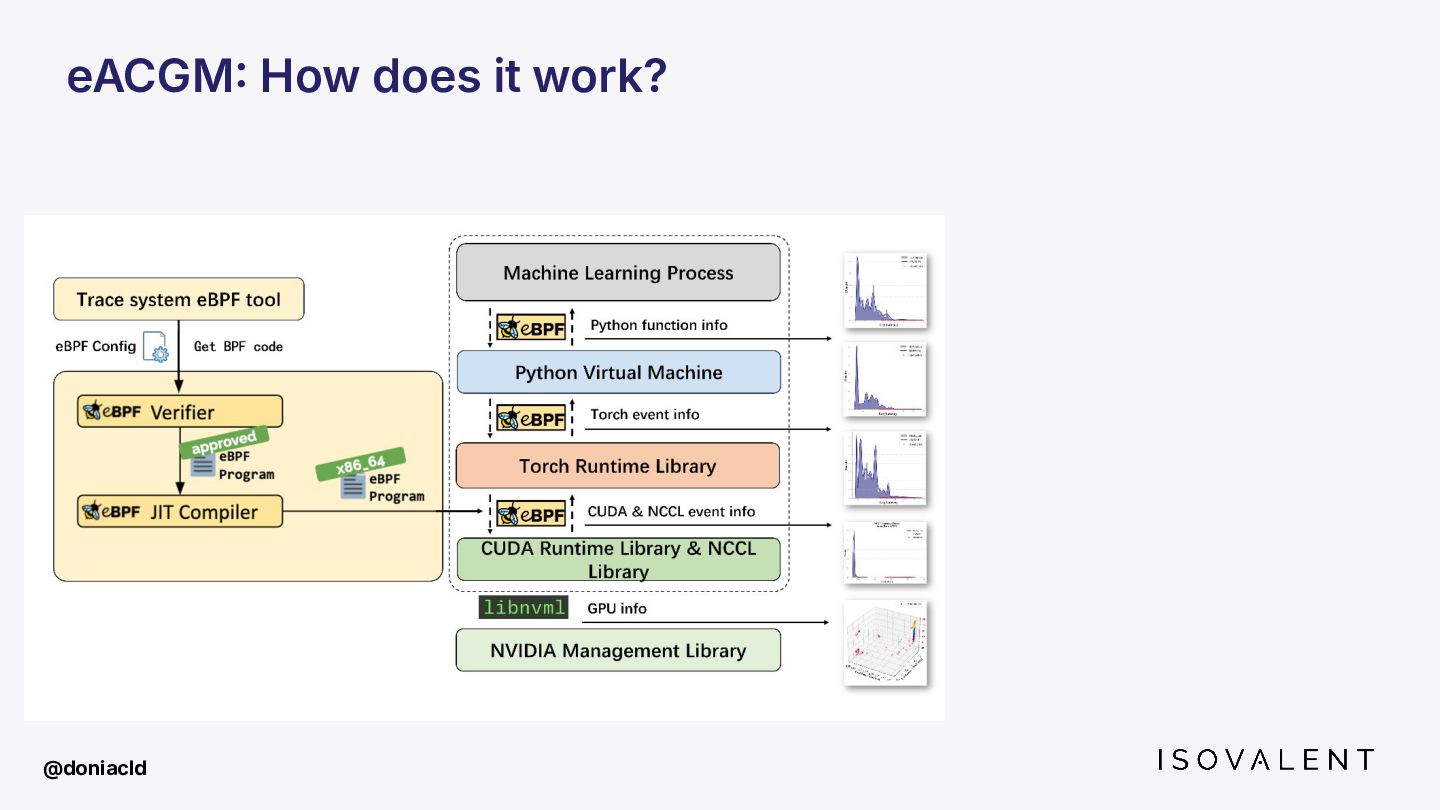
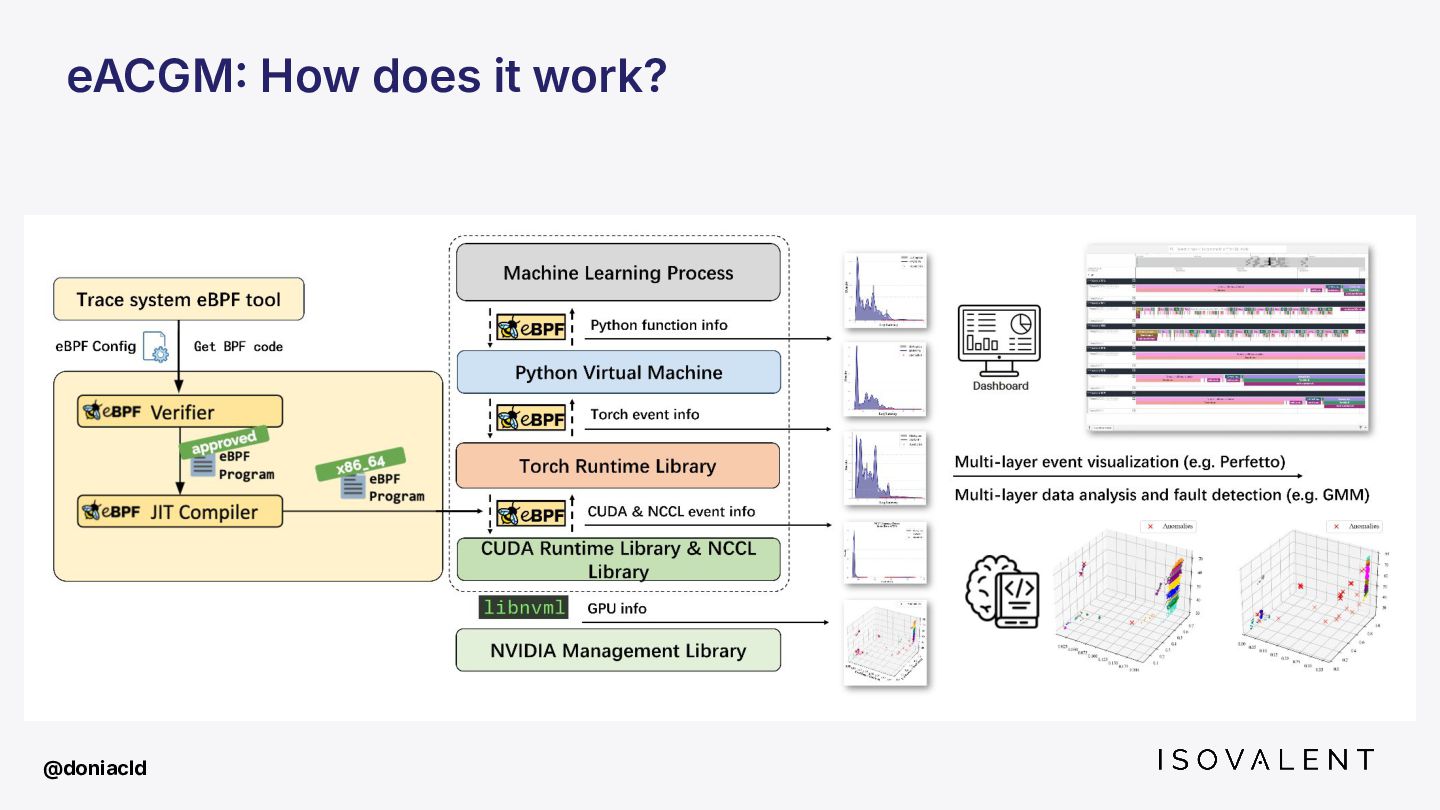
  30. eACGM What is it? eACGM: eBPF-based Automated Comprehensive Governance and

    Monitoring framework for AI/ML system It correlates GPU metrics with infrastructure signals src: eACGM Non-instrumented Performance Tracing and Anomaly Detection towards Machine Learning Systems (https://arxiv.org/abs/2506.02007) @doniacld
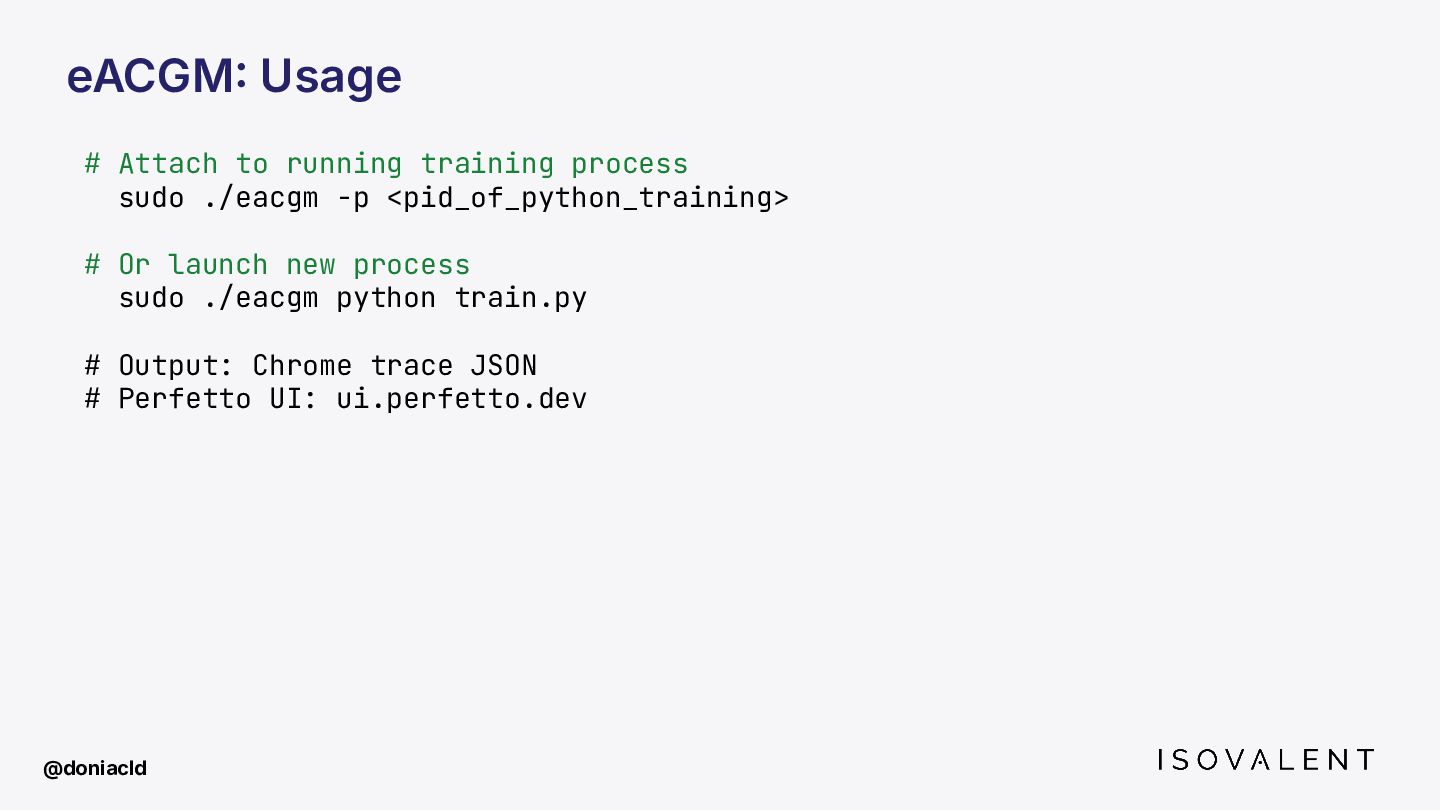
  31. eACGM Usage # Attach to running training process sudo ./eacgm

    -p <pid_of_python_training> # Or launch new process sudo ./eacgm python train.py # Output: Chrome trace JSON # Perfetto UI: ui.perfetto.dev @doniacld
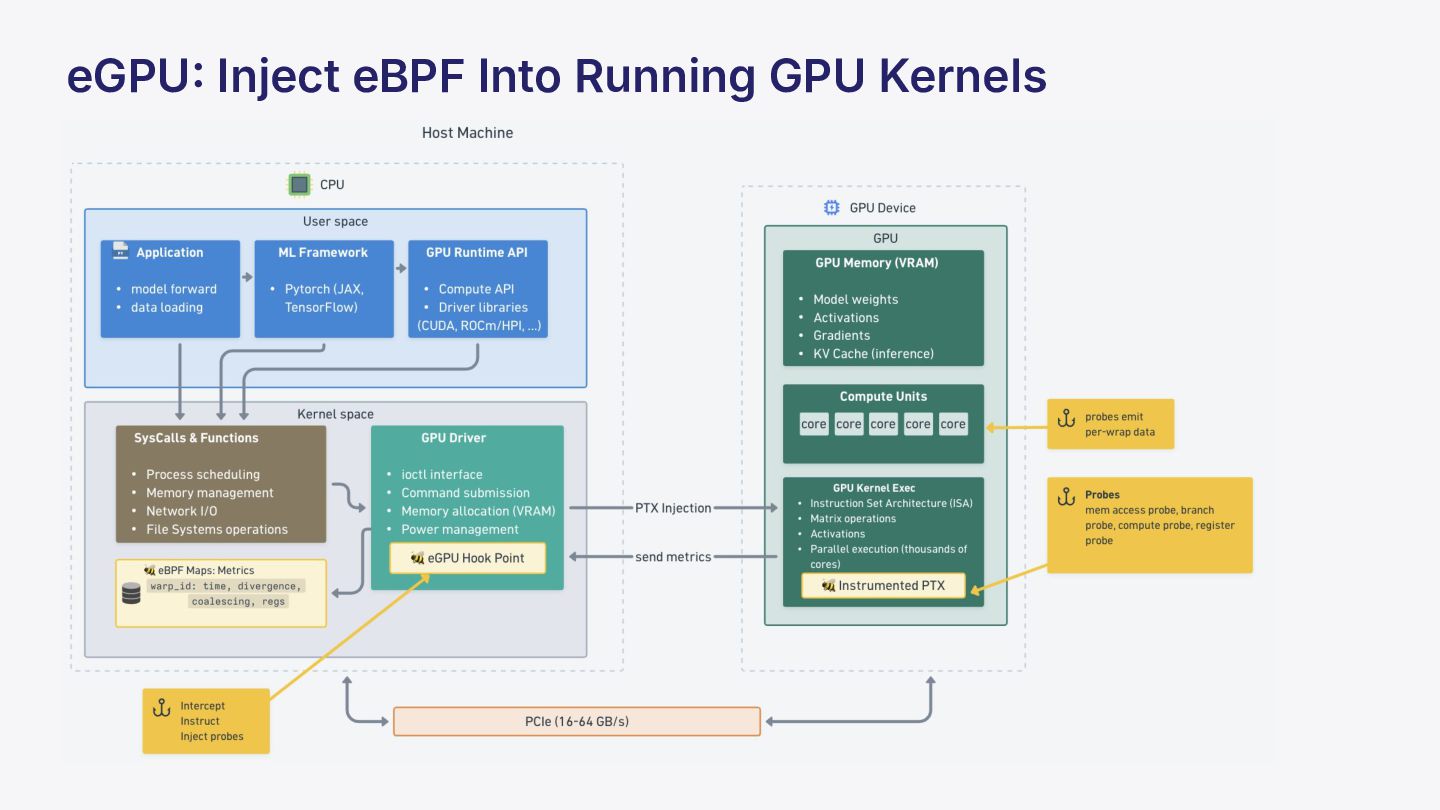
  32. eGPU Inject eBPF Into Running GPU Kernels Injects eBPF-like bytecode

    directly into GPU kernel execution Technique: PTX Injection • PTX = NVIDIA's intermediate GPU assembly language • eGPU translates eBPF → PTX • Injects instrumentation into running CUDA kernels
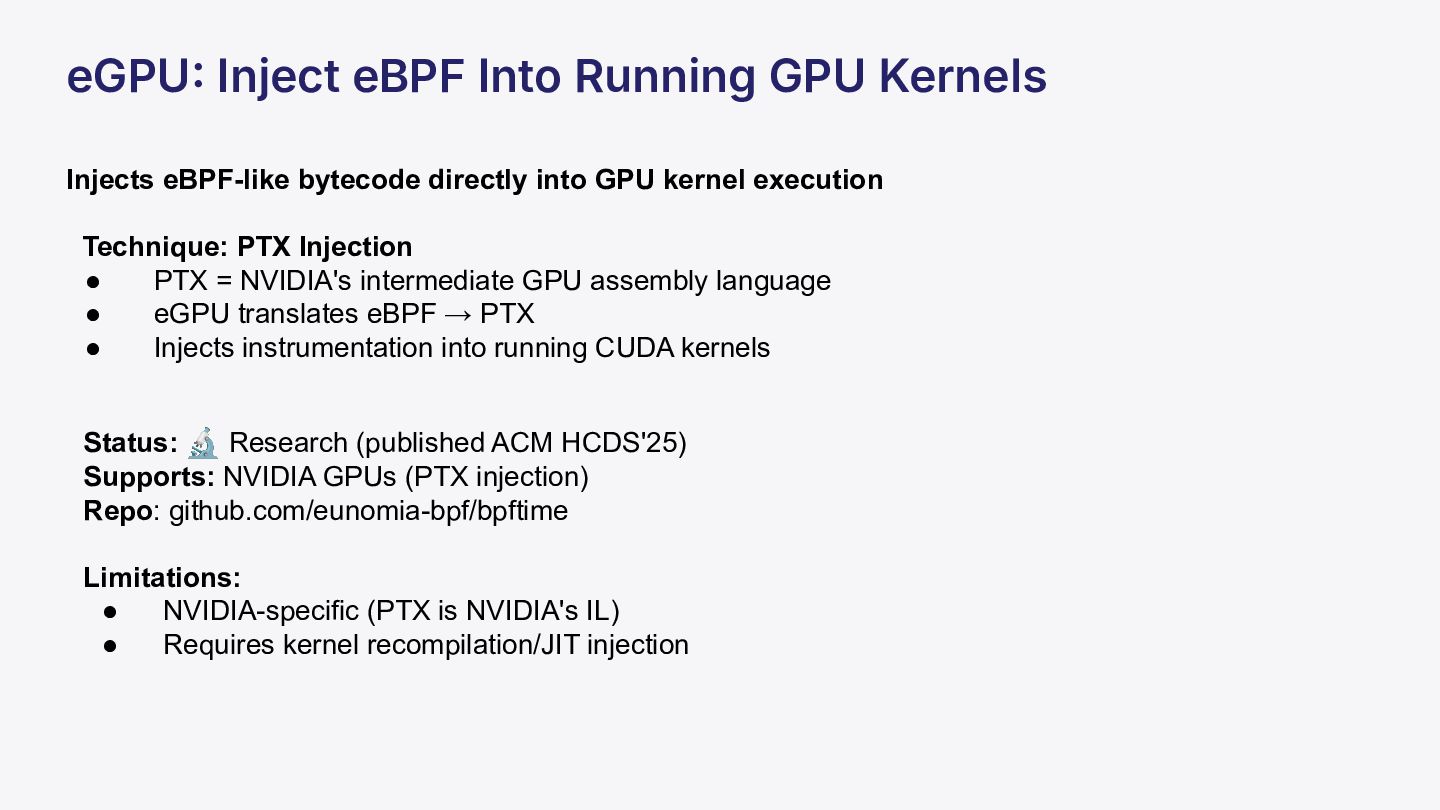
  33. eGPU Inject eBPF Into Running GPU Kernels Injects eBPF-like bytecode

    directly into GPU kernel execution Technique: PTX Injection • PTX = NVIDIA's intermediate GPU assembly language • eGPU translates eBPF → PTX • Injects instrumentation into running CUDA kernels Status: 🔬 Research (published ACM HCDS'25) Supports: NVIDIA GPUs (PTX injection) Repo: github.com/eunomia-bpf/bpftime Limitations: • NVIDIA-specific (PTX is NVIDIA's IL) • Requires kernel recompilation/JIT injection
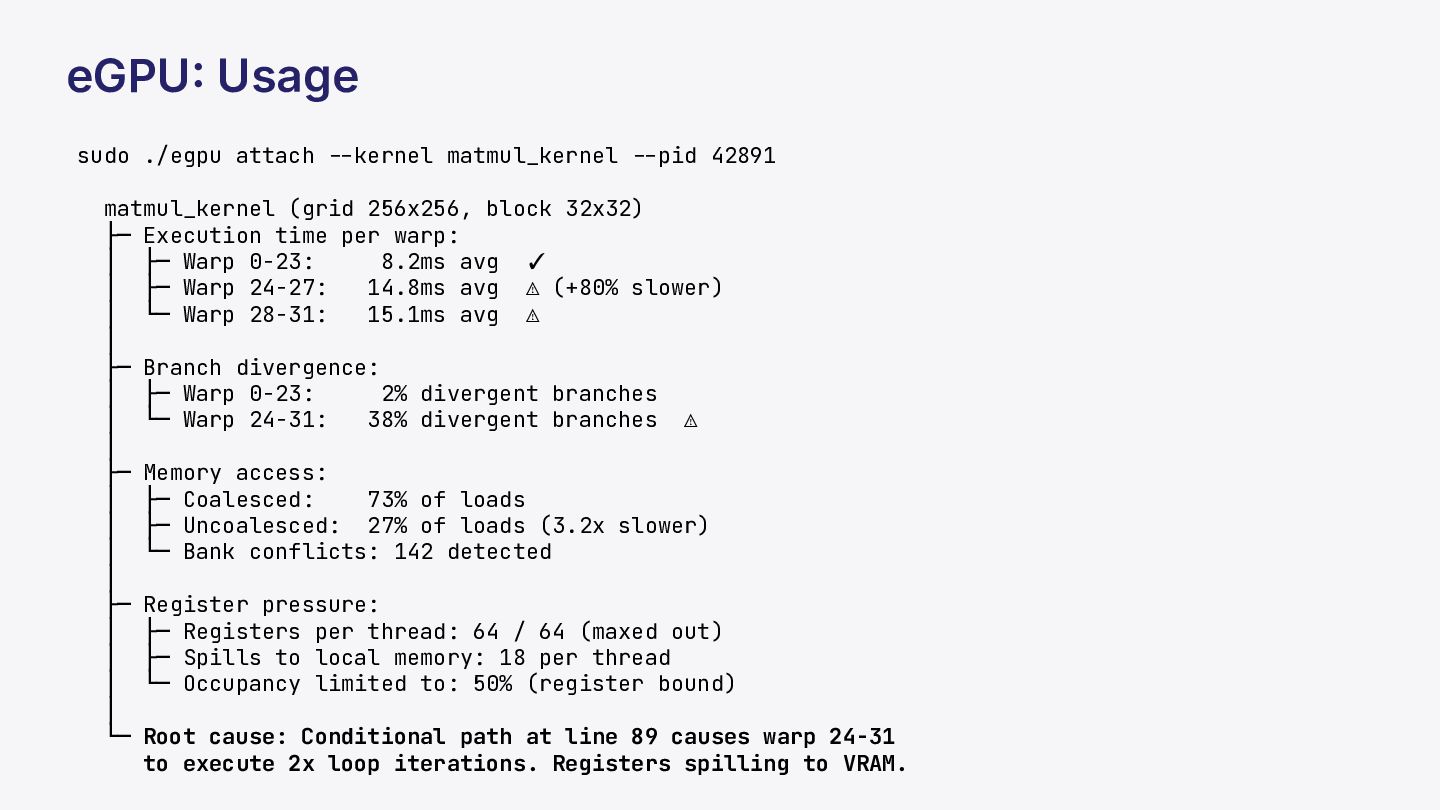
  34. eGPU Usage sudo ./egpu attach --kernel matmul_kernel --pid 42891 matmul_kernel

    (grid 256x256, block 32x32) ├─ Execution time per warp: │ ├─ Warp 0-23: 8.2ms avg ✓ │ ├─ Warp 24-27: 14.8ms avg ⚠ (+80% slower) │ └─ Warp 28-31: 15.1ms avg ⚠ │ ├─ Branch divergence: │ ├─ Warp 0-23: 2% divergent branches │ └─ Warp 24-31: 38% divergent branches ⚠ │ ├─ Memory access: │ ├─ Coalesced: 73% of loads │ ├─ Uncoalesced: 27% of loads (3.2x slower) │ └─ Bank conflicts: 142 detected │ ├─ Register pressure: │ ├─ Registers per thread: 64 / 64 (maxed out) │ ├─ Spills to local memory: 18 per thread │ └─ Occupancy limited to: 50% (register bound) │ └─ Root cause: Conditional path at line 89 causes warp 24-31 to execute 2x loop iterations. Registers spilling to VRAM.
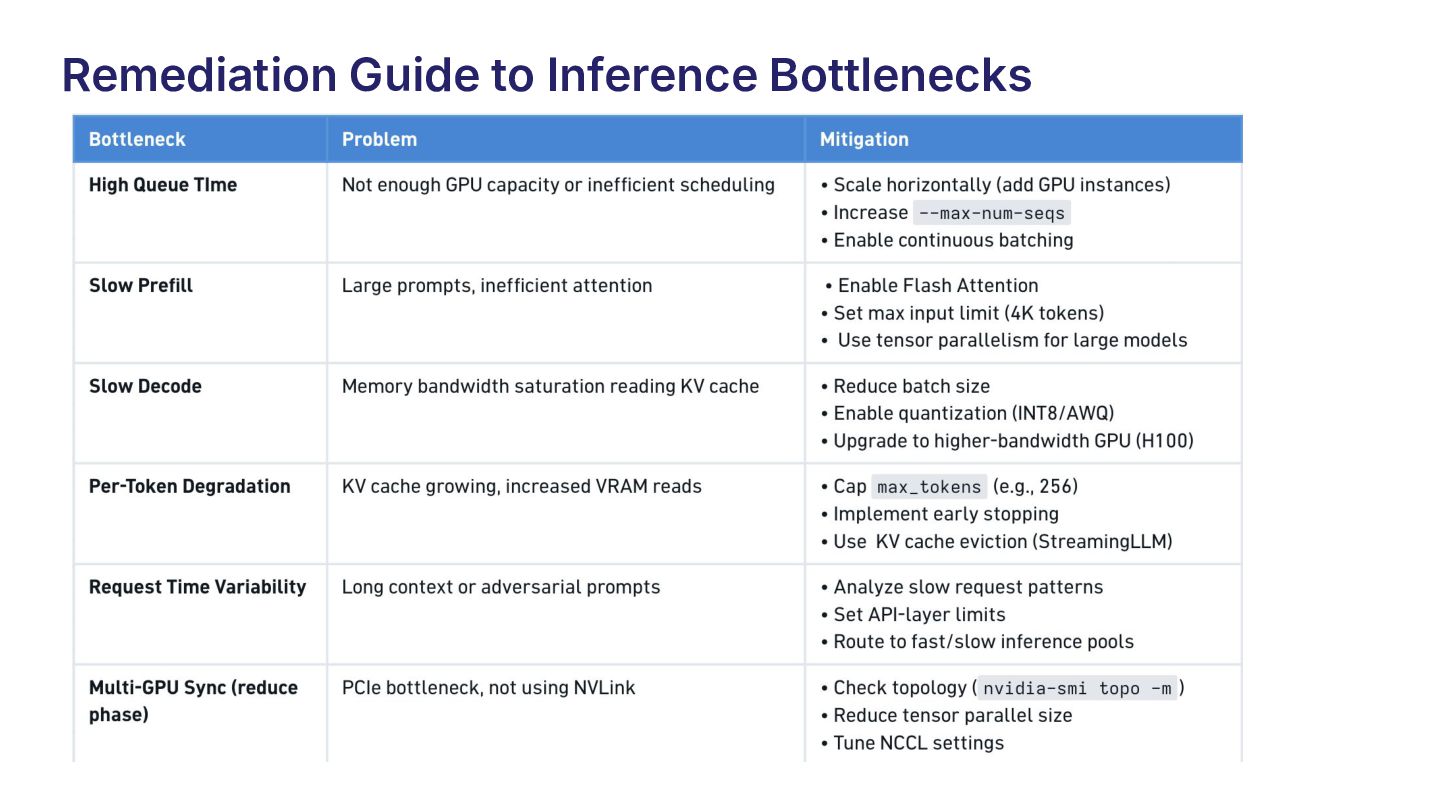
  35. eGPU Remediation Guide sudo ./egpu attach --kernel matmul_kernel --pid 42891

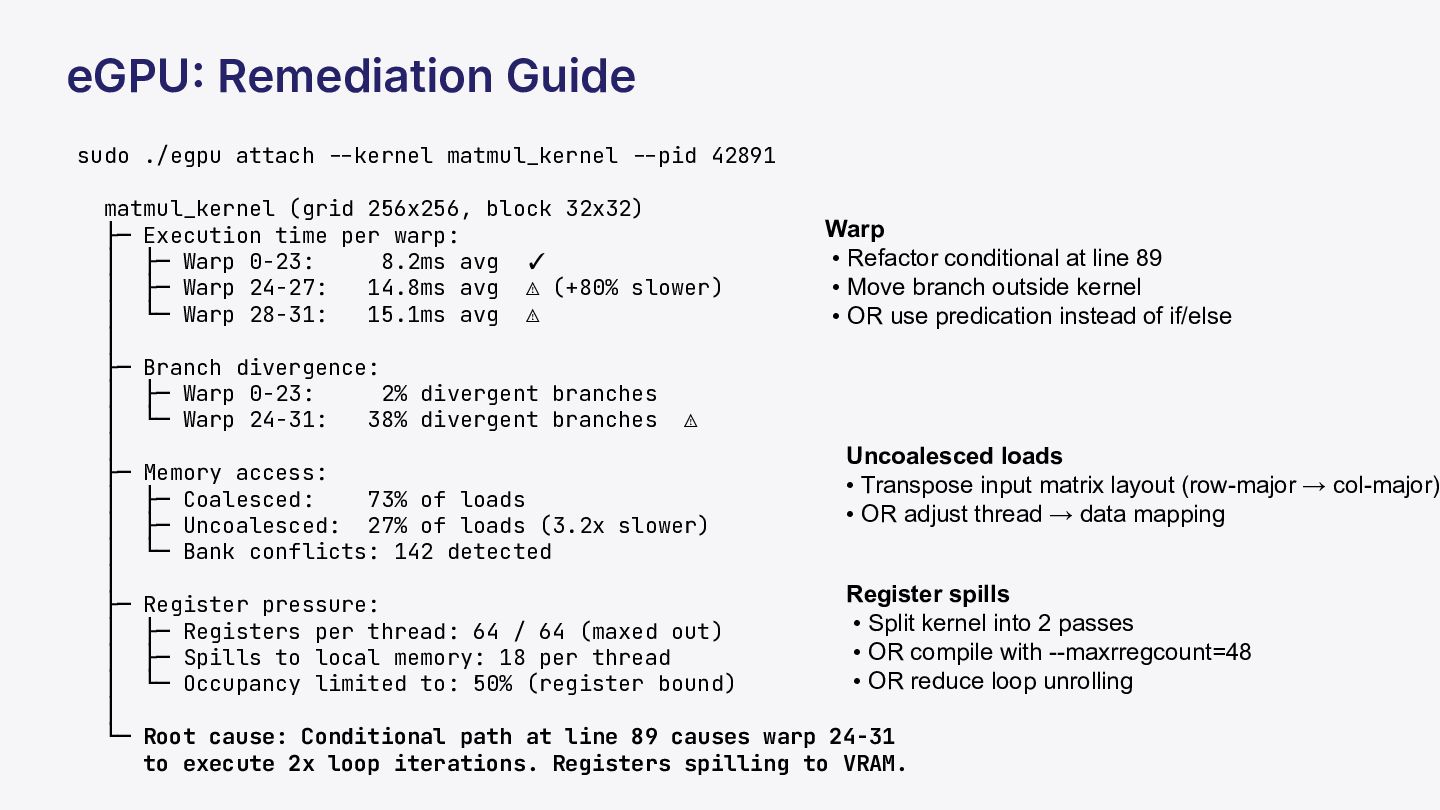
    matmul_kernel (grid 256x256, block 32x32) ├─ Execution time per warp: │ ├─ Warp 0-23: 8.2ms avg ✓ │ ├─ Warp 24-27: 14.8ms avg ⚠ (+80% slower) │ └─ Warp 28-31: 15.1ms avg ⚠ │ ├─ Branch divergence: │ ├─ Warp 0-23: 2% divergent branches │ └─ Warp 24-31: 38% divergent branches ⚠ │ ├─ Memory access: │ ├─ Coalesced: 73% of loads │ ├─ Uncoalesced: 27% of loads (3.2x slower) │ └─ Bank conflicts: 142 detected │ ├─ Register pressure: │ ├─ Registers per thread: 64 / 64 (maxed out) │ ├─ Spills to local memory: 18 per thread │ └─ Occupancy limited to: 50% (register bound) │ └─ Root cause: Conditional path at line 89 causes warp 24-31 to execute 2x loop iterations. Registers spilling to VRAM. Warp • Refactor conditional at line 89 • Move branch outside kernel • OR use predication instead of if/else Uncoalesced loads • Transpose input matrix layout (row-major → col-major) • OR adjust thread → data mapping Register spills • Split kernel into 2 passes • OR compile with --maxrregcount=48 • OR reduce loop unrolling
  36. AgentSight: AISystem-Wide Observability AgentSight uses eBPF to correlate: • AI

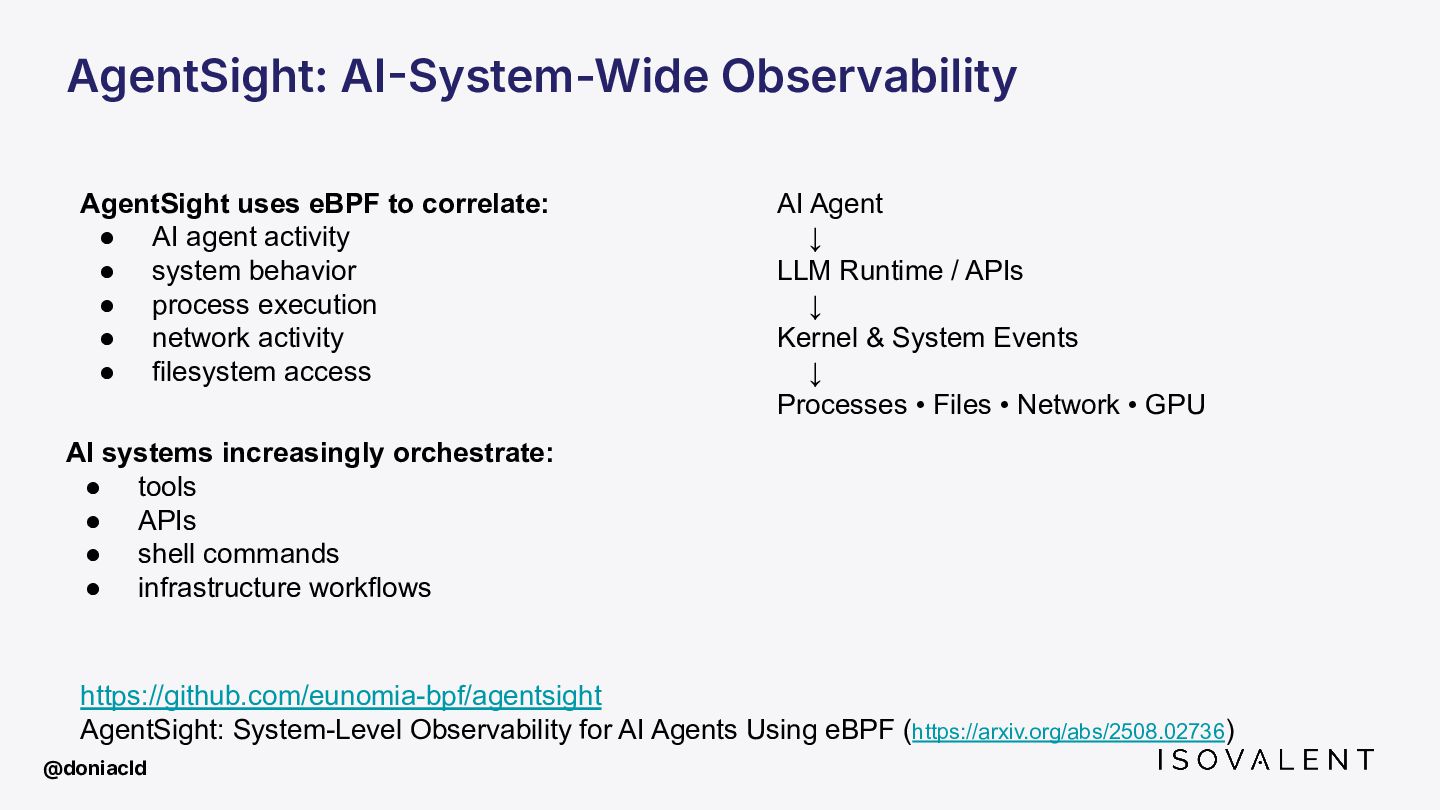
    agent activity • system behavior • process execution • network activity • filesystem access AI Agent ↓ LLM Runtime / APIs ↓ Kernel & System Events ↓ Processes • Files • Network • GPU AI systems increasingly orchestrate: • tools • APIs • shell commands • infrastructure workflows https://github.com/eunomia-bpf/agentsight AgentSight: System-Level Observability for AI Agents Using eBPF (https://arxiv.org/abs/2508.02736) @doniacld
  37. Key Takeaways GPUs are infrastructure now AI workloads introduce new

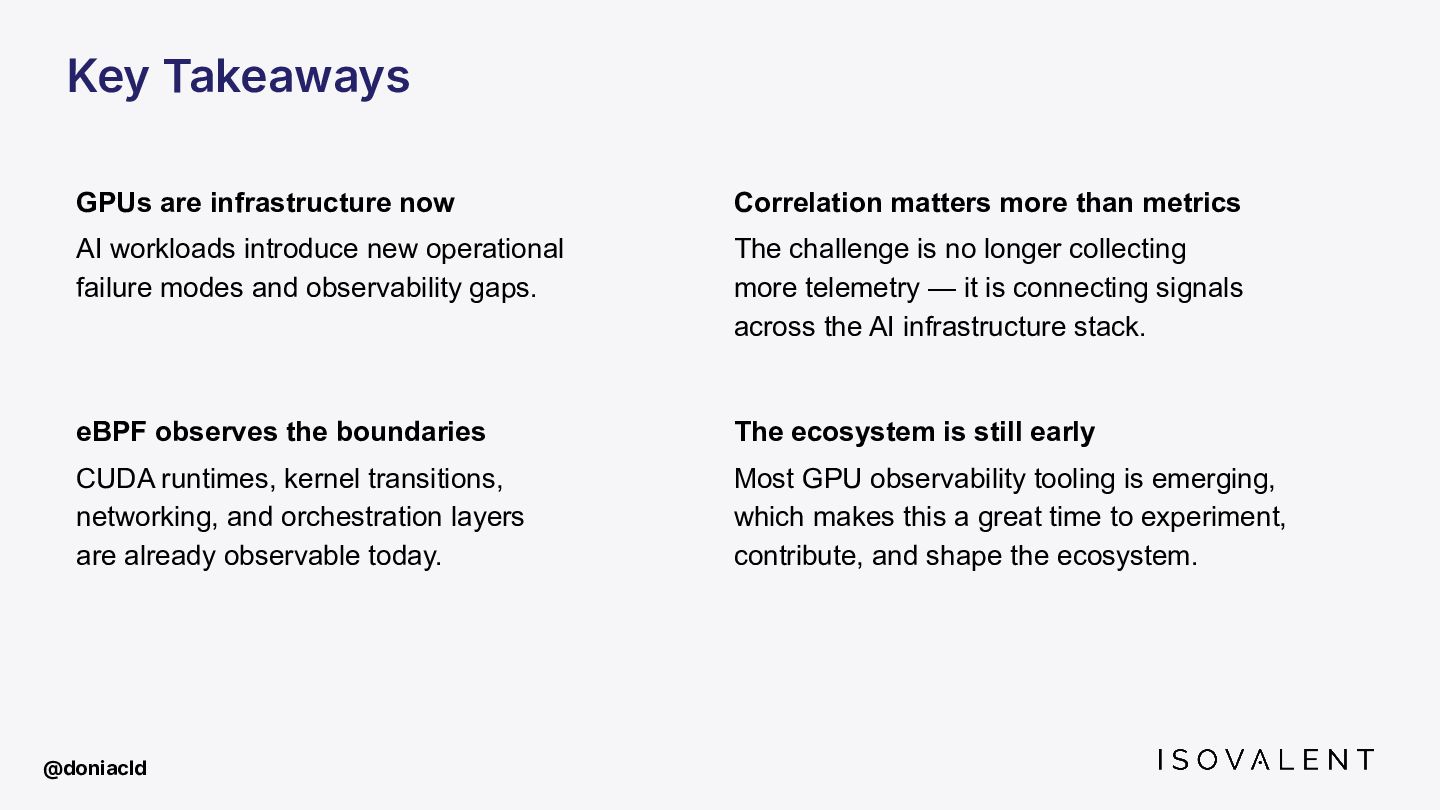
    operational failure modes and observability gaps. eBPF observes the boundaries CUDA runtimes, kernel transitions, networking, and orchestration layers are already observable today. Correlation matters more than metrics The challenge is no longer collecting more telemetry — it is connecting signals across the AI infrastructure stack. The ecosystem is still early Most GPU observability tooling is emerging, which makes this a great time to experiment, contribute, and shape the ecosystem. @doniacld
  38. Thank you and credits What did you think of the

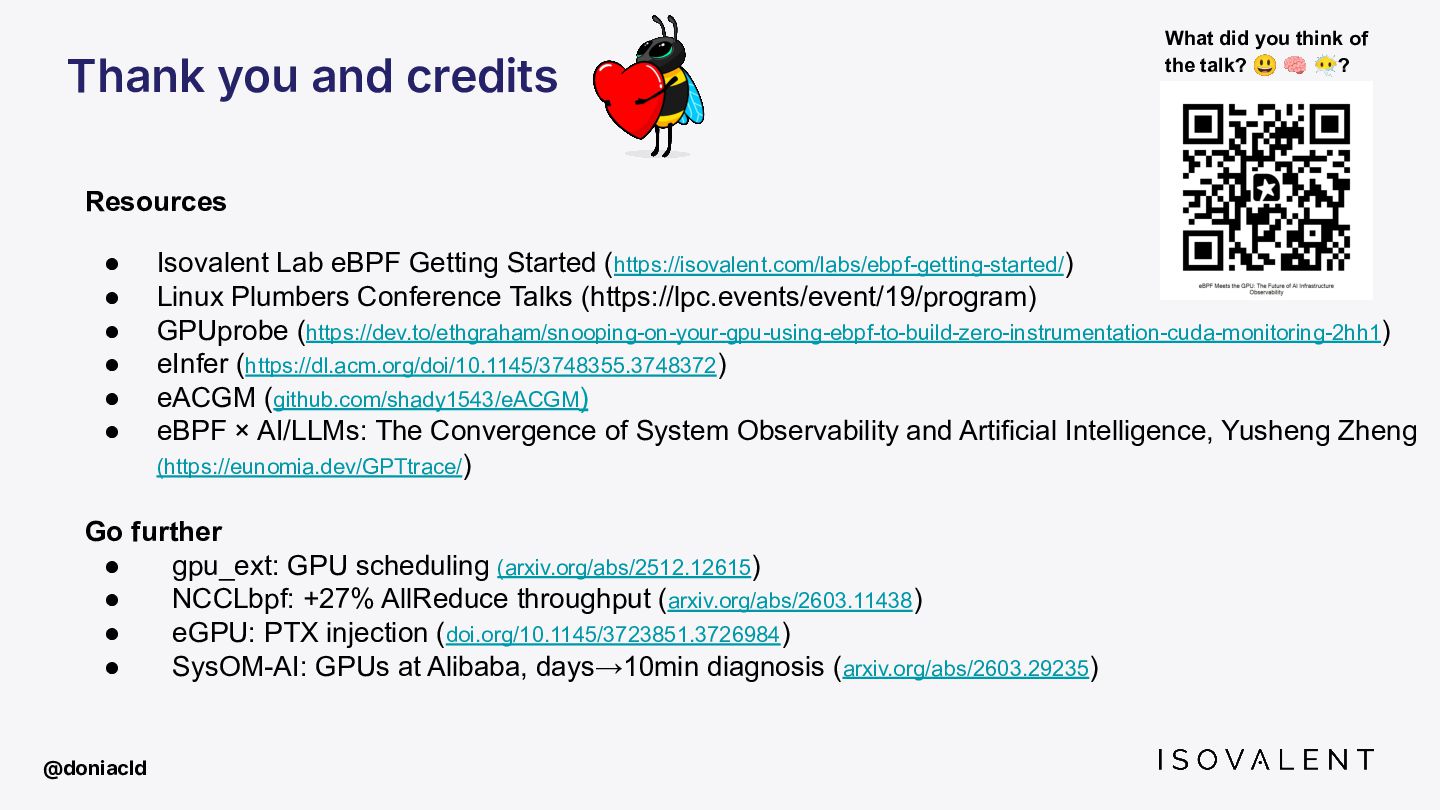
    talk? 😃 🧠 󰷻? Resources • Isovalent Lab eBPF Getting Started (https://isovalent.com/labs/ebpf-getting-started/) • Linux Plumbers Conference Talks (https://lpc.events/event/19/program) • GPUprobe (https://dev.to/ethgraham/snooping-on-your-gpu-using-ebpf-to-build-zero-instrumentation-cuda-monitoring-2hh1) • eInfer (https://dl.acm.org/doi/10.1145/3748355.3748372) • eACGM (github.com/shady1543/eACGM) • eBPF × AI/LLMs: The Convergence of System Observability and Artificial Intelligence, Yusheng Zheng (https://eunomia.dev/GPTtrace/) Go further • gpu_ext: GPU scheduling (arxiv.org/abs/2512.12615) • NCCLbpf: +27% AllReduce throughput (arxiv.org/abs/2603.11438) • eGPU: PTX injection (doi.org/10.1145/3723851.3726984) • SysOM-AI: GPUs at Alibaba, days→10min diagnosis (arxiv.org/abs/2603.29235) @doniacld