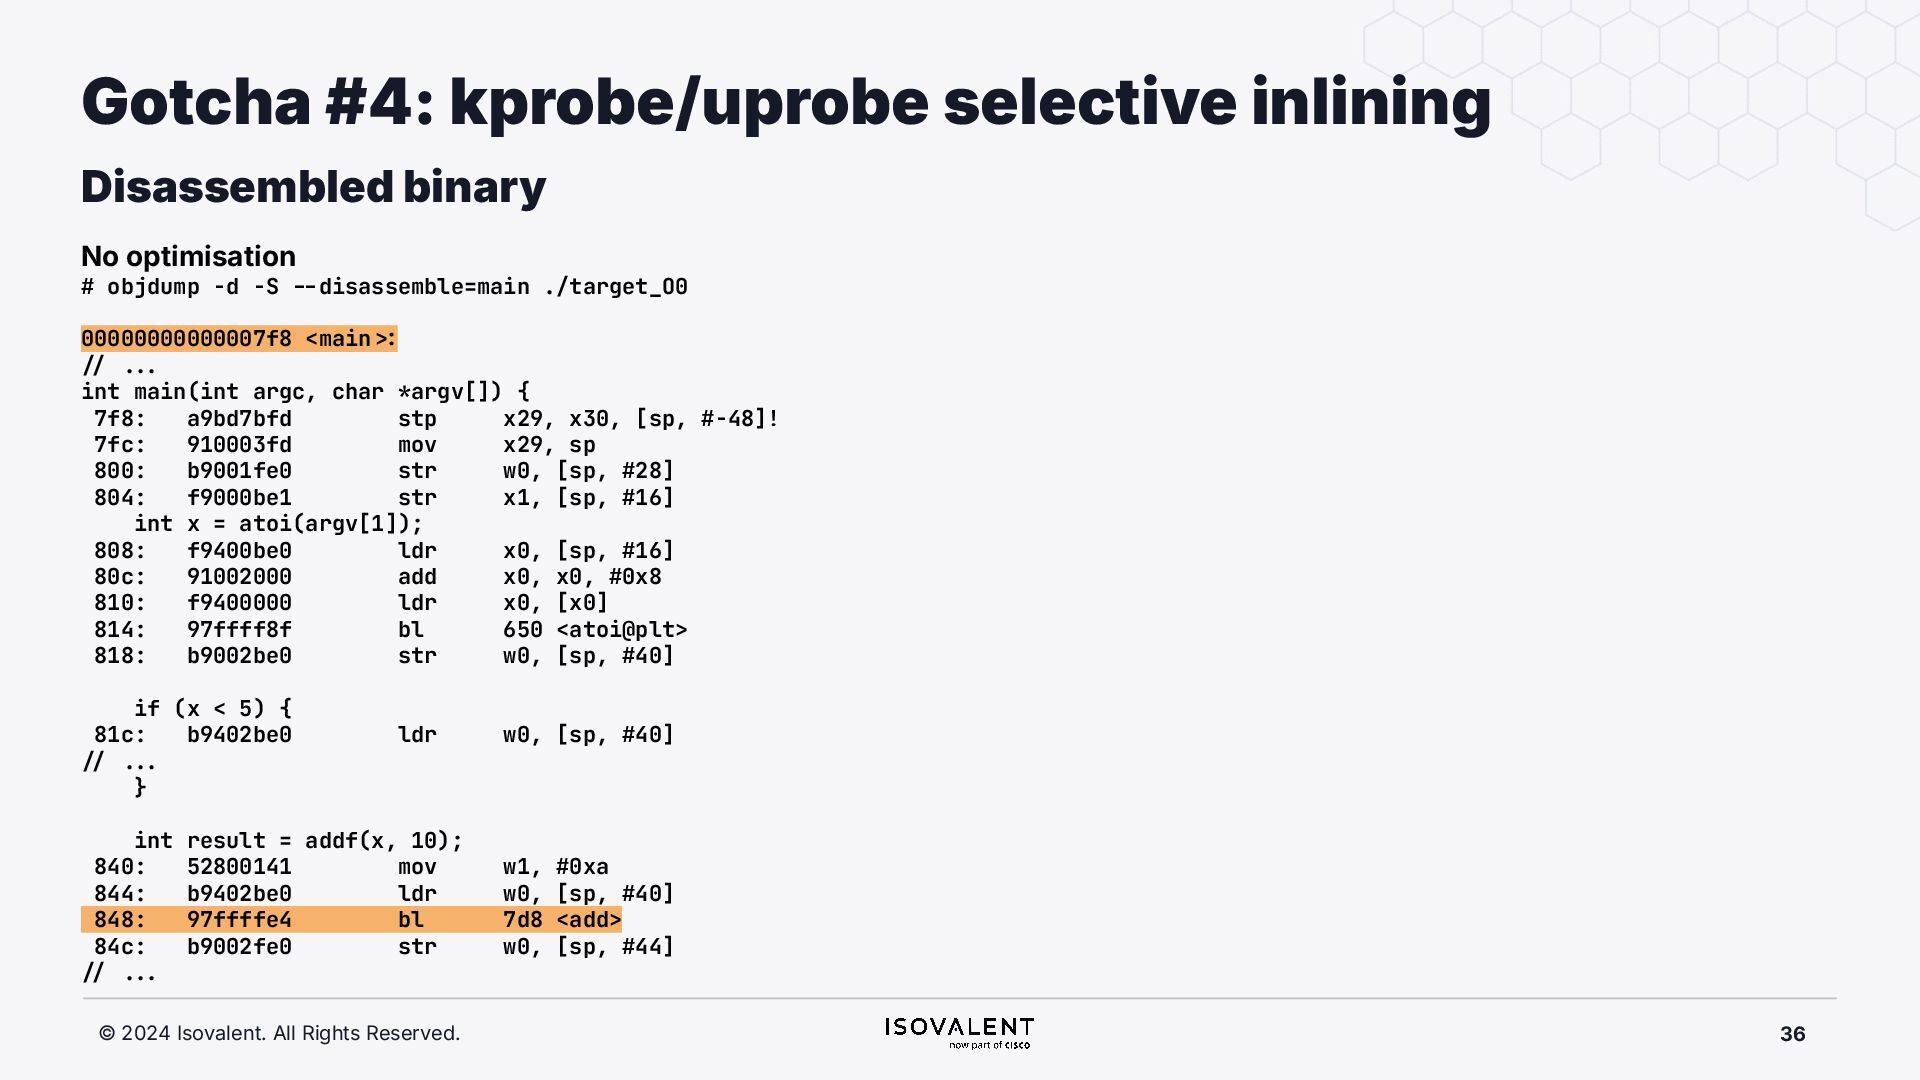
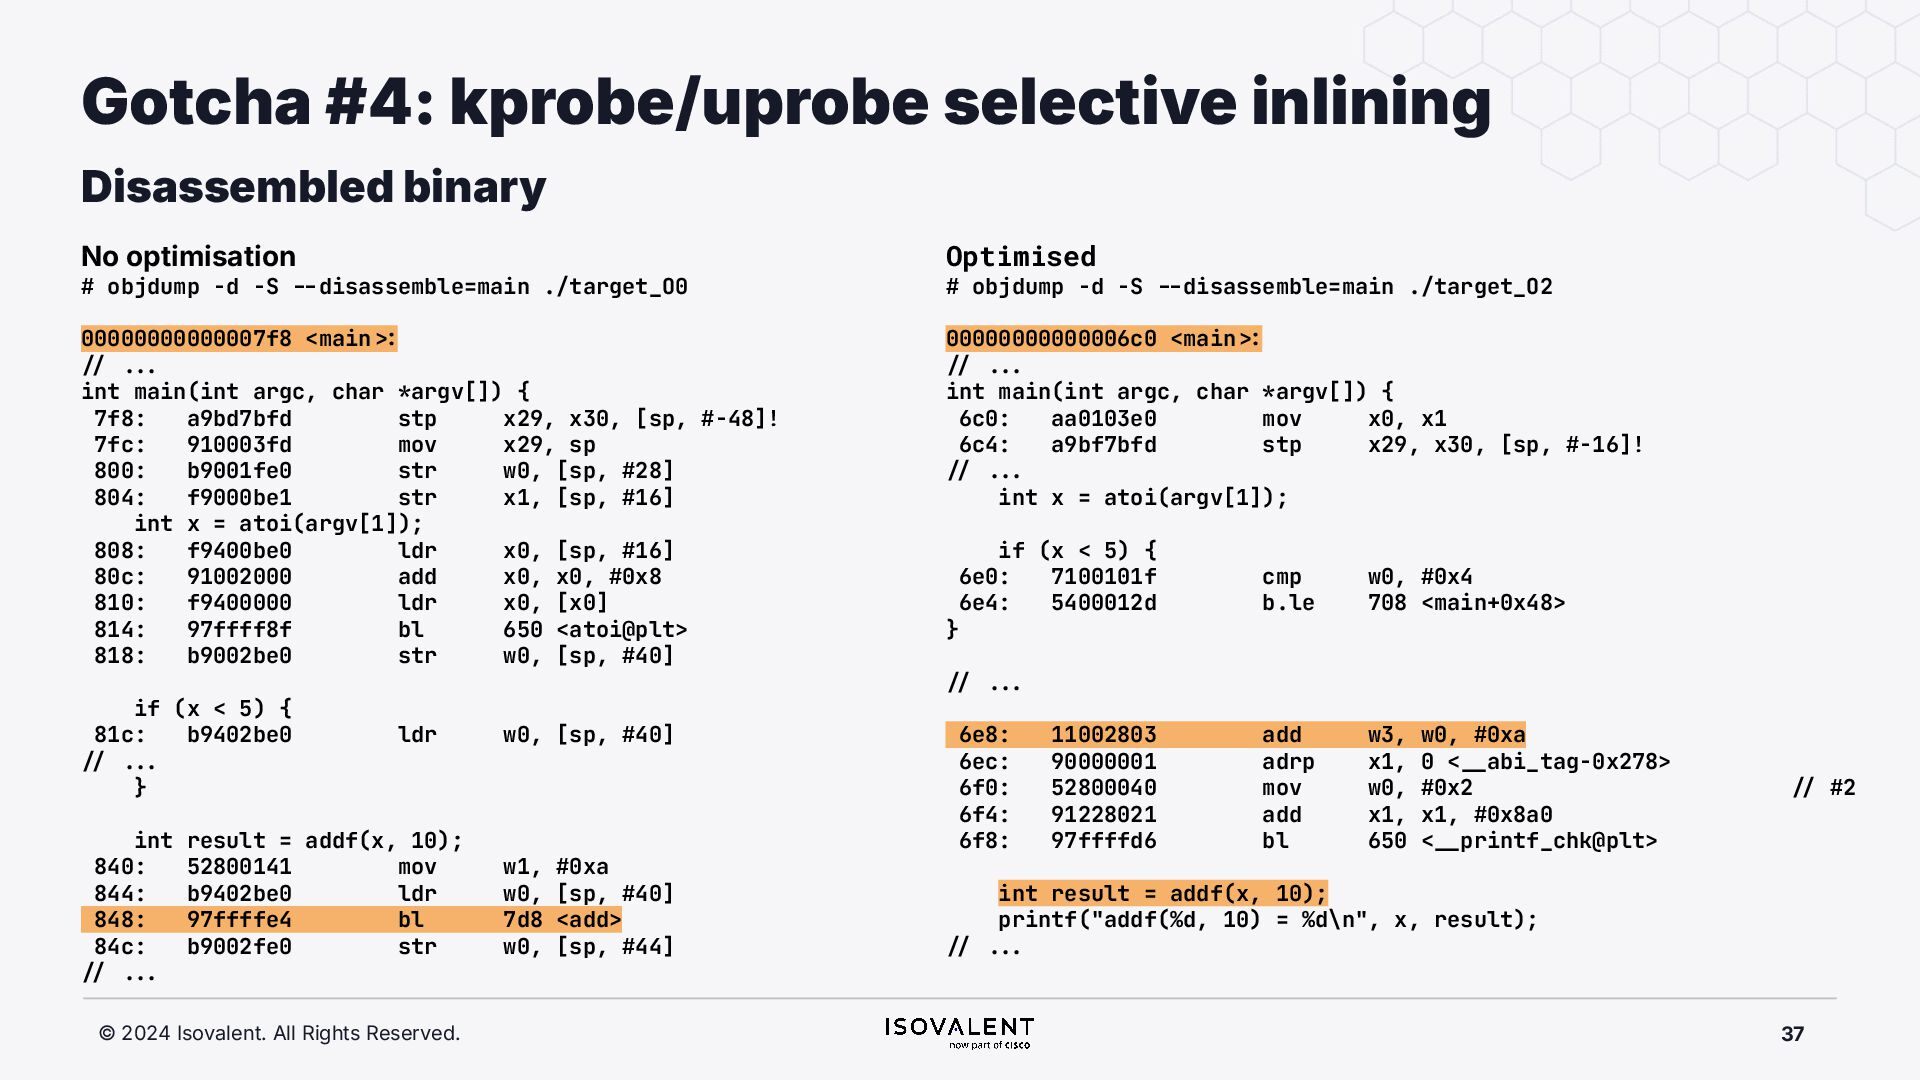
selective inlining Disassembled binary No optimisation # objdump -d -S .-disassemble=main ./target_O0 00000000000007f8 <main.: ./ ... int main(int argc, char *argv[]) { 7f8: a9bd7bfd stp x29, x30, [sp, #-48]! 7fc: 910003fd mov x29, sp 800: b9001fe0 str w0, [sp, #28] 804: f9000be1 str x1, [sp, #16] int x = atoi(argv[1]); 808: f9400be0 ldr x0, [sp, #16] 80c: 91002000 add x0, x0, #0x8 810: f9400000 ldr x0, [x0] 814: 97ffff8f bl 650 <atoi@plt> 818: b9002be0 str w0, [sp, #40] if (x < 5) { 81c: b9402be0 ldr w0, [sp, #40] ./ ... } int result = addf(x, 10); 840: 52800141 mov w1, #0xa 844: b9402be0 ldr w0, [sp, #40] 848: 97ffffe4 bl 7d8 <add> 84c: b9002fe0 str w0, [sp, #44] ./ ... Optimised # objdump -d -S .-disassemble=main ./target_O2 00000000000006c0 <main.: ./ ... int main(int argc, char *argv[]) { 6c0: aa0103e0 mov x0, x1 6c4: a9bf7bfd stp x29, x30, [sp, #-16]! ./ ... int x = atoi(argv[1]); if (x < 5) { 6e0: 7100101f cmp w0, #0x4 6e4: 5400012d b.le 708 <main+0x48> } ./ ... 6e8: 11002803 add w3, w0, #0xa 6ec: 90000001 adrp x1, 0 <._abi_tag-0x278> 6f0: 52800040 mov w0, #0x2 ./ #2 6f4: 91228021 add x1, x1, #0x8a0 6f8: 97ffffd6 bl 650 <._printf_chk@plt> int result = addf(x, 10); printf("addf(%d, 10) = %d\n", x, result); ./ ...