Upgrade to Pro — share decks privately, control downloads, hide ads and more …

Streaming analytics at 300 billion events per day with Kafka, Samza, and Druid

Druid
June 03, 2016

Streaming analytics at 300 billion events per day with Kafka, Samza, and Druid

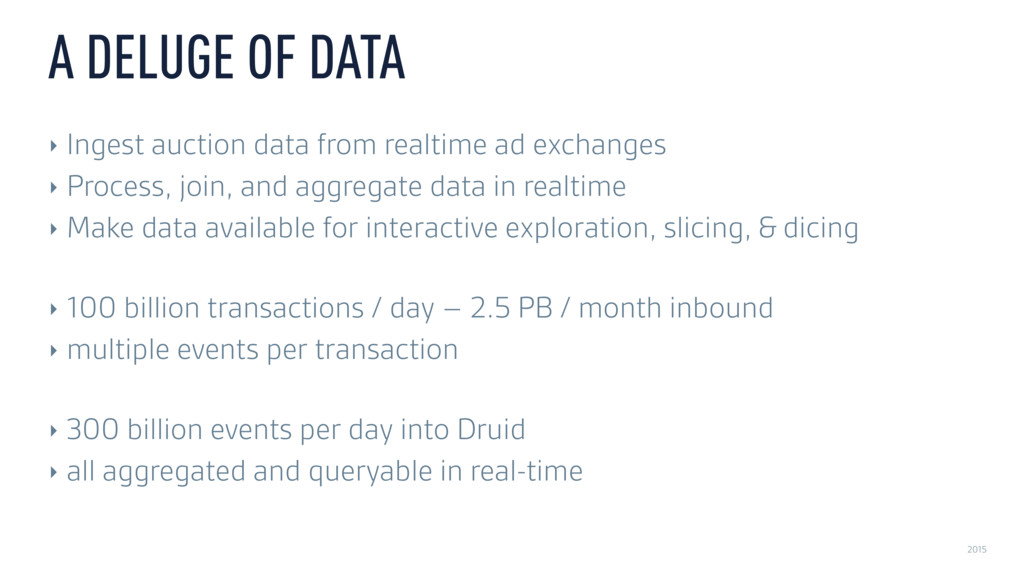
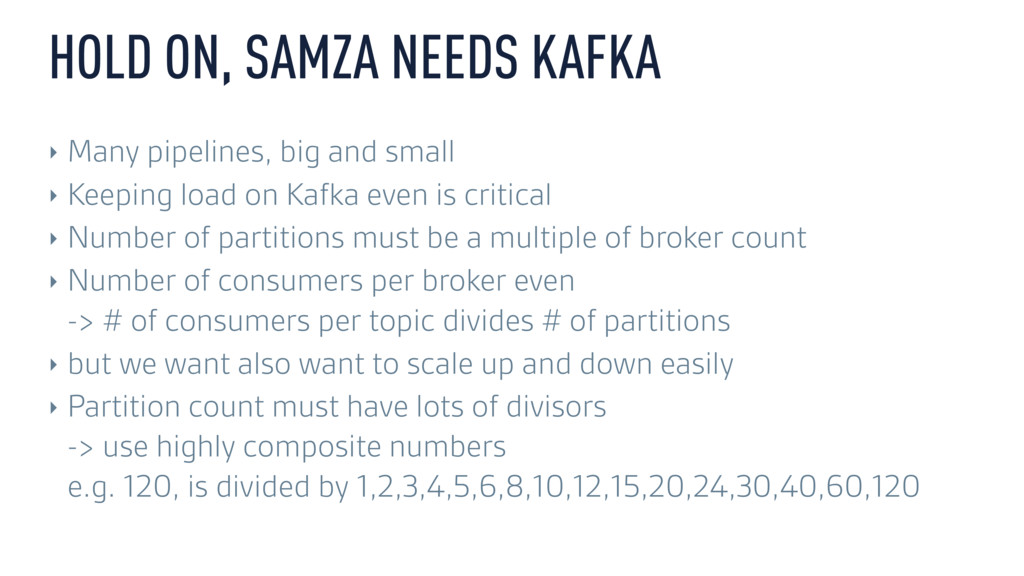
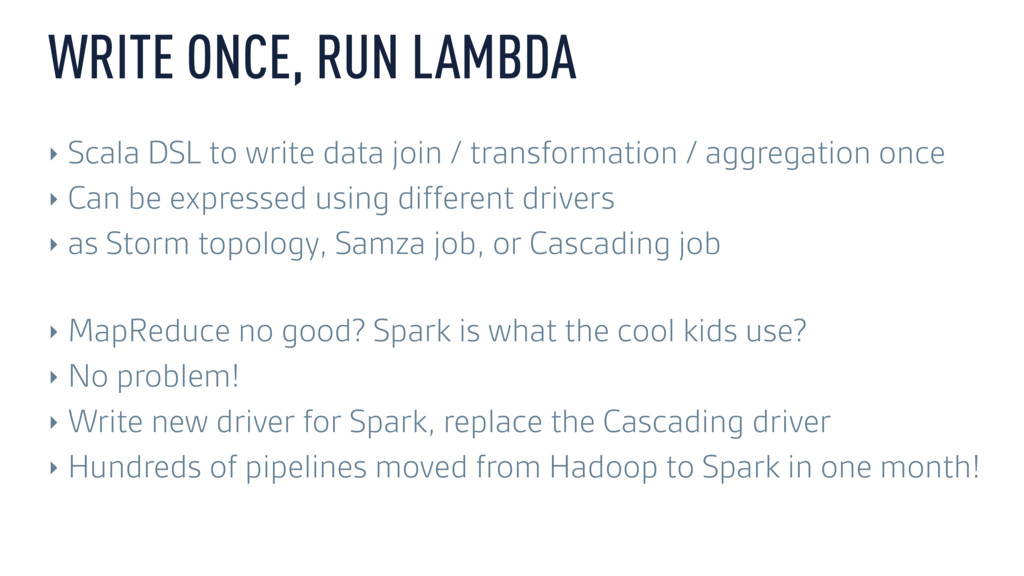
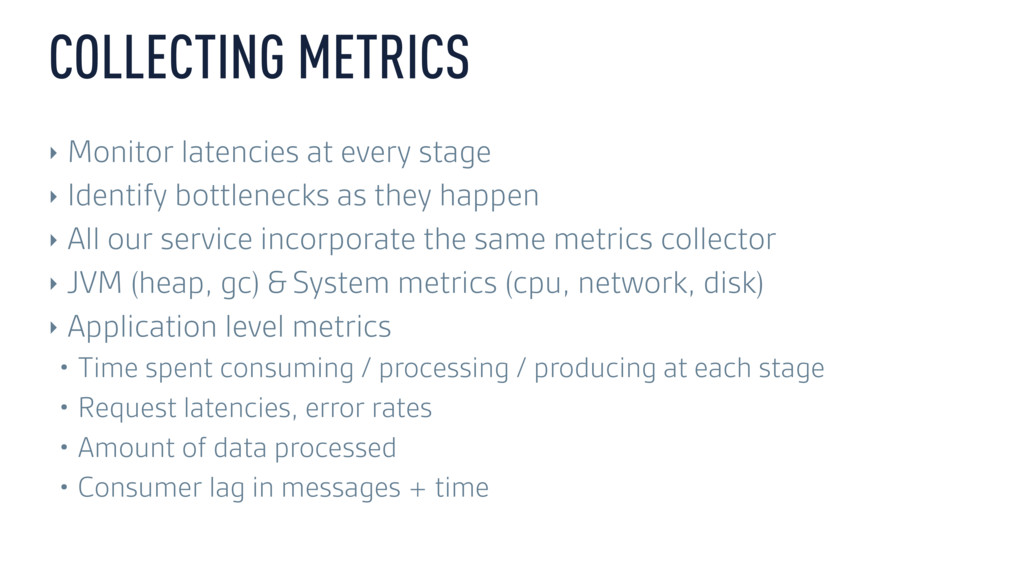
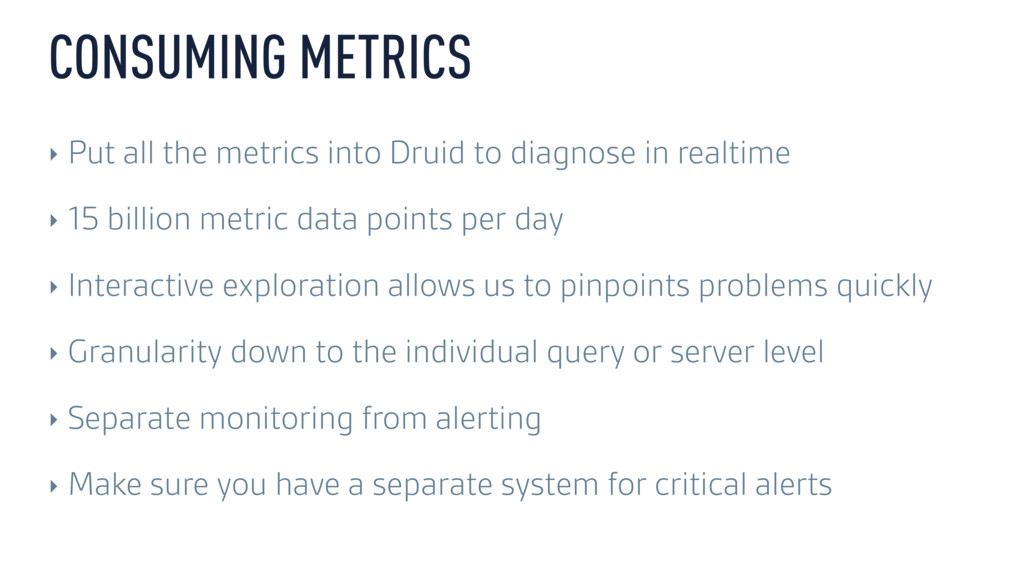
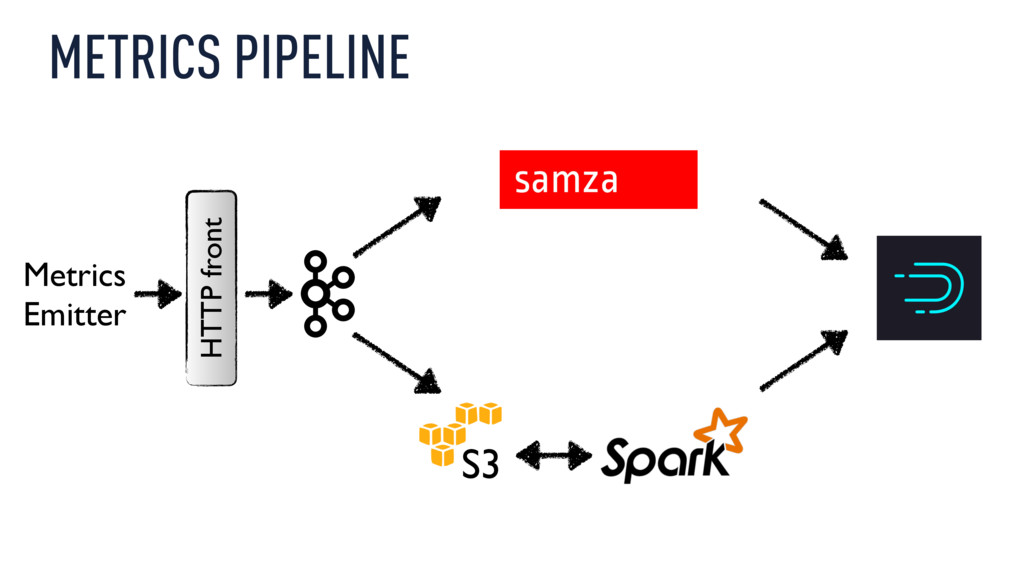
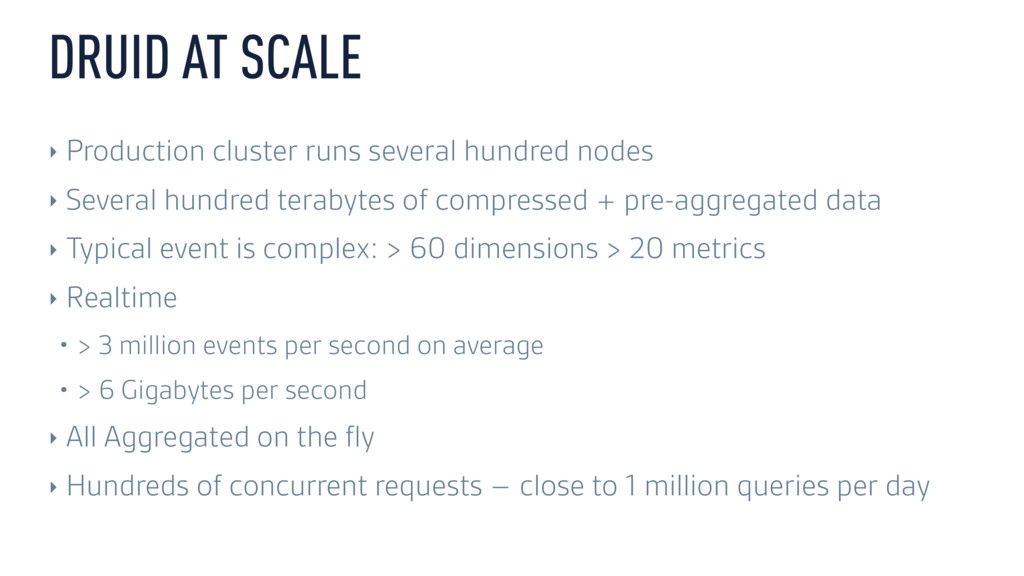
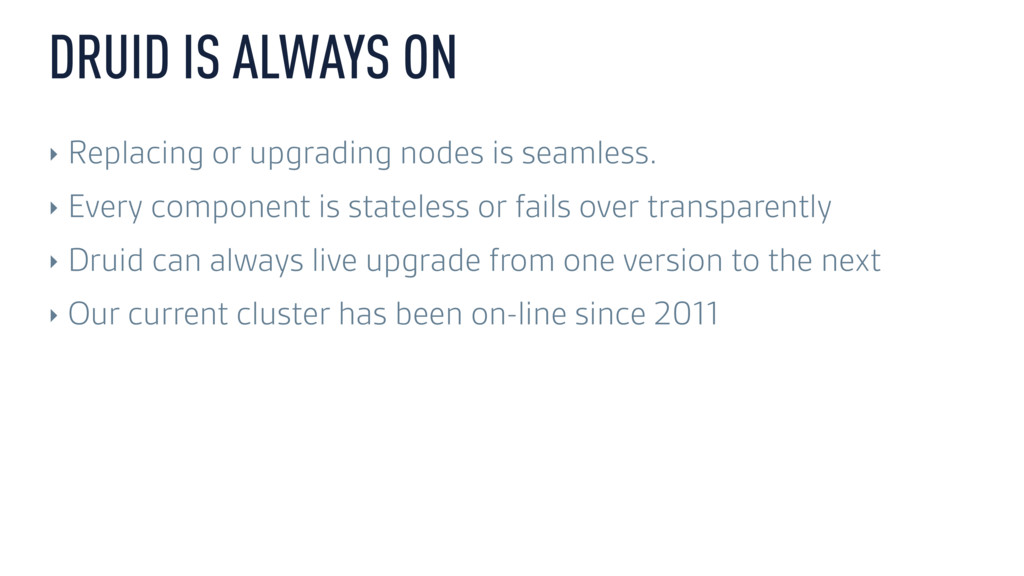
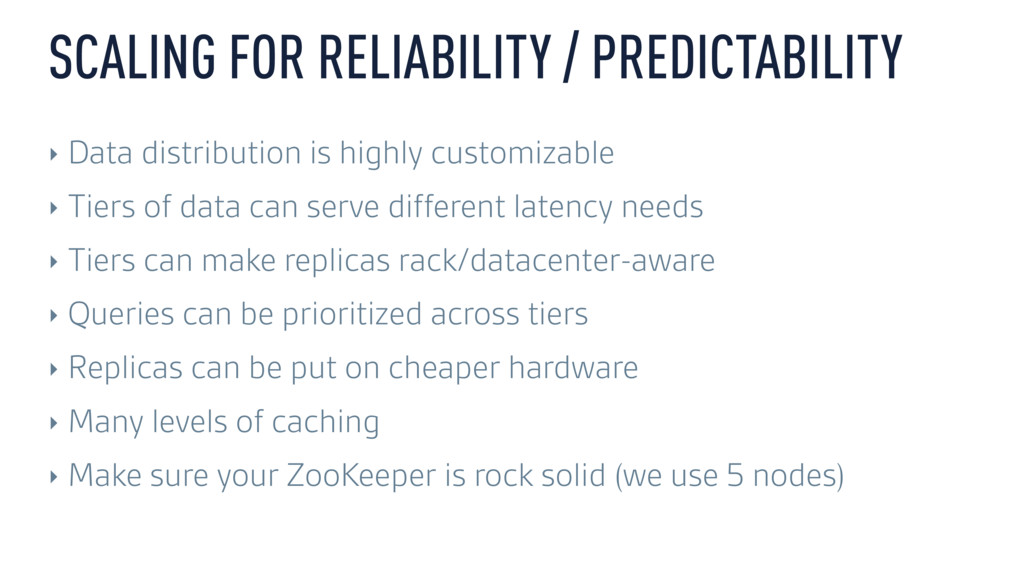
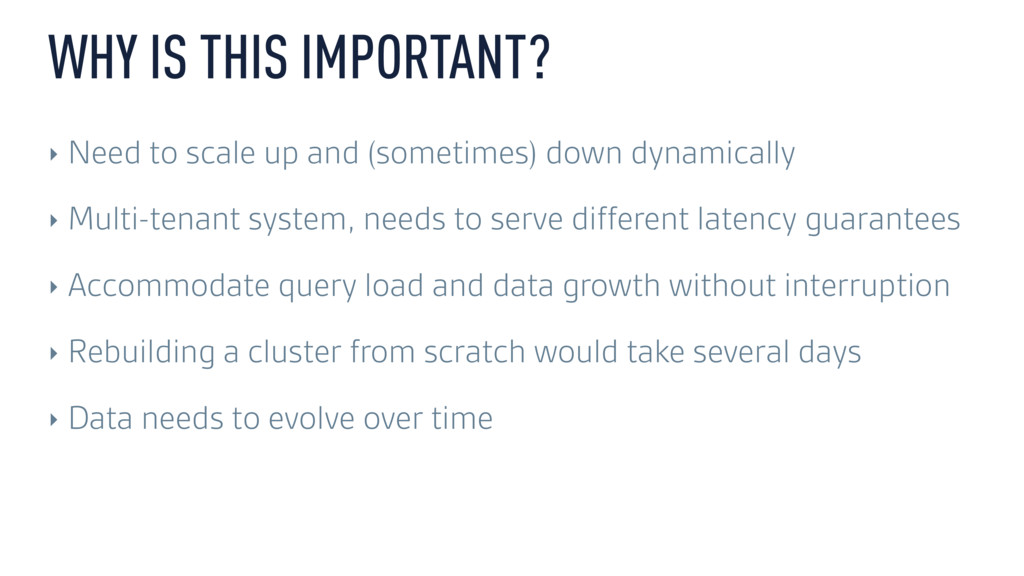
Today, Metamarkets processes over 300 billion events per day—over 100 TB going through a single pipeline built entirely on open source technologies such as Druid, Kafka, and Samza. Working at such a scale presents engineering challenges on many levels, not just in terms of design but also in terms of operations, especially when downtime is not an option.

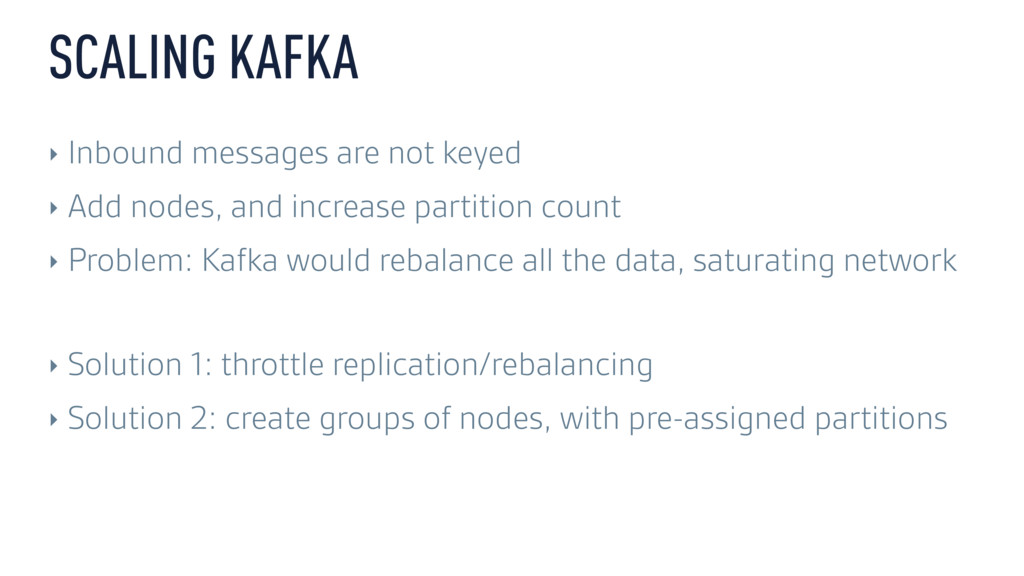
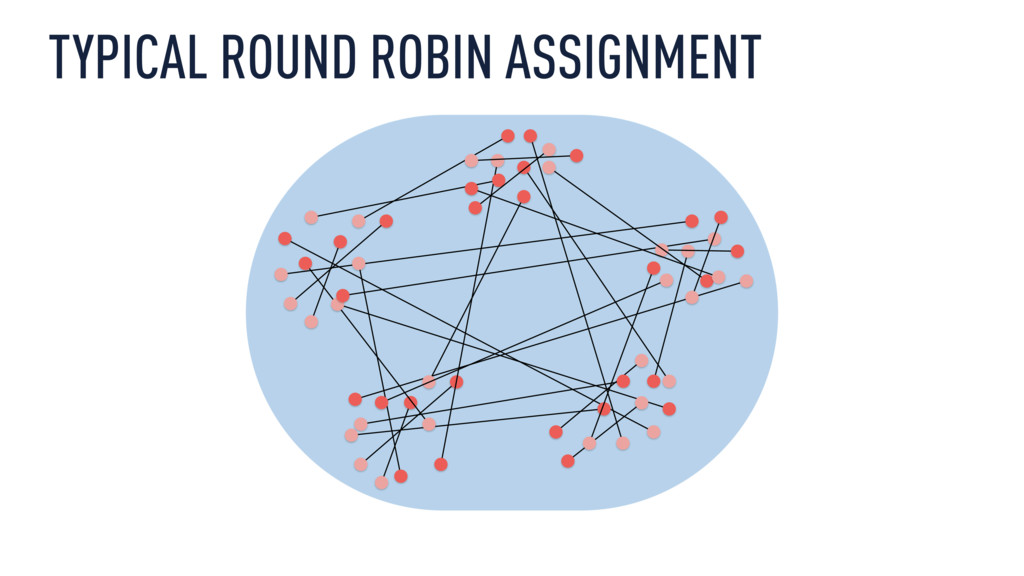
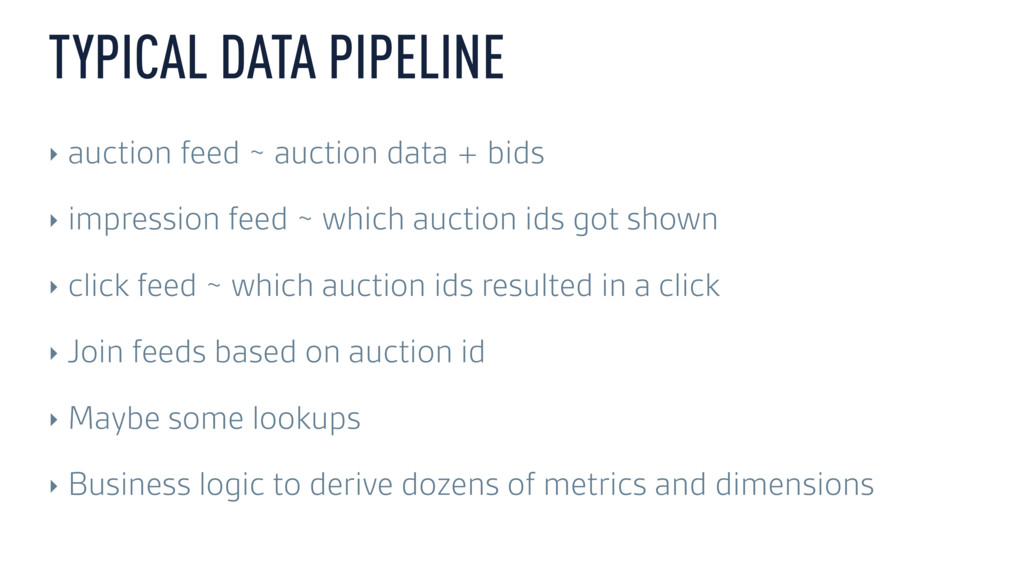
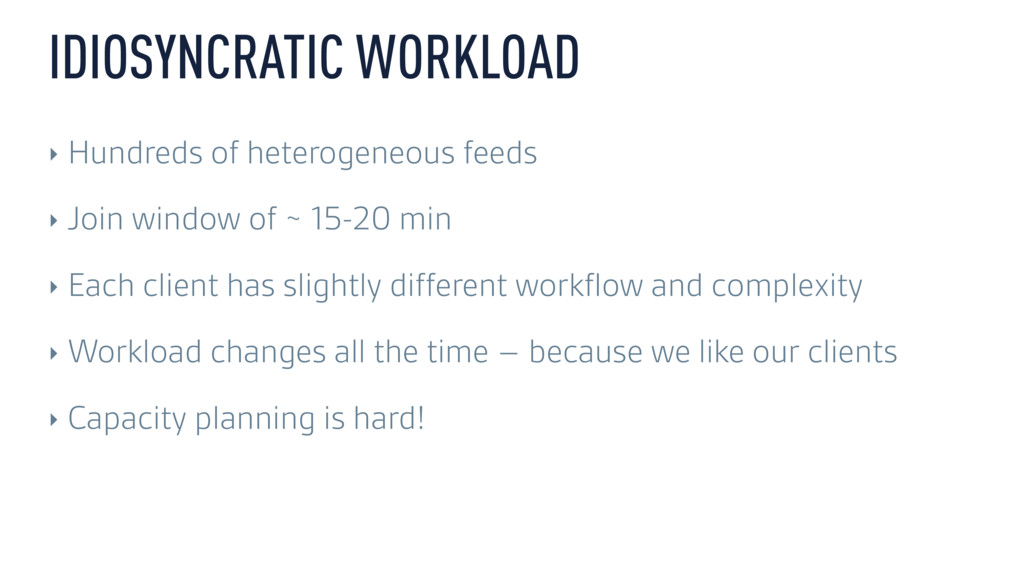
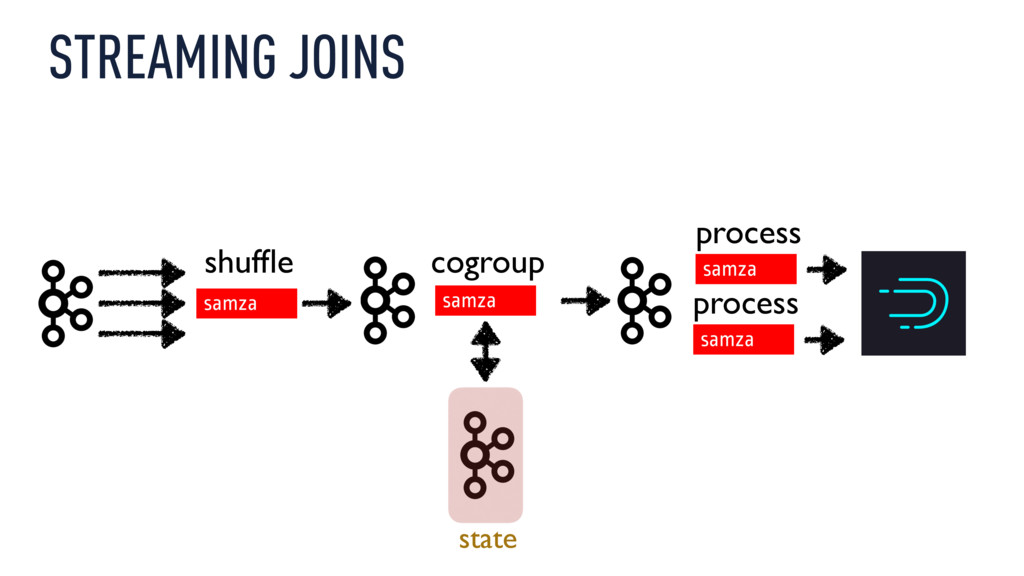
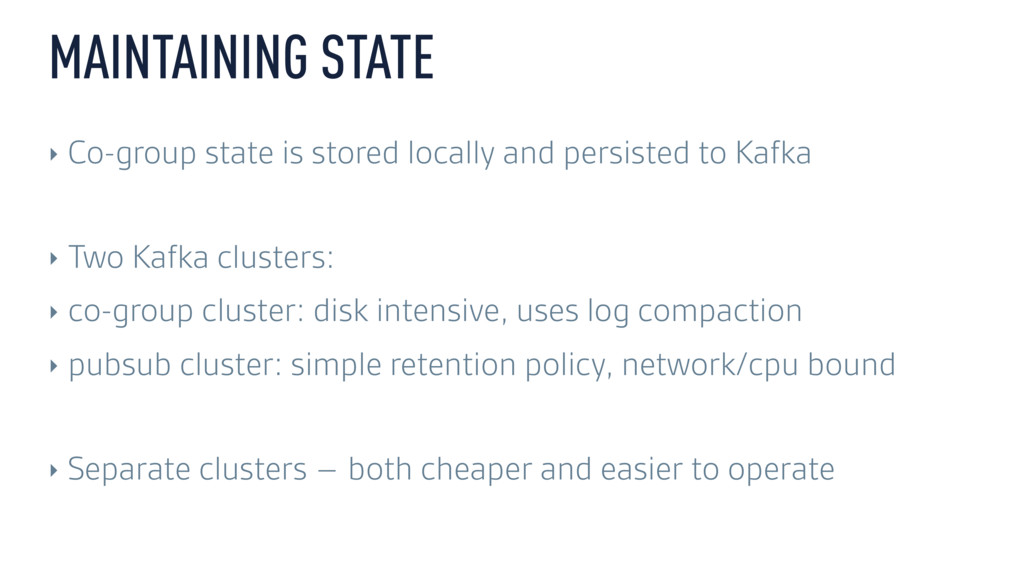
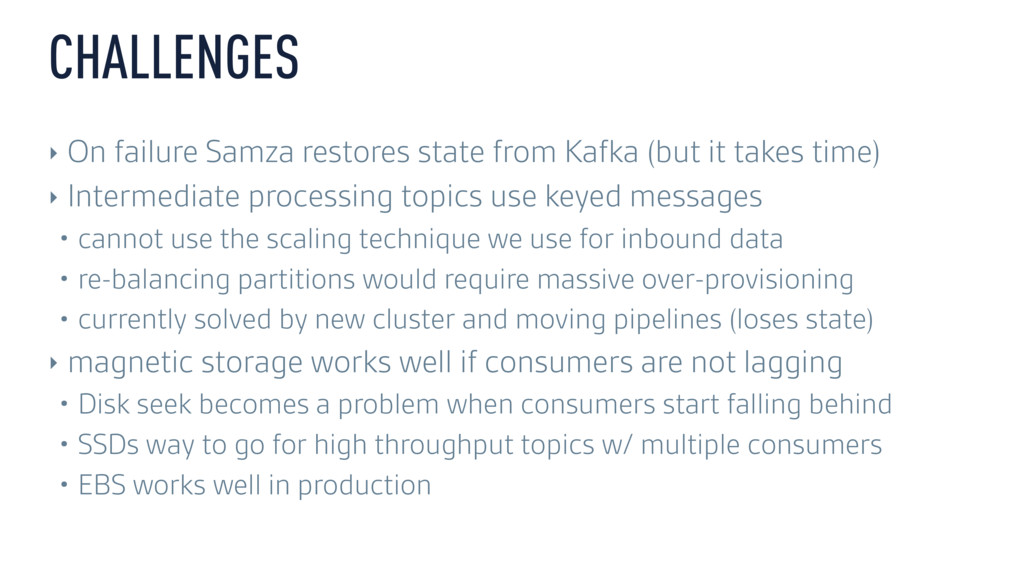
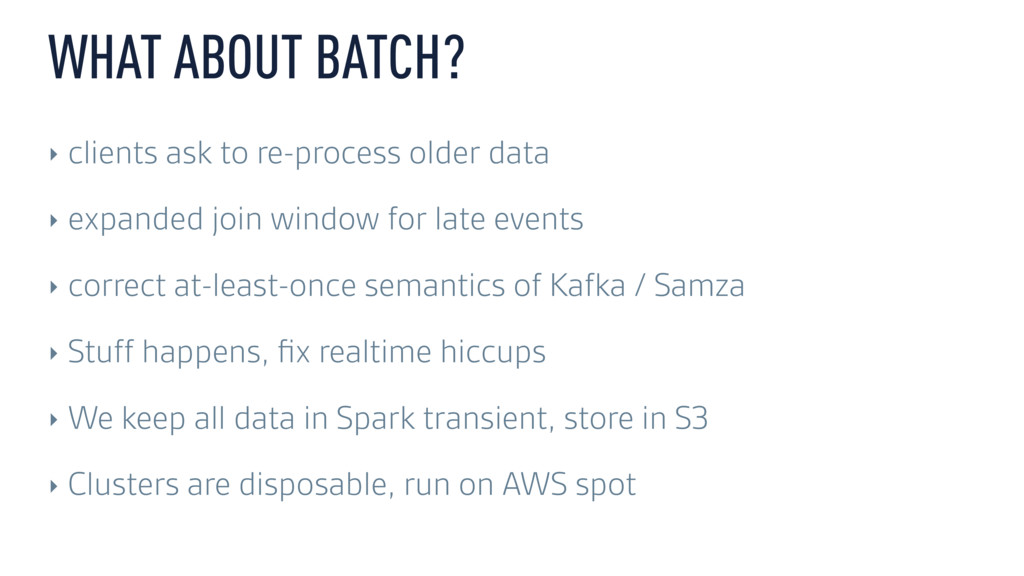
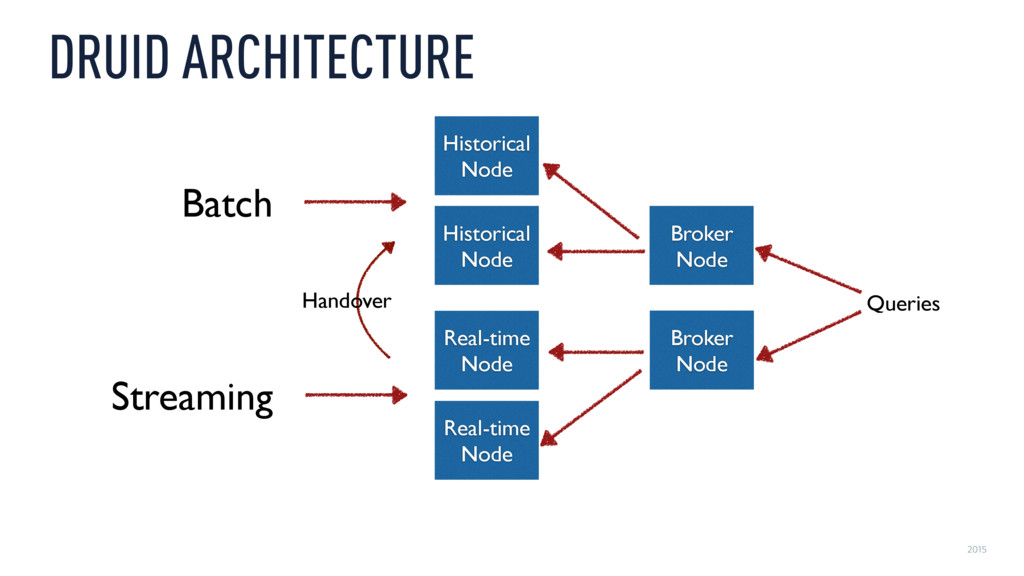
Xavier Léauté explores how Metamarkets used Kafka and Samza to build a multitenant pipeline to perform streaming joins and transformations of varying degrees of complexity and then push data into Druid to make it available for immediate, interactive analysis at a rate of several hundreds of concurrent queries per second. But as data grew an order of magnitude in the span of a few months, all systems involved started to show their limits. Xavier describes the challenges around scaling this stack and explains how the team overcame them, using extensive metric collection to manage both performance and costs and how they handle very heterogeneous processing workloads while keeping down operational complexity.

Druid

June 03, 2016
Tweet

More Decks by Druid

Other Decks in Technology

Transcript

  1. STREAMING ANALYTICS AT SCALE WITH DRUID / KAFKA / SAMZA

    XAVIER LÉAUTÉ HEAD OF BACKEND @ METAMARKETS DRUID COMMITTER & PMC MEMBER [email protected]
  2. 2015 A DELUGE OF DATA ‣ Ingest auction data from

    realtime ad exchanges ‣ Process, join, and aggregate data in realtime ‣ Make data available for interactive exploration, slicing, & dicing
 ‣ 100 billion transactions / day – 2.5 PB / month inbound ‣ multiple events per transaction
 ‣ 300 billion events per day into Druid ‣ all aggregated and queryable in real-time
  3. 2015 RECEIVING DATA ‣ Single Kafka cluster for receiving data

    ‣ Failure is not an option ‣ Data schema can change at any time
 ‣ Keep it very simple: ingest, timestamp, batch, compress data upfront ‣ Distribute data to available partitions ‣ 7 day retention so we can sleep tight
 ‣ How do we scale it?
  4. SCALING KAFKA ‣ Inbound messages are not keyed ‣ Add

    nodes, and increase partition count ‣ Problem: Kafka would rebalance all the data, saturating network
 ‣ Solution 1: throttle replication/rebalancing ‣ Solution 2: create groups of nodes, with pre-assigned partitions
  5. DEALING WITH FAILURE ‣ Node / Disk failures happen all

    the time ‣ Kafka retention is based on time ‣ Problem: Kafka does not understand time
 ‣ What happens on node failure? ‣ Replace a node – replicate all data – data is now timestamped today ‣ Replicated data won’t get pruned for another week -> requires 2x disk capacity
 (otherwise we need to go cleanup segments by hand, not fun!)
 ‣ Looking forward to Kafka 0.10.1 (KIP-33) to fix this
  6. TYPICAL DATA PIPELINE ‣ auction feed ~ auction data +

    bids ‣ impression feed ~ which auction ids got shown ‣ click feed ~ which auction ids resulted in a click ‣ Join feeds based on auction id ‣ Maybe some lookups ‣ Business logic to derive dozens of metrics and dimensions
  7. IDIOSYNCRATIC WORKLOAD ‣ Hundreds of heterogeneous feeds ‣ Join window

    of ~ 15-20 min ‣ Each client has slightly different workflow and complexity ‣ Workload changes all the time – because we like our clients ‣ Capacity planning is hard!
  8. WHAT WE LIKE ABOUT SAMZA ‣ great workload isolation –

    different pipelines in different JVMs ‣ heterogeneous workloads – network /disk / cpu isolation matters
 ‣ hard to gauge how many nodes we need ‣ we’re on AWS, let’s use many many small nodes! ‣ easy to provision, good isolation of resources ‣ one container per node, hundreds of little nodes chugging along
  9. HOLD ON, SAMZA NEEDS KAFKA ‣ Many pipelines, big and

    small ‣ Keeping load on Kafka even is critical ‣ Number of partitions must be a multiple of broker count ‣ Number of consumers per broker even
 -> # of consumers per topic divides # of partitions ‣ but we want also want to scale up and down easily ‣ Partition count must have lots of divisors
 -> use highly composite numbers
 e.g. 120, is divided by 1,2,3,4,5,6,8,10,12,15,20,24,30,40,60,120
  10. MAINTAINING STATE ‣ Co-group state is stored locally and persisted

    to Kafka
 ‣ Two Kafka clusters: ‣ co-group cluster: disk intensive, uses log compaction ‣ pubsub cluster: simple retention policy, network/cpu bound
 ‣ Separate clusters – both cheaper and easier to operate
  11. CHALLENGES ‣ On failure Samza restores state from Kafka (but

    it takes time) ‣ Intermediate processing topics use keyed messages • cannot use the scaling technique we use for inbound data • re-balancing partitions would require massive over-provisioning • currently solved by new cluster and moving pipelines (loses state) ‣ magnetic storage works well if consumers are not lagging • Disk seek becomes a problem when consumers start falling behind • SSDs way to go for high throughput topics w/ multiple consumers • EBS works well in production
  12. WHAT ABOUT BATCH? ‣ clients ask to re-process older data

    ‣ expanded join window for late events ‣ correct at-least-once semantics of Kafka / Samza ‣ Stuff happens, fix realtime hiccups ‣ We keep all data in Spark transient, store in S3 ‣ Clusters are disposable, run on AWS spot
  13. WRITE ONCE, RUN LAMBDA ‣ Scala DSL to write data

    join / transformation / aggregation once ‣ Can be expressed using different drivers ‣ as Storm topology, Samza job, or Cascading job
 ‣ MapReduce no good? Spark is what the cool kids use? ‣ No problem! ‣ Write new driver for Spark, replace the Cascading driver ‣ Hundreds of pipelines moved from Hadoop to Spark in one month!
  14. COLLECTING METRICS ‣ Monitor latencies at every stage ‣ Identify

    bottlenecks as they happen ‣ All our service incorporate the same metrics collector ‣ JVM (heap, gc) & System metrics (cpu, network, disk) ‣ Application level metrics • Time spent consuming / processing / producing at each stage • Request latencies, error rates • Amount of data processed • Consumer lag in messages + time
  15. CONSUMING METRICS ‣ Put all the metrics into Druid to

    diagnose in realtime ‣ 15 billion metric data points per day ‣ Interactive exploration allows us to pinpoints problems quickly ‣ Granularity down to the individual query or server level ‣ Separate monitoring from alerting ‣ Make sure you have a separate system for critical alerts
  16. DRUID ‣ Fast Distributed Column-Oriented Data Store ‣ Built For

    Interactive Analytics ‣ Exactly-once streaming ingestion ‣ Interactive slicing and dicing
  17. 2015 DRUID ARCHITECTURE Broker Node Historical Node Historical Node Real-time

    Node Broker Node Queries Batch Real-time Node Streaming Handover
  18. INGESTING DATA ‣ Streams are indexed and queryable in realtime

    ‣ Batches replace realtime data at their own pace ‣ Druid makes this all happen seamlessly ‣ Data is immediately available for queries ‣ Leverages existing Hadoop / Spark resources for batch ingestion
  19. DRUID DATA EVOLVES WITH YOU ‣ Data is chunked up

    in atomic units called segments ‣ Each segment represent a chunk of time (typically or day) ‣ New segments atomically replace older versions ‣ Batch data seamlessly replaces realtime data ‣ Schemas can evolve over time ‣ Druid handles mixed schemas transparently ‣ Supports schema-less ingestion
  20. DRUID AT SCALE ‣ Production cluster runs several hundred nodes

    ‣ Several hundred terabytes of compressed + pre-aggregated data ‣ Typical event is complex: > 60 dimensions > 20 metrics ‣ Realtime • > 3 million events per second on average • > 6 Gigabytes per second ‣ All Aggregated on the fly ‣ Hundreds of concurrent requests – close to 1 million queries per day
  21. DRUID IS ALWAYS ON ‣ Replacing or upgrading nodes is

    seamless. ‣ Every component is stateless or fails over transparently ‣ Druid can always live upgrade from one version to the next ‣ Our current cluster has been on-line since 2011
  22. SCALING FOR PERFORMANCE ‣ Want things to be faster? Simply

    add nodes ‣ Rebalancing data to use additional capacity? ‣ Automatic, no downtime, no service degradation
 ‣ Druid data is memory mapped and de-compressed on the fly ‣ Want more in-memory? Just add RAM ‣ Want to save some $? Just add Disk ‣ RAM is expensive, SSDs and CPU are cheap
  23. SCALING FOR RELIABILITY / PREDICTABILITY ‣ Data distribution is highly

    customizable ‣ Tiers of data can serve different latency needs ‣ Tiers can make replicas rack/datacenter-aware ‣ Queries can be prioritized across tiers ‣ Replicas can be put on cheaper hardware ‣ Many levels of caching ‣ Make sure your ZooKeeper is rock solid (we use 5 nodes)
  24. WHY IS THIS IMPORTANT? ‣ Need to scale up and

    (sometimes) down dynamically ‣ Multi-tenant system, needs to serve different latency guarantees ‣ Accommodate query load and data growth without interruption ‣ Rebuilding a cluster from scratch would take several days ‣ Data needs to evolve over time