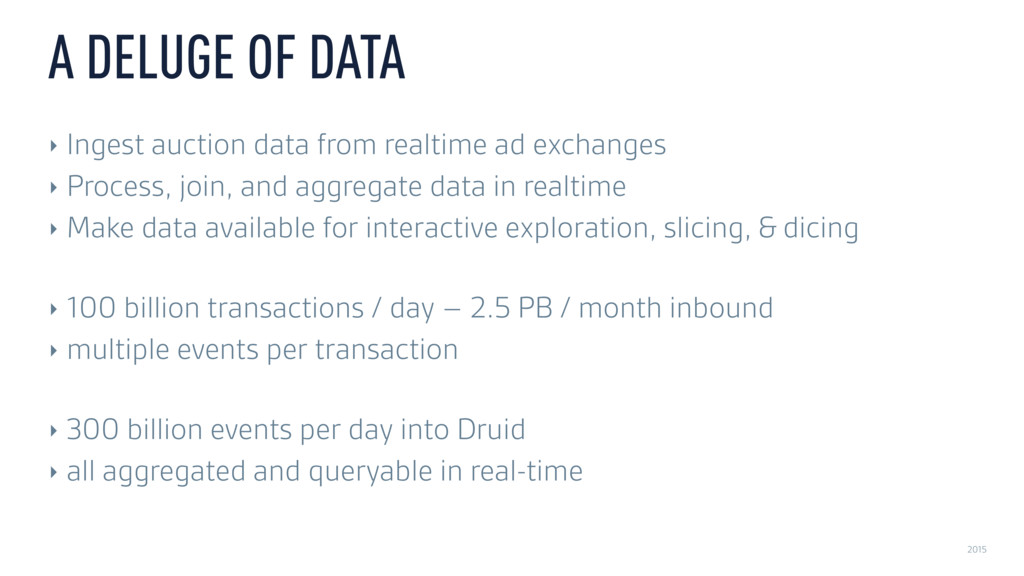
realtime ad exchanges ‣ Process, join, and aggregate data in realtime ‣ Make data available for interactive exploration, slicing, & dicing ‣ 100 billion transactions / day – 2.5 PB / month inbound ‣ multiple events per transaction ‣ 300 billion events per day into Druid ‣ all aggregated and queryable in real-time
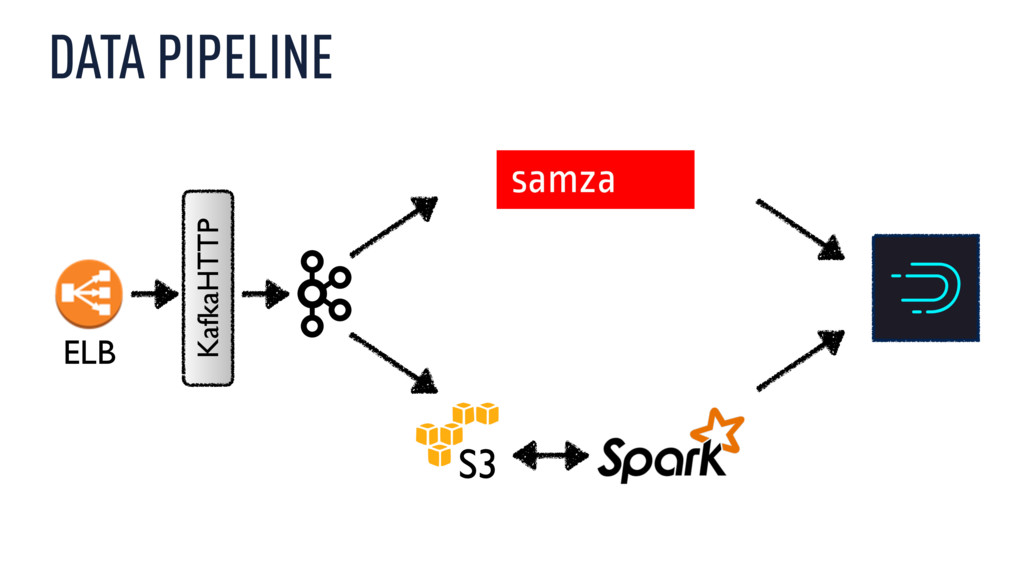
‣ Failure is not an option ‣ Data schema can change at any time ‣ Keep it very simple: ingest, timestamp, batch, compress data upfront ‣ Distribute data to available partitions ‣ 7 day retention so we can sleep tight ‣ How do we scale it?
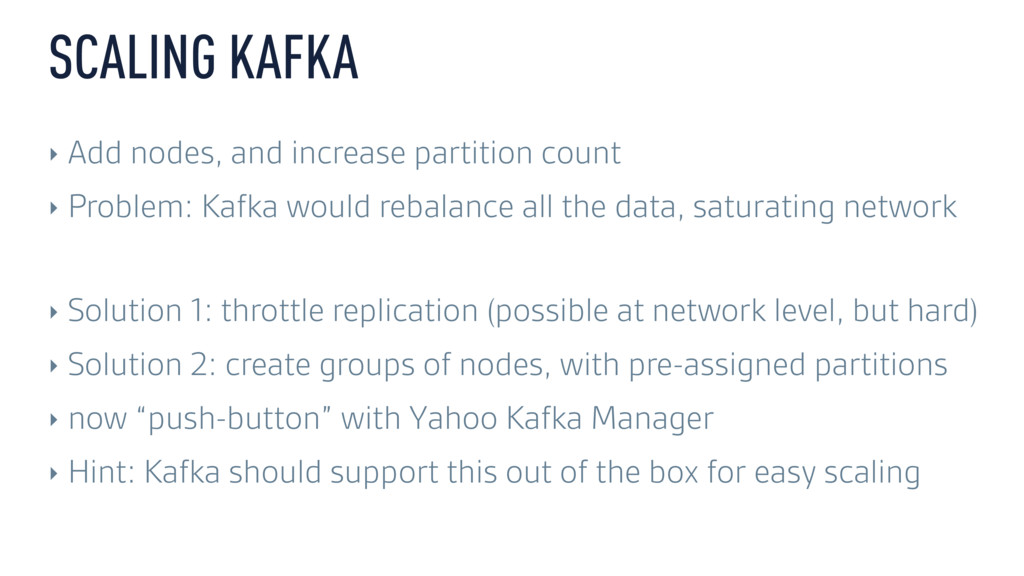
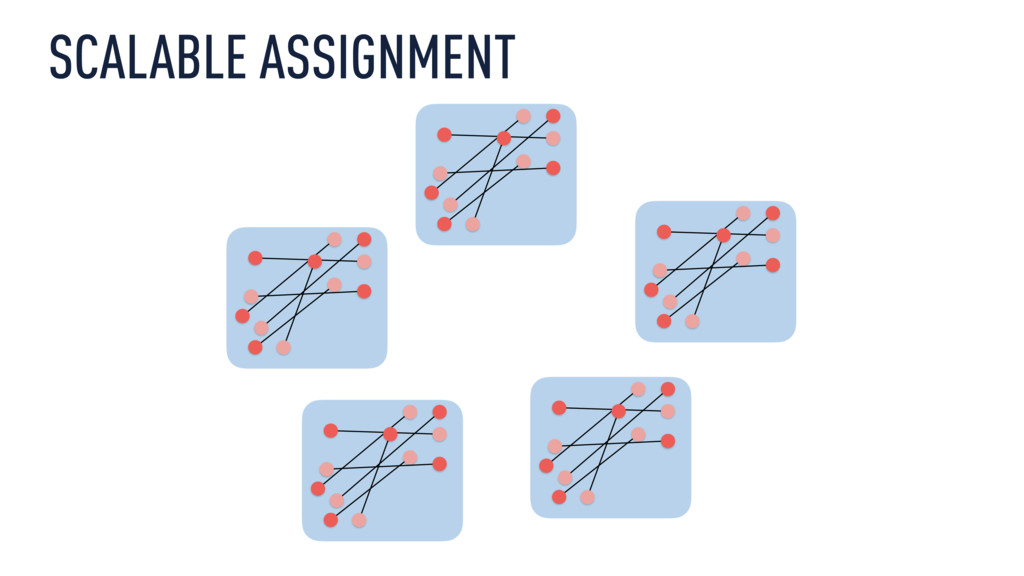
Problem: Kafka would rebalance all the data, saturating network ‣ Solution 1: throttle replication (possible at network level, but hard) ‣ Solution 2: create groups of nodes, with pre-assigned partitions ‣ now “push-button” with Yahoo Kafka Manager ‣ Hint: Kafka should support this out of the box for easy scaling
the time ‣ Kafka retention is based on time ‣ Problem: Kafka does not understand time ‣ What happens on node failure? ‣ Replace a node – replicate all data – data is now timestamped today ‣ Replicated data won’t get pruned for another week -> requires 2x disk capacity (otherwise we need to go cleanup segments by hand, not fun!) ‣ Looking forward to Kafka 0.10.1 (KIP-33) to fix this
bids ‣ impression feed ~ which auction ids got shown ‣ click feed ~ which auction ids resulted in a click ‣ Join feeds based on auction id ‣ Maybe some lookups ‣ Business logic to derive dozens of metrics and dimensions
of ~ 15-20 min ‣ Each client has slightly different workflow and complexity ‣ Workload changes all the time – because we like our clients ‣ Capacity planning is hard!
different pipelines in different JVMs ‣ heterogeneous workloads – network /disk / cpu isolation matters ‣ hard to gauge how many nodes we need ‣ we’re on AWS, let’s use many many small nodes! ‣ easy to provision, good isolation of resources ‣ one container per node, hundreds of little nodes chugging along
small ‣ how to keep load on Kafka even? ‣ partitions multiple of brokers ‣ also keep number of consumers per broker even -> # of samza containers per topic divides # of partitions ‣ but we want also want to scale up and down easily ‣ make sure your partition count has lots of divisors!
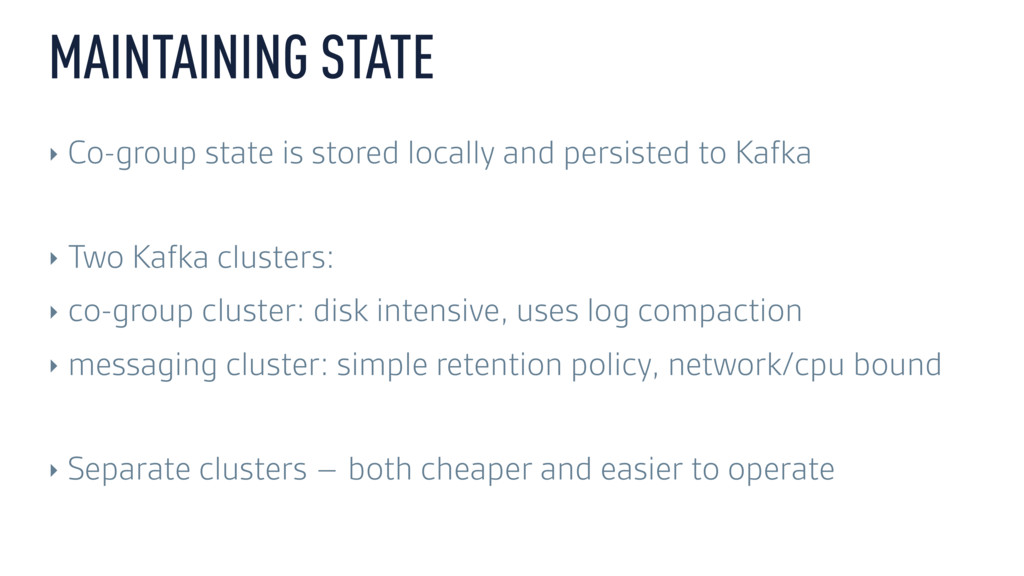
to Kafka ‣ Two Kafka clusters: ‣ co-group cluster: disk intensive, uses log compaction ‣ messaging cluster: simple retention policy, network/cpu bound ‣ Separate clusters – both cheaper and easier to operate
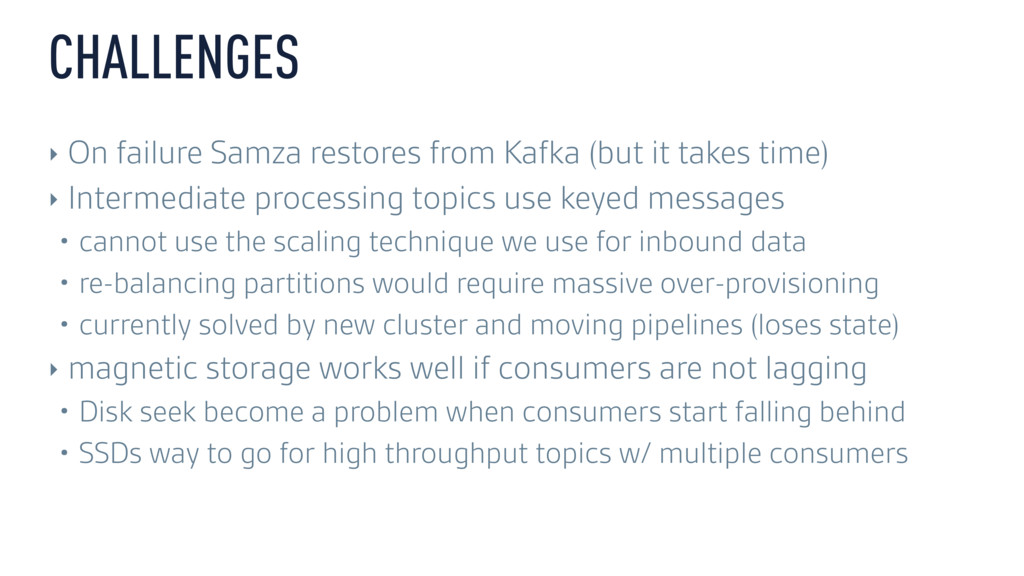
takes time) ‣ Intermediate processing topics use keyed messages • cannot use the scaling technique we use for inbound data • re-balancing partitions would require massive over-provisioning • currently solved by new cluster and moving pipelines (loses state) ‣ magnetic storage works well if consumers are not lagging • Disk seek become a problem when consumers start falling behind • SSDs way to go for high throughput topics w/ multiple consumers
bottlenecks as they happen ‣ All our service incorporate the same metrics collector ‣ JVM (heap, gc) & System metrics (cpu, network, disk) ‣ Application level metrics • Time spent consuming / processing / producing at each stage • Request latencies, error rates • Amount of data processed • Consumer lag in messages + time
diagnose in realtime ‣ 15 billion metric data points per day ‣ Interactive exploration allows us to pinpoints problems quickly ‣ Granularity down to the individual query or server level ‣ Gives both the big picture and the detailed breakdown
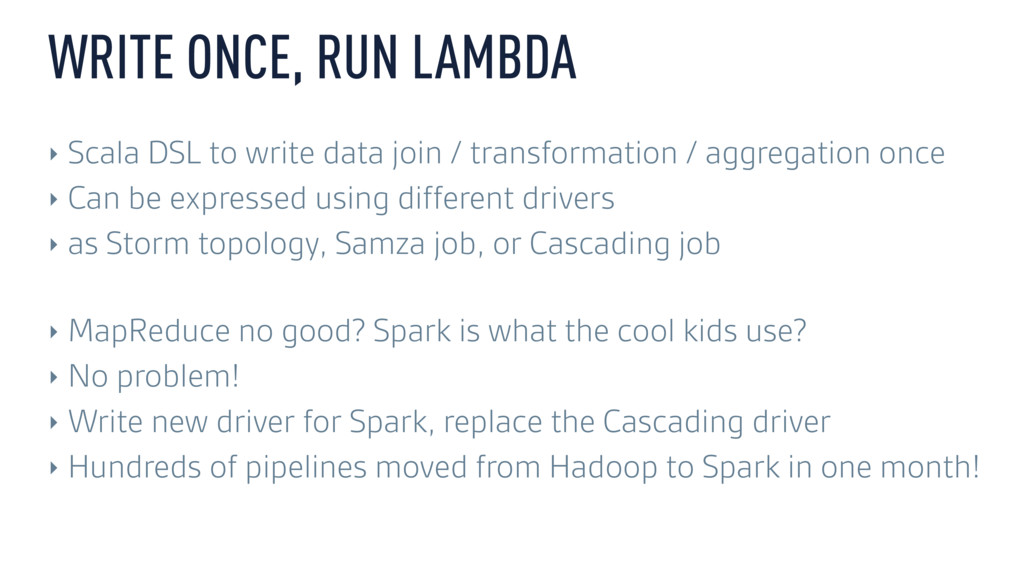
join / transformation / aggregation once ‣ Can be expressed using different drivers ‣ as Storm topology, Samza job, or Cascading job ‣ MapReduce no good? Spark is what the cool kids use? ‣ No problem! ‣ Write new driver for Spark, replace the Cascading driver ‣ Hundreds of pipelines moved from Hadoop to Spark in one month!
in realtime ‣ Batches replace realtime data at their own pace ‣ Druid makes this all happen seamlessly ‣ Data is immediately available for interactive queries ‣ Interactive slicing and dicing
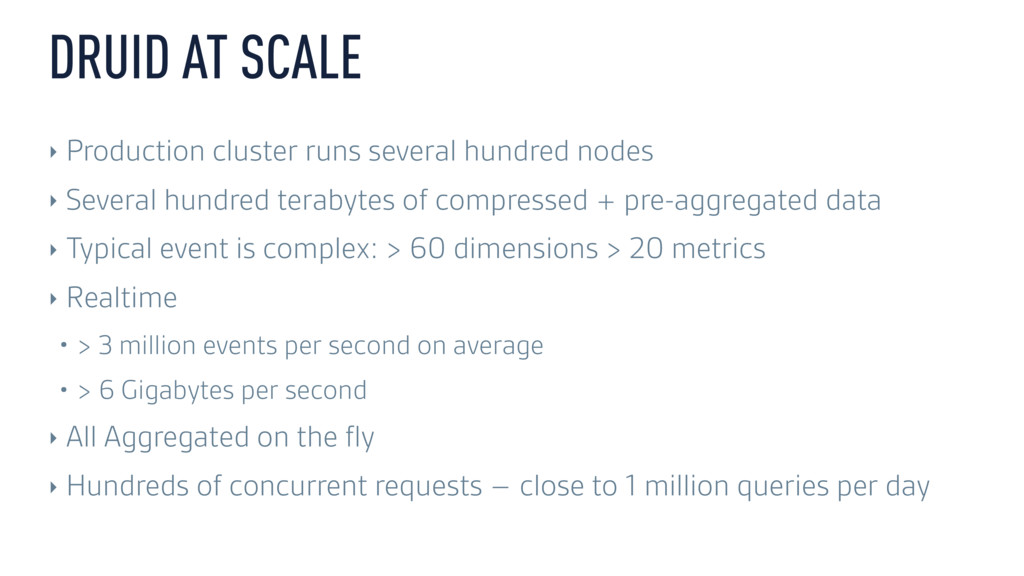
‣ Several hundred terabytes of compressed + pre-aggregated data ‣ Typical event is complex: > 60 dimensions > 20 metrics ‣ Realtime • > 3 million events per second on average • > 6 Gigabytes per second ‣ All Aggregated on the fly ‣ Hundreds of concurrent requests – close to 1 million queries per day
seamless. ‣ Every component is sateless or fails over transparently ‣ Druid can always live upgrade from one version to the next ‣ Our current cluster has been running since 2011
add nodes ‣ Rebalancing data to use additional capacity? ‣ Automatic, no downtime, no service degradation ‣ Druid data is memory mapped ‣ Want more in-memory? Just add RAM ‣ Want to save some $? Just add Disk
in atomic units called segments ‣ Each segment represent a chunk of time (typically or day) ‣ New segments atomically replace older versions ‣ Batch data seamlessly replaces realtime data ‣ Schemas can evolve over time ‣ Druid handles mixed schemas transparently ‣ Supports schema-less ingestion
(sometimes) down dynamically ‣ Accommodate query load and data growth without service interruption ‣ Rebuilding a cluster from scratch would take several days ‣ Clients can add dimensions / metrics at will