Upgrade to Pro — share decks privately, control downloads, hide ads and more …

Approximate Algorithms and Sketches in Druid

Druid
August 04, 2015

Approximate Algorithms and Sketches in Druid

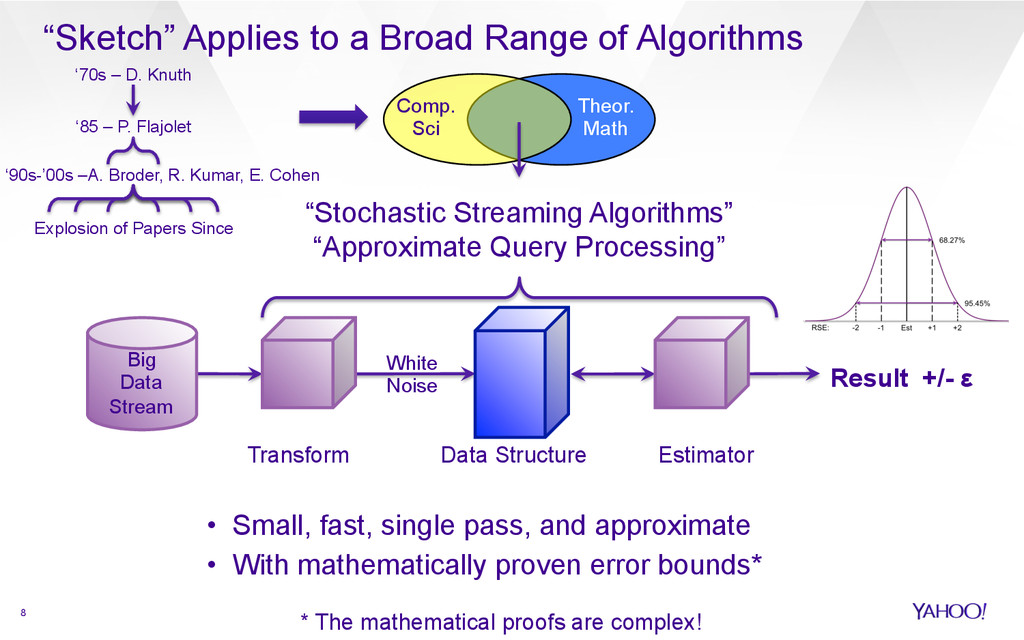
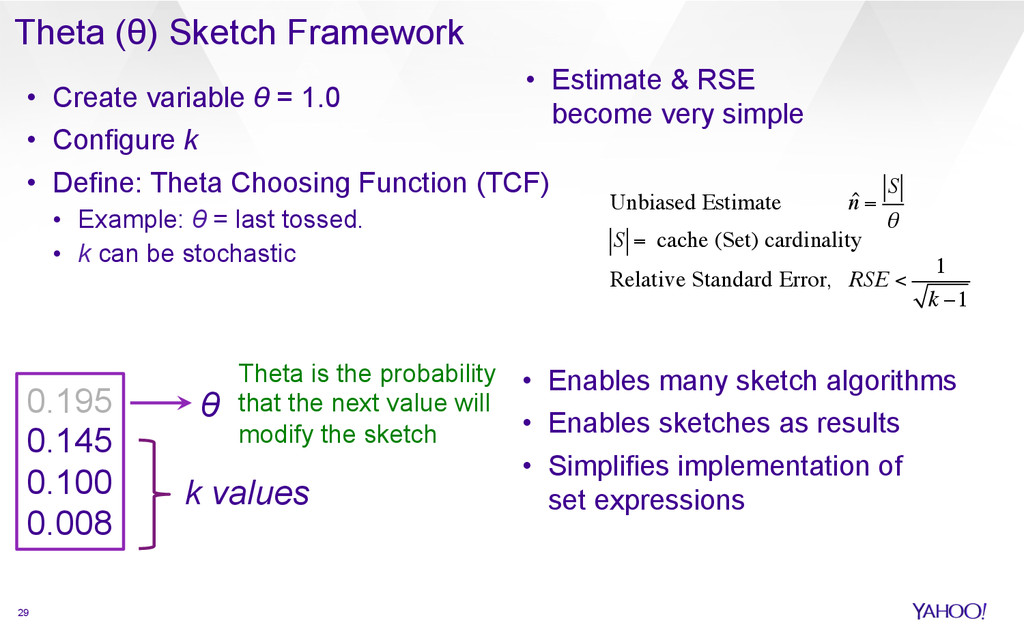
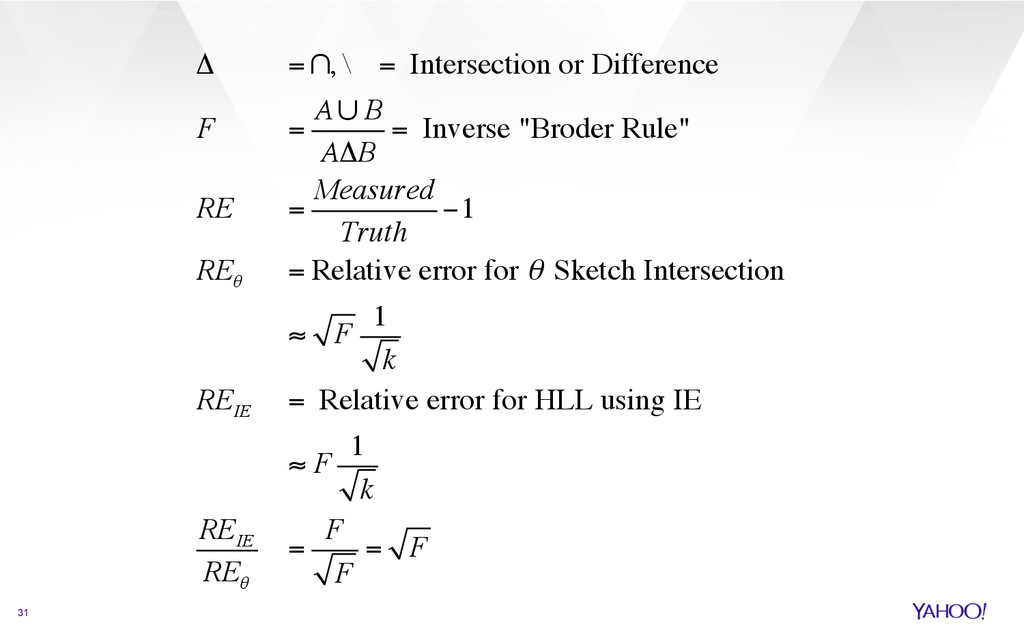
Many exact queries require computation and storage that scale linearly or superlinearly in the data. There exist many classes of problems for which exact results are not necessary. Druid has long provided support for various approximate algorithms and sketches, and recently Yahoo has been doing some work to integrate new sketch algorithms directly into Druid. We will talk about the theta sketch algorithm that Yahoo has developed and how it can be leveraged for analytics in Druid.

Druid

August 04, 2015
Tweet

More Decks by Druid

Other Decks in Research

Transcript

  1. Summarization, Approximation, Sampling:
    Improving Query Times on Big Data
    OR
    Approximate Algorithms and Sketches
    In Druid
    Lee Rhodes, Eric Tschetter,
    Much debt owed to Kevin Lang
    Hadoop Summit, 2015; Druid Meetup Aug 2015

    View Slide

  2. 2
    Yahoo Analyzes Big Data
    •  Tens of billions of user events / day
    •  Complex behaviors and interactions of User Groups

    View Slide

  3. 3
    Thus, Much Of Our Analysis Is Keyed From
    Unique Identifiers … That Appear Many Times
    •  B-Cookies
    •  Device-IDs
    •  YUIDs / SIDs
    •  Session IDs
    •  Advertiser IDs
    •  Etc.
    Big Data

    View Slide

  4. 4
    Arithmetic Operations possible with additive metrics …
    (e.g., # views, # clicks …)
    C
    i
    ∑ = C
    j

    C
    i

    C
    j
    C
    i
    C
    i

    Merging, Partitioning
    C = C
    i, j,k
    Δi,Δj,Δk

    i
    j
    k
    Dimensional
    Summing
    t1
    t2
    t3
    C
    t

    Summing
    over Time
    Differencing
    -
    C
    2

    C
    1

    C
    1
    ∑ − C
    2

    View Slide

  5. 5
    C
    i
    ∑ = C
    j

    C
    i

    C
    j
    C
    i
    C
    i

    Merging, Partitioning
    C = C
    i, j,k
    Δi,Δj,Δk

    i
    j
    k
    Dimensional
    Summing
    t1
    t2
    t3
    C
    t

    Summing
    over Time
    Called unique, or “non-additive” metrics.
    Difficult computational challenge at large scale
    Differencing
    -
    C
    2

    C
    1

    C
    1
    ∑ − C
    2

    … Are Not Possible with Metrics that have Duplicates
    (e.g., # B-Cookies, # Session-IDs, …)

    View Slide

  6. 6
    Proposition…
    If An Approximate Answer Is Acceptable …
    There Is Likely A Much More Efficient Solution!
    But How Approximate? How Efficient?

    View Slide

  7. 7
    Welcome to the New Science of
    Approximate Computing For Big Data *
    •  Sampling Oldest: CS ~1986 Stats: 1700’s
    •  Histograms
    •  Wavelets
    •  Sketches Newest: CS ~2008, Theory ~1984
    * Graham Cormode, et al. “Synopses for Massive Data:
    Samples, Histograms, Wavelets, Sketches”, 2011

    View Slide

  8. 8
    “Sketch” Applies to a Broad Range of Algorithms
    Result +/- ε
    Big
    Data
    Stream
    •  Small, fast, single pass, and approximate
    •  With mathematically proven error bounds*
    * The mathematical proofs are complex!
    “Stochastic Streaming Algorithms”
    “Approximate Query Processing”
    Theor.
    Math
    Comp.
    Sci
    ‘70s – D. Knuth
    ‘85 – P. Flajolet
    Explosion of Papers Since
    ‘90s-’00s –A. Broder, R. Kumar, E. Cohen
    Data Structure
    Transform Estimator
    White
    Noise

    View Slide

  9. 9
    Long City Block:
    1/5 Mile = 1056 Ft
    d = 100%
    You @ 2 ft From Curb
    d =2 / 1056 = 0.19%
    Couples Closer “Dreamers”
    Farther Apart
    1st Estimate: 1/d
    1 person/ (2 ft /1056 ft )
    = 528 People
    Sample contains 1 value
    Curb @ 0 ft
    The Concert Line
    How Long?

    View Slide

  10. 10
    11th in line @ 30 ft
    d = 30 / 1056 = 2.84%
    Long City Block:
    1/5 Mile = 1056 Ft
    d = 100%
    You @ 2 ft From Curb
    d =2 / 1056 = 0.19%
    Couples Closer “Dreamers”
    Farther Apart
    10 Sidewalk
    Cracks = 30 feet
    1st Estimate: 1/d
    1 person/ (2 ft /1056 ft )
    = 528 People
    Sample contains 1 value
    Better Estimate: 11/d
    11 people / (30 ft / 1056 ft )
    = 387 People
    Sample contains 11 values
    Curb @ 0 ft
    The Concert Line
    How Long?

    View Slide

  11. 11
    Ordered List
    1.0
    Uniform Random
    Hash è (0,1)
    Big Data
    0.0
    k Minimum Value (KMV) Sketch for Counting Uniques
    •  Maintain ordered list
    of hash values

    View Slide

  12. 12
    Ordered List
    1.0
    Uniform Random
    Hash è (0,1)
    Big Data
    Data as
    “White Noise”
    0.0
    0.922
    0.873
    0.822
    0.758
    0.610
    0.437
    0.386
    0.195
    0.145
    0.008
    d = 0.191
    Est = 1
    0.191≈ 5
    d = 0.008
    Est = 1
    0.008 ≈125
    k Minimum Value (KMV) Sketch for Counting Uniques
    •  Maintain ordered list
    of hash values
    •  1st Estimate = 1/d
    but NOISY!

    View Slide

  13. 13
    Ordered List
    Uniform Random
    Hash è (0,1)
    Big Data
    KMV
    Data as
    “White Noise”
    0.922
    0.873
    0.822
    0.758
    0.610
    0.437
    0.386
    0.195
    0.145
    0.008
    1.0
    0.0
    d
    V(kth) = 0.195
    •  Maintain ordered list
    of hash values
    •  Choose k Min Values
    •  Better Est =(k-1) / V(kth)
    = 2 / 0.195 = 10.26
    k Minimum Value (KMV) Sketch for Counting Uniques

    View Slide

  14. 14
    Ordered List
    1.0
    Uniform Random
    Hash è (0,1)
    Big Data
    KMV
    Data as
    “White Noise”
    0.0
    0.195
    0.145
    0.008
    V(kth) = 0.195
    •  Maintain ordered list
    of hash values
    •  Choose Min k Values
    •  Better Est =(k-1)/V(kth)
    •  Reject hash ≥ V(kth)
    •  Reject duplicates
    k Minimum Value (KMV) Sketch for Counting Uniques

    View Slide

  15. 15
    •  Maintain ordered list
    of hash values
    •  Choose Min k Values
    •  Better Est =(k-1)/V(kth)
    •  Reject hash ≥ kth min
    •  Reject duplicates
    •  Otherwise insert in order,
    toss the top value,
    track V(kth).
    Ordered List
    1.0
    Uniform Random
    Hash è (0,1)
    Big Data
    KMV
    0.0
    0.145
    0.100
    0.008
    V(kth) = 0.145
    Note that RSE is
    independent of n !
    Unbiased Est(n): ˆ
    n = (k −1) /V(kth)
    Relative Standard Error, RSE =
    σ ˆ
    n
    n
    <
    1
    k − 2
    k Minimum Value (KMV) Sketch for Counting Uniques

    View Slide

  16. 16
    Relative Error Distribution, k = 4K Sketch, Synthesized Data
    5th %ile
    95th %ile
    Mean, Median
    25th %ile
    Act RSE
    Th. RSE
    75th %ile

    View Slide

  17. 17
    Yep, It Scales!

    View Slide

  18. 18
    Relative Error Distribution, k = 64K Sketch, Real Data
    Sketch:
    Words = 64K
    Std Err: <0.4%
    Max size = 512KB
    Input: (many dimensions)
    5.2TB
    ~20B events
    5.2M Total Rows = # dim comb
    4M Sketches for Viewing BC
    RESULTS: Avg Size ~2.5KB / sketch 25,604 (0.64%) had any error at all
    Error Feather Duster Plot Cum Error Distribution
    Measured
    Theoretical
    Upper Bound
    Zero Error

    View Slide

  19. 19
    Sketch Update Speed, 64K Sketch, 64-bit Long Inputs
    45M
    142M
    Updates/sec
    20M

    View Slide

  20. 20
    Sketch Merge Time / Query
    14.5M Sk / Sec / Proc

    View Slide

  21. 21
    θ Sketches Enable Full Set Operations
    Example Queries Easily Answered using Sketches
    How many users visited both
    Sports and Finance within the last day?
    How many non-US users visited Yahoo.com
    in January that also visited in February?
    A∪B
    ( )∩ C∪D
    ( )\ E
    x
    y
    z Sketch Mart
    Big
    Data
    Stream
    And Real-time
    Set Expessions
    On Streams
    Set Operations
    Result
    S Sportst
    ( )∩S Financet
    ( )
    S Jan
    ( )∩S Feb
    ( )
    ( )\ S US
    ( )
    Batch

    View Slide

  22. 22
    Hyper-Log Log Sketches
    §  2008 Theoretical Paper by Philippe Flajolet
    §  Smallest Space Sketch for a Given Counting Accuracy
    §  Outstanding for Simple Counting and Simple Merging
    §  Unsuitable for Set Intersection or Difference
    Ø  Generally relies on “Include / Exclude” approach => Huge Error
    §  All source and target sketches in Unions must be the same size, k.
    §  Typically slower to update and merge than Theta Sketches

    View Slide

  23. 23
    Example θ Sketch System Flow Architecture
    Sketch
    Data
    Σ
    Sketch
    Data
    Sketch
    Sketch
    Data
    Σ
    Sketch
    Data
    Sketch
    Sketch
    Σ
    Sketch
    Sketch
    Sketch
    Σ
    Sketch
    Sketch
    SetOp Sketch Result
    Sketch Result
    Σ
    Hadoop Grid (Pig) Query Engine (Druid, Java)
    The Power of “Additive” Intermediates!
    ∩, \

    View Slide

  24. 24
    θ Sketch Advantages for Analysis of Uniques
    §  Scalable
    ›  User specifies Upper Bound Size / Accuracy Trade-off.
    Example: 16K Sketch: 2RSE <= 1.56% @ 95% confidence,
    max size ~ 131KB = 8*k
    ›  Sketch Upper Bound Size is Independent of Input Stream Size
    §  “Additive”, Order Insensitive, Duplicate Insensitive, and
    Parallelizable
    ›  Merge across arbitrary dimensions or time.
    ›  Enables ad-hoc queries of unique counts from intermediate sketch data
    ›  Enables simplified processing of late data
    ›  Simplifies processing pipeline architectures

    View Slide

  25. 25
    §  Fast
    ›  Obtain results from a single pass of identity-grain data => Real-Time
    ›  Updates in 10s of nSec, millions of Sketch Merges per Sec.
    §  Analysis of Set Expressions (Union, Intersection, Difference)
    ›  Accuracy superior to traditional Include / Exclude approach (and HLL).
    ›  The result of a Set Operation is Another Sketch
    ›  Can accommodate source and target sketches of different size, k,
    and different θ-Sketch type.
    §  Well Defined (Mathematically Proven) Error Properties
    ›  The width of the error distribution is a trade-off with sketch size
    ›  The theoretical error bounds are real-time queryable
    θ Sketch Advantages for Analysis of Uniques

    View Slide

  26. 26
    Tuple Sketches for User Behavior Modeling & Analysis
    Benefits
    •  Ideal for Analysis of Sets of Users
    •  Enables Accurate Estimation and Set Ops
    •  High Performance for both Real-time and Batch
    •  Standardized Library Will Promote Data Sharing Across Platforms
    Tuple Sketch:
    b1 Object
    b2 Object
    b3 Object
    Real-Time
    Data
    Stream
    Extendable For
    User Behavior
    Analysis
    θ
    Under Development
    •  Frequency Cap Modeling
    •  Stratified Sampling

    View Slide

  27. 27
    Off-Heap Sketches & Swim Lanes
    Sketch
    JVM
    Sketch
    Data
    Sketch
    Sketch
    Data
    4GB
    10GB 10GB
    Off-Java Heap “Swim Lanes”
    1 N
    Thread / CPU
    Managed via
    “Memory”
    Package

    View Slide

  28. Thank You! Questions?

    View Slide

  29. •  Enables many sketch algorithms
    •  Enables sketches as results
    •  Simplifies implementation of
    set expressions
    29
    Theta (θ) Sketch Framework
    •  Create variable θ = 1.0
    •  Configure k
    •  Define: Theta Choosing Function (TCF)
    •  Example: θ = last tossed.
    •  k can be stochastic
    k values
    0.195
    0.145
    0.100
    0.008
    θ
    Unbiased Estimate ˆ
    n =
    S
    θ
    S = cache (Set) cardinality
    Relative Standard Error, RSE <
    1
    k −1
    Theta is the probability
    that the next value will
    modify the sketch
    •  Estimate & RSE
    become very simple

    View Slide

  30. 30
    •  Set Theoretic Include / Exclude Equation
    is based on cardinalities:
    •  Unfortunately, this results in large relative errors when the
    result is small compared to the largest set:
    A∩B = A + B − A∪B
    A B
    A∩B ±εr
    = A ±εA
    + B ±εB
    − A∪B ±εA∪B
    Set Intersection and Difference Error
    Because the error
    components
    ADD!
    The smaller the
    Relative Result
    the worse the
    Relative Error

    View Slide

  31. 31
    Δ =∩, \ = Intersection or Difference
    F =
    A∪B
    AΔB
    = Inverse "Broder Rule"
    RE =
    Measured
    Truth
    −1
    RE
    θ
    = Relative error for θ Sketch Intersection
    ≈ F
    1
    k
    RE
    IE
    = Relative error for HLL using IE
    ≈ F
    1
    k
    RE
    IE
    RE
    θ
    =
    F
    F
    = F

    View Slide

  32. 32

    View Slide