Upgrade to Pro — share decks privately, control downloads, hide ads and more …

Factors for Consideration in Learning Analytics; An Investigation into Student Activity on an MLE

Factors for Consideration in Learning Analytics; An Investigation into Student Activity on an MLE

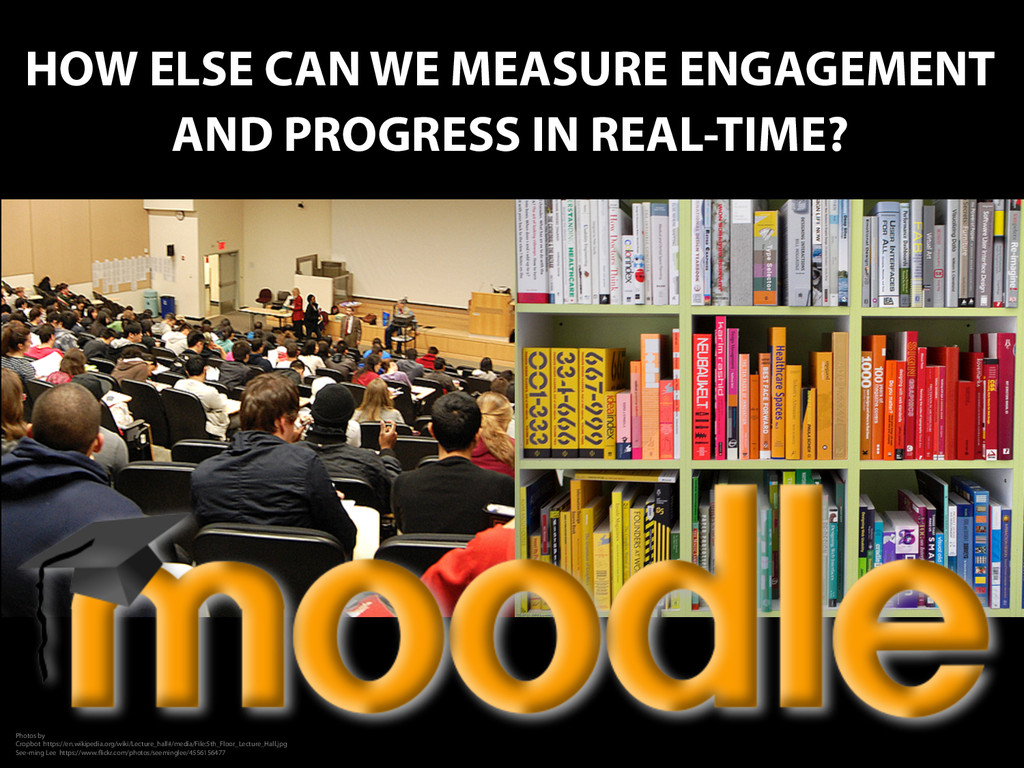
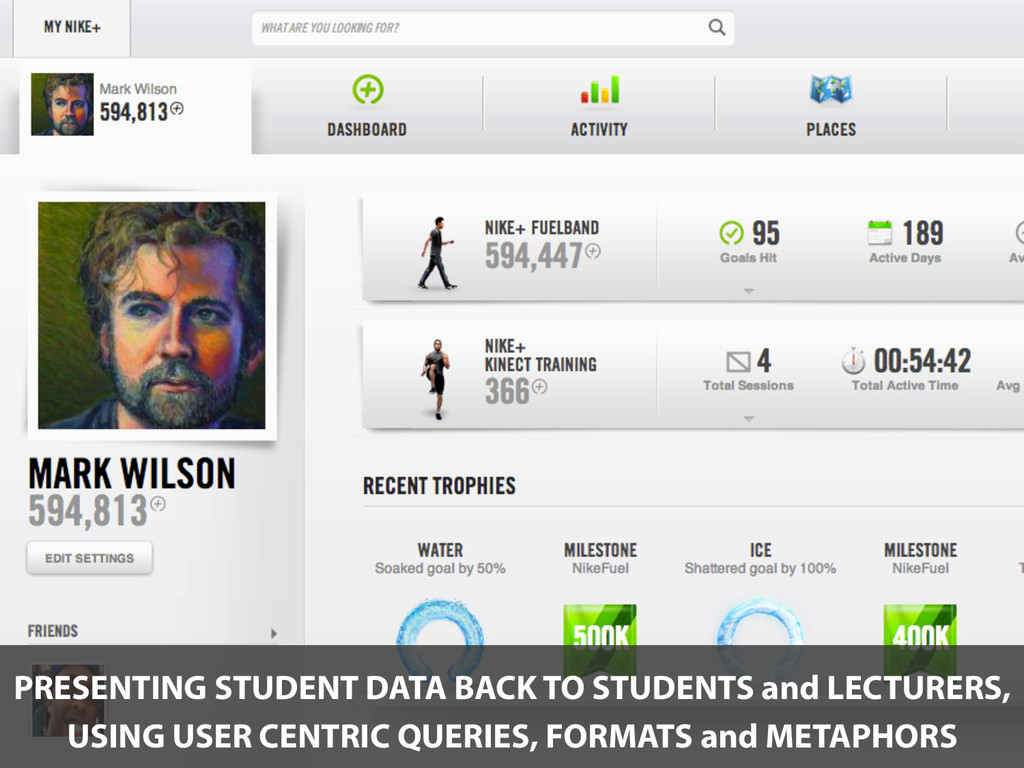
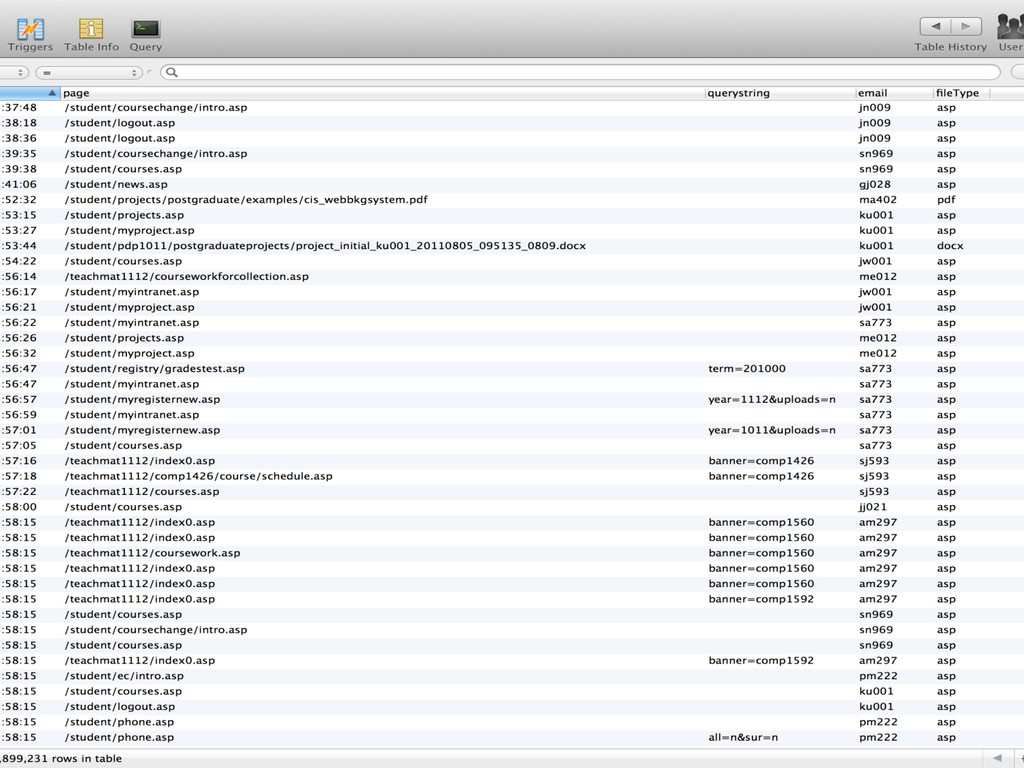
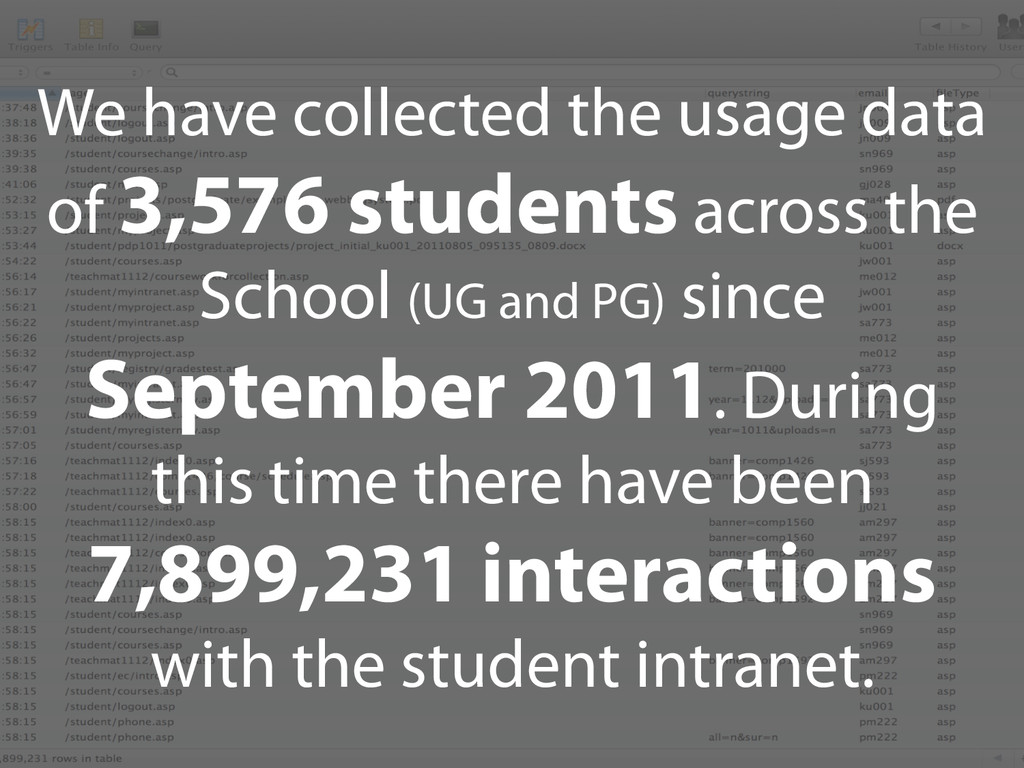
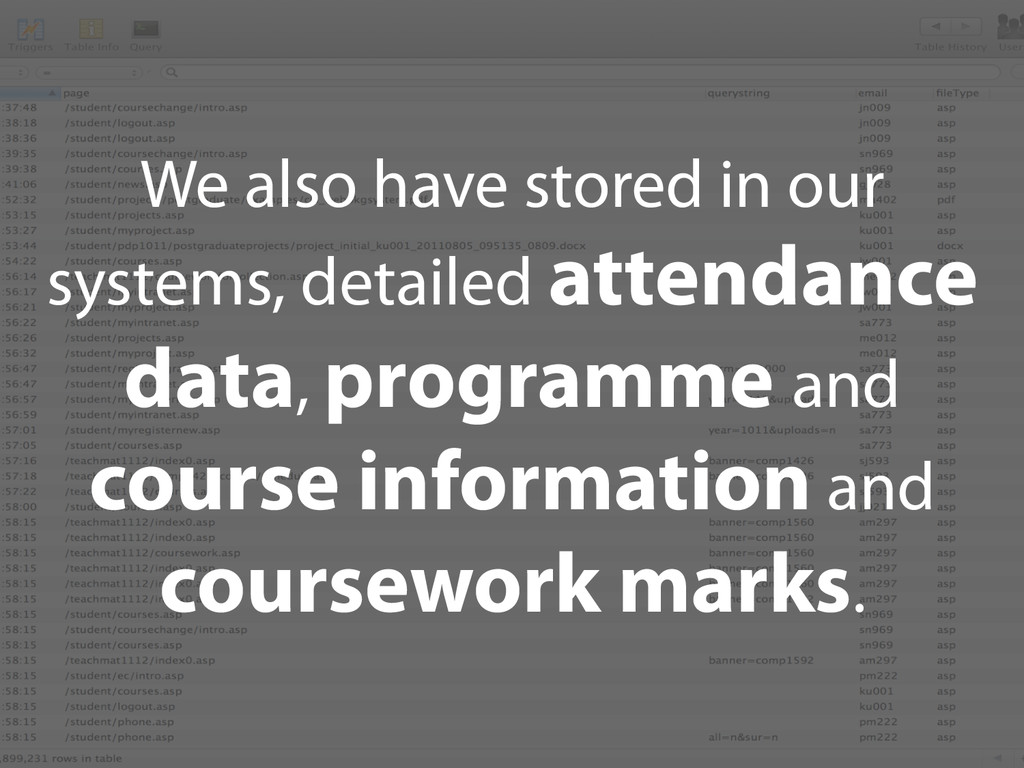
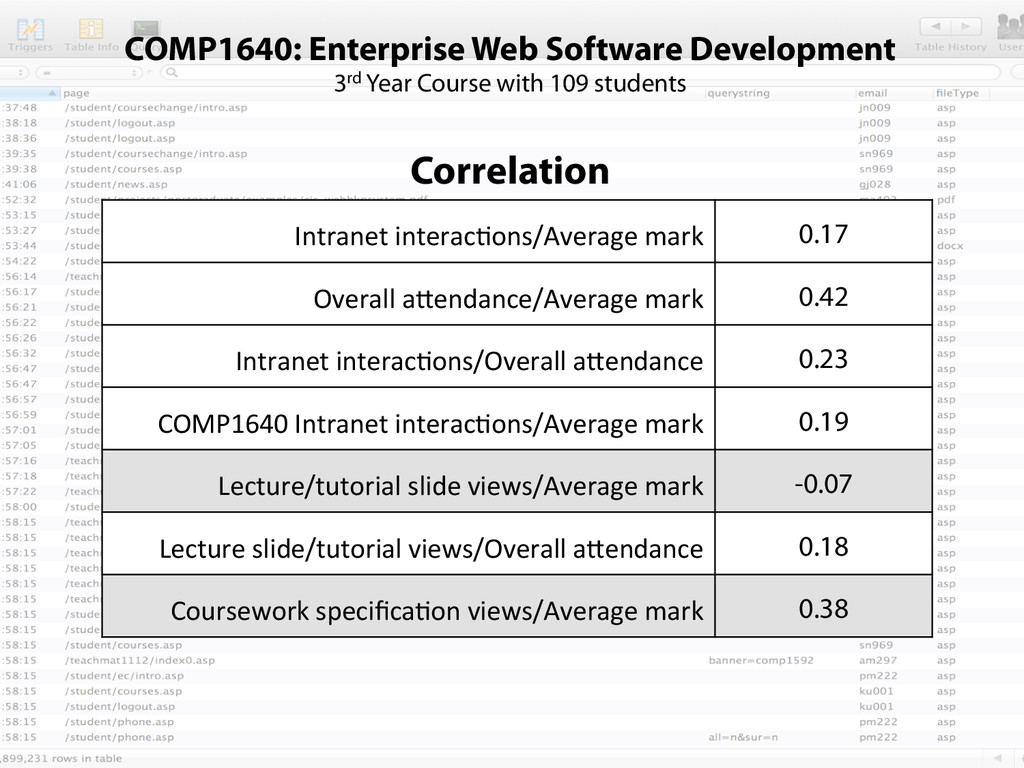
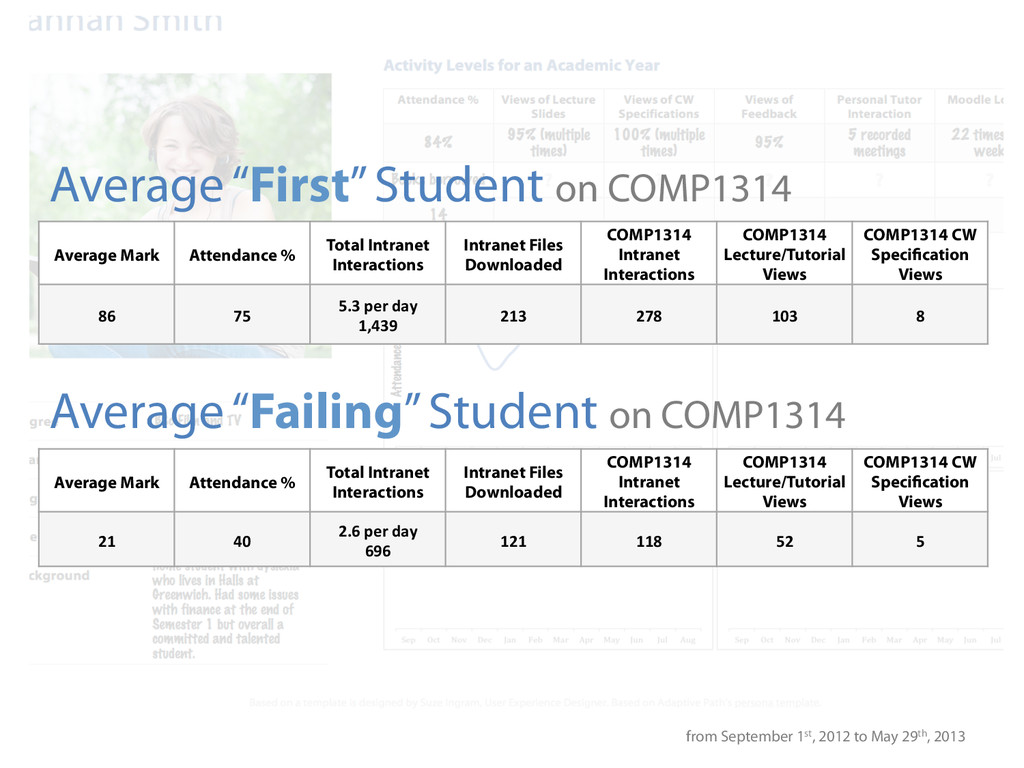
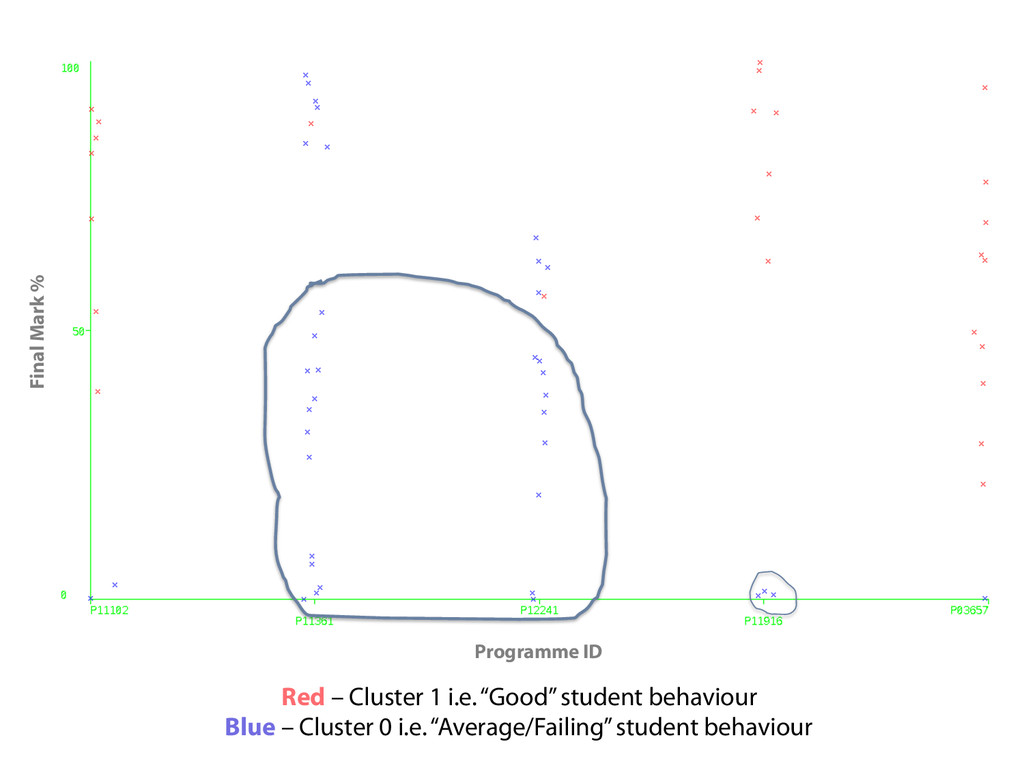
Traditionally a student’s progress and level of engagement has been measured by assessment and physical attendance. However, in a student’s day-to-day interactions with a University, other real-time measures are being generated e.g. Virtual Learning Environment (VLE) interaction, Library usage etc., with Higher Education (HE) now gathering an “astonishing array of data about its ‘customers’” (Siemens & Long, 2011).

Full details at: https://showtime.gre.ac.uk/index.php/ecentre/apt2015/paper/viewPaper/775

Ed de Quincey

June 29, 2015
Tweet

More Decks by Ed de Quincey

Other Decks in Research

Transcript

  1. Factors for Consideration in Learning Analytics; An Investigation into Student

    Activity on an MLE Dr Ed de Quincey & Dr Theo Kyriacou, Keele University Many thanks to Dr Ray Stoneham, University of Greenwich Photo by GotCredit www.gotcredit.com
  2. TRADITIONALLY A STUDENT’S PROGRESS AND LEVEL OF ENGAGEMENT HAS BEEN

    MEASURED BY ASSESSMENT Photo by Alberto G. https://www.flickr.com/photos/albertogp123/5843577306
  3. HOW ELSE CAN WE MEASURE ENGAGEMENT AND PROGRESS IN REAL-TIME?

    Photos by Cropbot https://en.wikipedia.org/wiki/Lecture_hall#/media/File:5th_Floor_Lecture_Hall.jpg See-ming Lee https://www.flickr.com/photos/seeminglee/4556156477
  4. Learning Analytics has been defined as a method for “deciphering

    trends and patterns from educational big data … to further the advancement of a personalized, supportive system of higher education.” (Johnson et al., 2013) Co-authorship network map of physicians publishing on hepatitis C (detail) Source: http://www.flickr.com/photos/speedoflife/8274993170/
  5. We have collected the usage data of 3,576 students across

    the School (UG and PG) since September 2011. During this time there have been 7,899,231 interactions with the student intranet.
  6. We also have stored in our systems, detailed attendance data,

    programme and course information and coursework marks.
  7. PERIOD UNDER STUDY: September 1st 2012 to May 29th 2013

    2,544,374 interactions with 65 different file types from 2,634 students. 2,131,278 18,974 157,607 128,676 6,368 66,129 1,851 19,561
  8. COMPARISON OF MEASURES Two Computing Undergraduate modules: •  A First

    year module: COMP1314 Digital Media, Computing and Programming •  30 credit introductory course assessed by 2 pieces of coursework and an exam. •  A Third year module: COMP1640 Enterprise Web Software Development •  a 15 credit final year course assessed by a piece of group coursework.
  9. For both of these modules, comparisons between the student attendance,

    final mark and intranet activity, categorized into various resource types, have been made. COMPARISON OF MEASURES
  10. COMP1314: Digital Media, Computing and Programming 1st Year Course with

    53 students Correlation between Average Mark and Attendance % = 0.638 0   10   20   30   40   50   60   70   80   90   100   0   10   20   30   40   50   60   70   80   90   100   A"endance  %   Average  Mark  
  11. COMP1314: Digital Media, Computing and Programming 1st Year Course with

    53 students Correlation between Average Mark and Intranet Activity = 0.601 0   500   1000   1500   2000   2500   3000   3500   0   10   20   30   40   50   60   70   80   90   100   Number  of  interac7ons  with  Intranet   Average  Mark  
  12. COMP1314: Digital Media, Computing and Programming 1st Year Course with

    53 students Correlation Intranet  interac4ons/Average  mark 0.60 Overall  a@endance/Average  mark 0.64 Intranet  interac4ons/Overall  a@endance 0.44 COMP1314  Intranet  interac4ons/Average  mark 0.63 Lecture/tutorial  slide  views/Average  mark 0.48 Lecture  slide/tutorial  views/Overall  a@endance 0.46 Coursework  specifica4on  views/Average  mark 0.23
  13. COMP1640: Enterprise Web Software Development 3rd Year Course with 109

    students Correlation between Average Mark and Intranet Activity = 0.19
  14. COMP1640: Enterprise Web Software Development 3rd Year Course with 109

    students Correlation Intranet  interac4ons/Average  mark 0.17 Overall  a@endance/Average  mark 0.42 Intranet  interac4ons/Overall  a@endance 0.23 COMP1640  Intranet  interac4ons/Average  mark 0.19 Lecture/tutorial  slide  views/Average  mark -0.07 Lecture  slide/tutorial  views/Overall  a@endance 0.18 Coursework  specifica4on  views/Average  mark 0.38
  15. Average Mark Attendance % Total Intranet Interactions Intranet Files Downloaded

    COMP1314 Intranet Interactions COMP1314 Lecture/Tutorial Views COMP1314 CW Specification Views 86   75   5.3  per  day   1,439   213   278   103   8   Average “First” Student on COMP1314 Average Mark Attendance % Total Intranet Interactions Intranet Files Downloaded COMP1314 Intranet Interactions COMP1314 Lecture/Tutorial Views COMP1314 CW Specification Views 21   40   2.6  per  day   696   121   118   52   5   Average “Failing” Student on COMP1314 from September 1st, 2012 to May 29th, 2013
  16. “First” Students vs “Failing” Students COMP1314 Average Intranet Interactions  

    0   10   20   30   40   50   60   Sep   Oct   Nov   Dec   Jan   Feb   Mar   Apr   May   Average  Number  of  Intranet  Interac7ons   First  Logs   Fail  Logs  
  17. Attribute Full Data (66 students) Cluster 0 (40 students) Cluster

    1 (26 students) programmeID P11361 P11361 P03657 CW Mark (%) 48 34 70 Attendance (%) 61 55 70 Total File Views 40 24 64 Tutorial Views 24 15 37 Lecture Views 13 6 22 CW Spec. Views 2 1 3 66 students enrolled on a Level 4 programming module (COMP1314) Cluster 0: “Average/Failing” students Cluster 1: “Good” students Results of the simple K-means algorithm revealed the two most prominent classes of students
  18. Final Mark % Programme ID Red – Cluster 1 i.e.

    “Good” student behaviour Blue – Cluster 0 i.e. “Average/Failing” student behaviour
  19. Final Mark % Programme ID Red – Cluster 1 i.e.

    “Good” student behaviour Blue – Cluster 0 i.e. “Average/Failing” student behaviour
  20. Final Mark % Programme ID Red – Cluster 1 i.e.

    “Good” student behaviour Blue – Cluster 0 i.e. “Average/Failing” student behaviour
  21. Final Mark % Programme ID Red – Cluster 1 i.e.

    “Good” student behaviour Blue – Cluster 0 i.e. “Average/Failing” student behaviour
  22. CONCLUSIONS Attendance/Intranet Activity - the first year module, showed a

    positive correlation with a student’s final grade but … Clusters - the level, programme and type of assessment should be taken into account when building predictive algorithms Repeated Downloading - either lower levels of expected digital literacy or a shift to the “cloud”
  23. FUTURE WORK Project funding secured •  Aim to identify potential

    sources of data at Keele that are suitable for LA. •  Place students and lecturers at the center of the design process of an “LA Dashboard”. •  Identify how LA can be incorporated back into learning and teaching.