Upgrade to Pro — share decks privately, control downloads, hide ads and more …

Reimagining Higher Education; The Journey from Amateur to Professional

Reimagining Higher Education; The Journey from Amateur to Professional

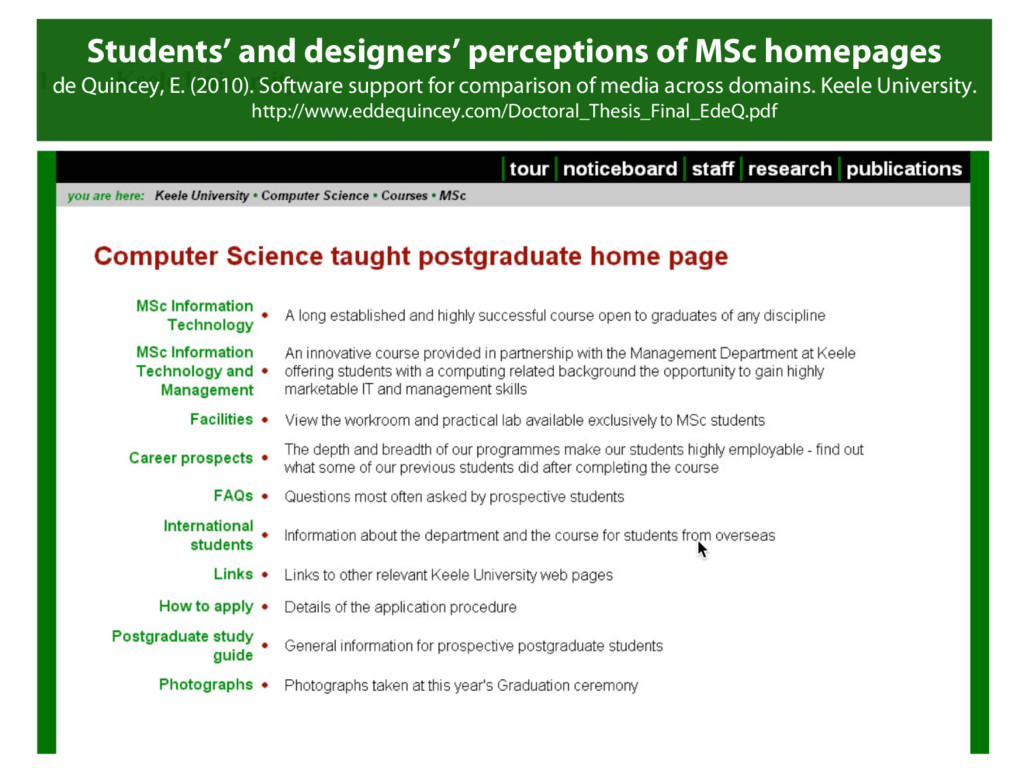
Keynote from APT2017

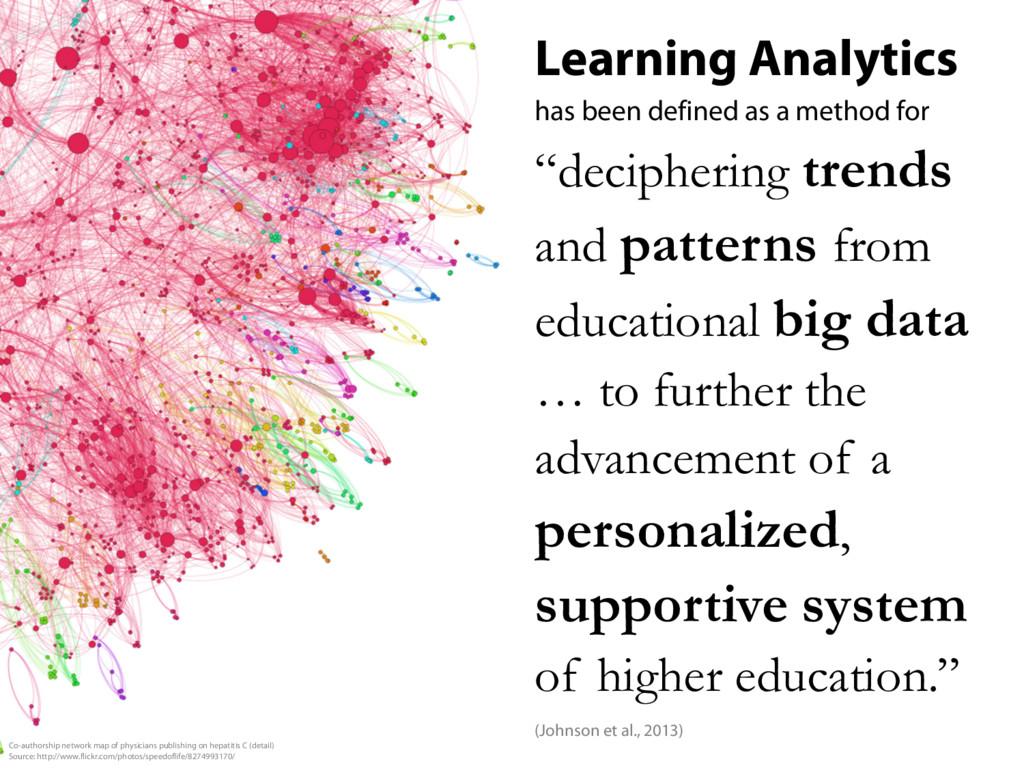
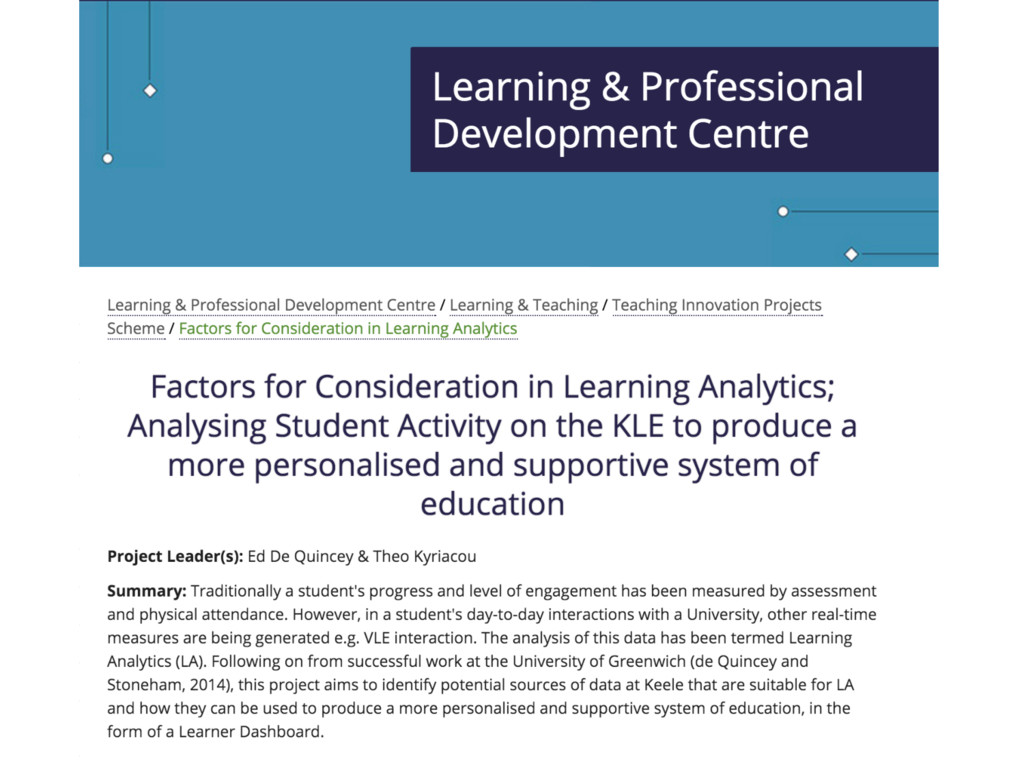
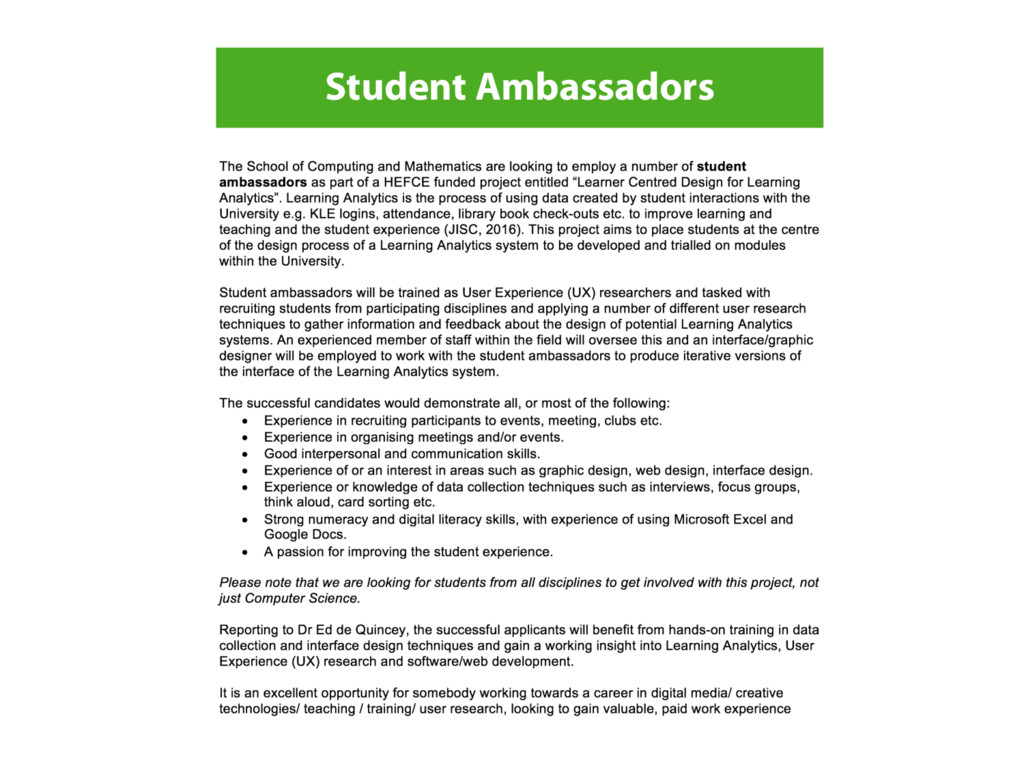
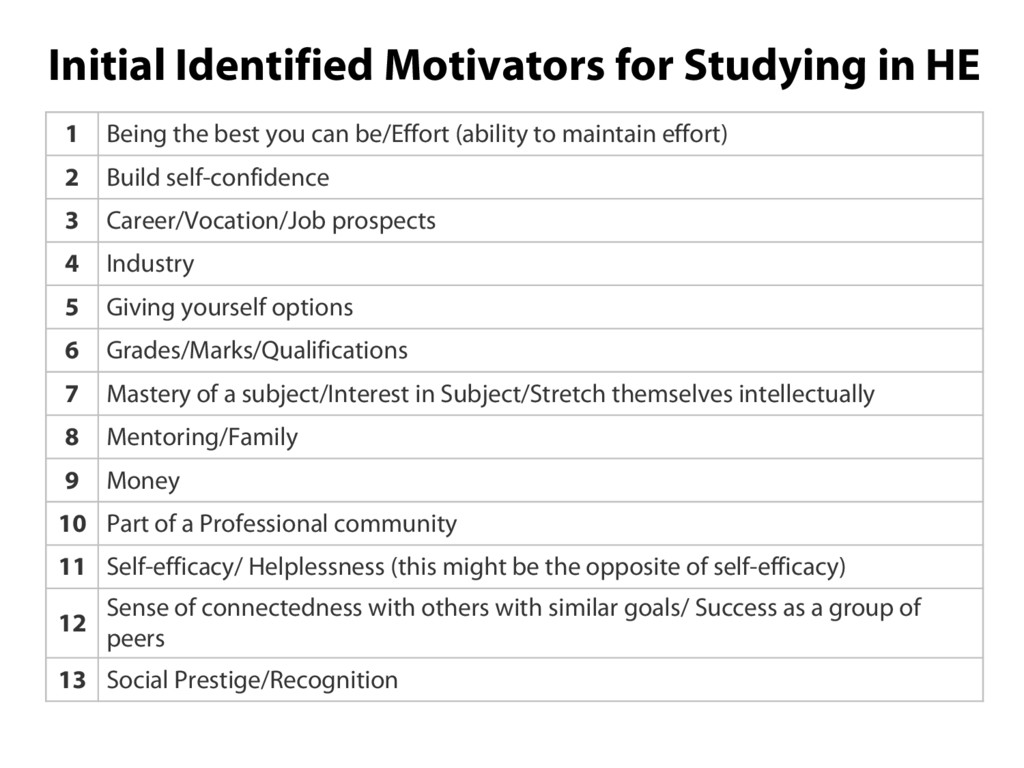
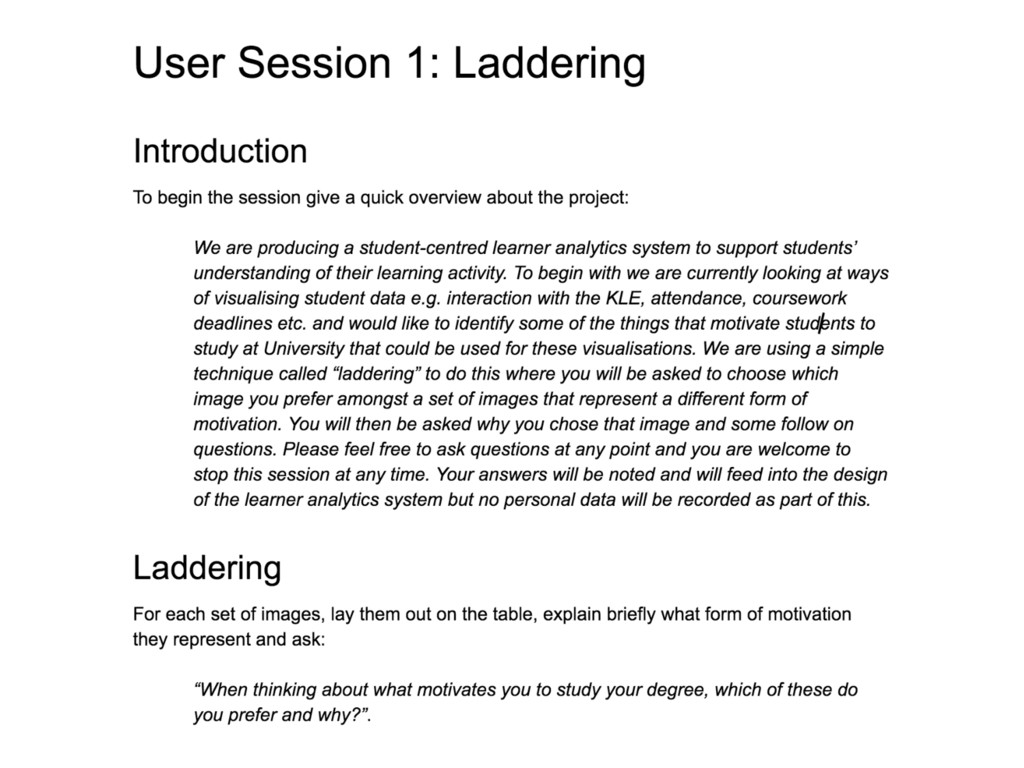
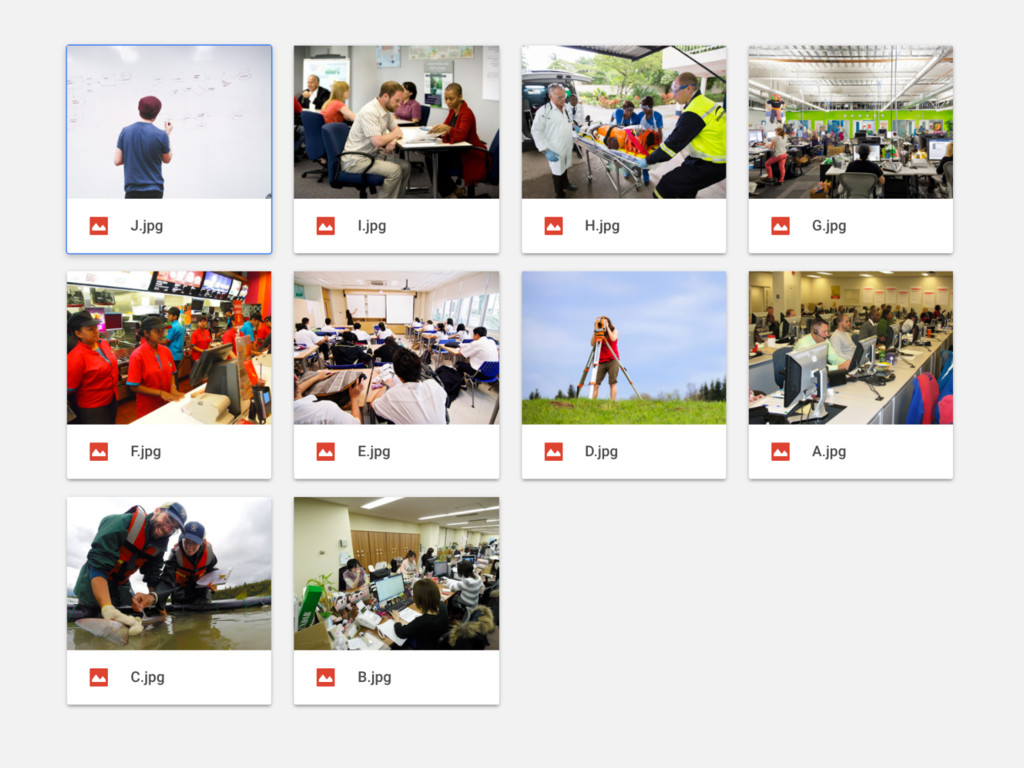
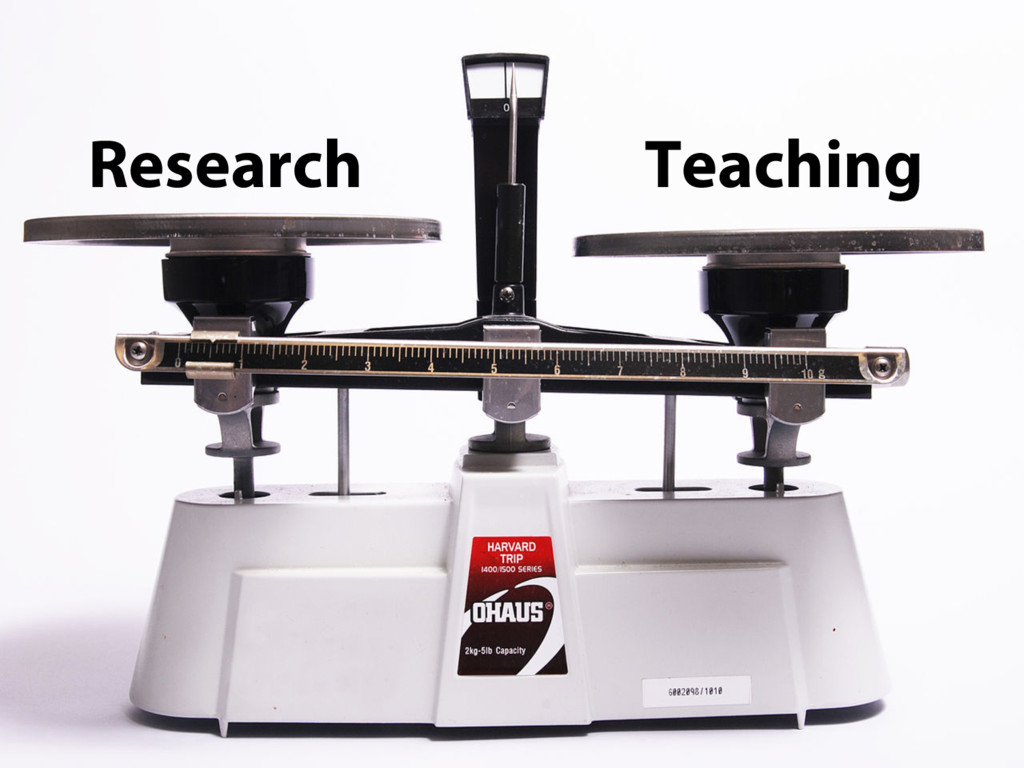
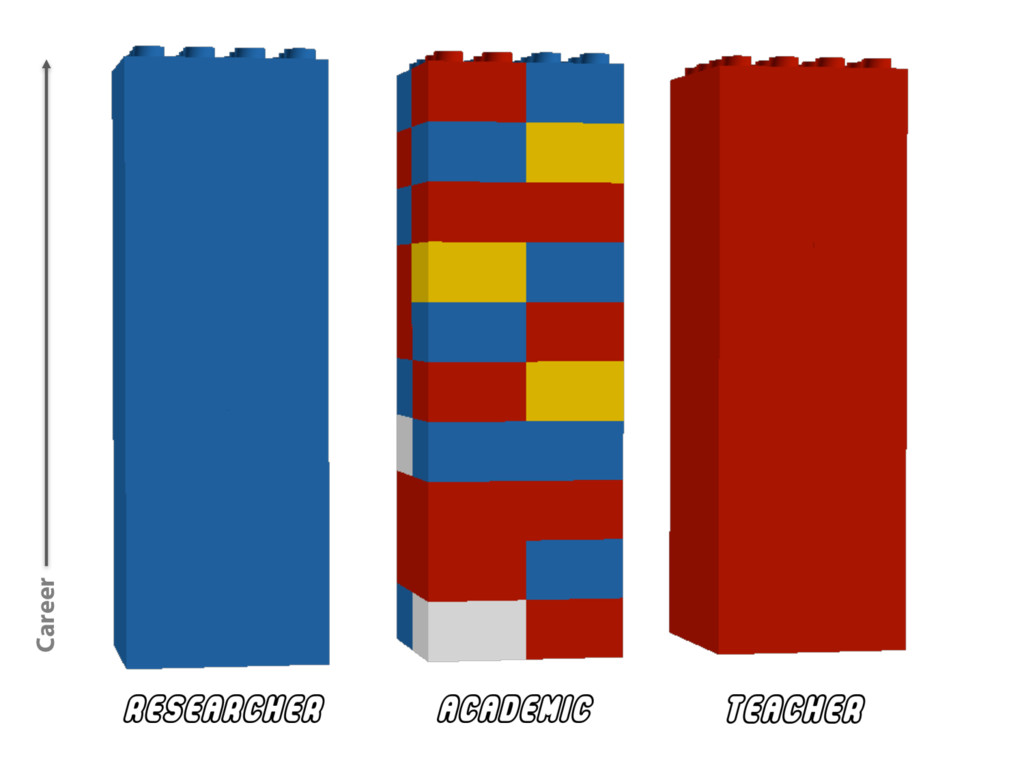
The “professional scholar, but amateur teacher” model is becoming increasingly indefensible as HE becomes more diverse, accountable and adapts to advances in technology and student expectations (McLaren, 2005). However, the route from “amateur” to “professional” status can be daunting and often not align with traditional academic views and progression pathways. This keynote will provide a personal reflection on this journey and describe a number of case studies that have used technologies and techniques from Computer Science to enhance learning and teaching. It will also propose that placing the “user” at the centre when “reimagining higher education” is key to its future, and can be used to bridge the gap between teaching and research.

Ed de Quincey

July 04, 2017
Tweet

More Decks by Ed de Quincey

Other Decks in Education

Transcript

  1. Reimagining Higher Education; The Journey from Amateur to Professional Dr

    Ed de Quincey School of Computing and Mathematics, Keele University
  2. Dr Ed de Quincey @eddequincey Senior Lecturer in Computer Science,

    UG and PG Course Director School of Computing and Mathematics, Keele University Senior Fellow of the HEA instagram.com/eddequincey
  3. 1. Go to → https://socrative.com 2. Click “STUDENT LOGIN” at

    the top 3. Enter “UOGAPT” in the Room Name
  4. Students’ and designers’ perceptions of MSc homepages de Quincey, E.

    (2010). Software support for comparison of media across domains. Keele University. http://www.eddequincey.com/Doctoral_Thesis_Final_EdeQ.pdf
  5. Results Students interested in Content Super Ordinate Constructs Form or

    Content Number of relevant pages Content Number of links to other IT courses Content Current students viewpoint shown Content Qualifications Content Departmental Information Content Familiarity Content Amount of information Content Use of acronyms Content Want to go on course Content Readability Form Pictures of people Content Welcoming Form Super Ordinate Constructs Form or Content Navigation Position Form Colour of links Form Underlined links Form Page balance Form Resizability Form Page alignment Form Logo position Form User friendly Form Opportunities after course Content Text or graphics Form Text Size Form How to apply Content Web designers interested in Form #CSC10034 Requirements, Evaluation and Professionalism @eddequincey
  6. Expectations of an “excellent school” As a prospective student what

    would you expect to see? PROJECTIVE TECHNIQUE
  7. “School must look well kept – carpets, paint, lighting” “Expect

    TFT’s in first lab you see when entering the building” “Computer facilities are part of it – but general feel of building also important” “Giving students merchandise – mouse mats, usb sticks, dept clothing - so they feel they belong” “Clear main entrance with focal point” “All labs looking good / up to date” “Research / technology room – to show off cool research” Example Responses #CSC10034 Requirements, Evaluation and Professionalism @eddequincey
  8. • Complimentary Studies Module (CSP) • ~150 students • 12

    weeks • 8 Practicals • Case study – develop a website for the School of Computing and Mathematics #CSC10034 Requirements, Evaluation and Professionalism @eddequincey CSC-10020 The Web
  9. Twitter was introduced during the first tutorial session for 3

    courses at UG and PG level, across 2 Schools within the University
  10. 1. All tweets from lecturer accounts 2. All tweets that

    contained the relevant course codes e.g. #COMP1314 3. All direct messages and replies
  11. 161 tweets (56%) were @mentions i.e. the lecturer replying to

    a student’s tweet indicating a good level of 2 way- communication
  12. Learning Analytics has been defined as a method for “deciphering

    trends and patterns from educational big data … to further the advancement of a personalized, supportive system of higher education.” (Johnson et al., 2013) Co-authorship network map of physicians publishing on hepatitis C (detail) Source: http://www.flickr.com/photos/speedoflife/8274993170/
  13. We have collected the usage data of 3,576 students across

    the School (UG and PG) since September 2011. During this time there have been 7,899,231 interactions with the student intranet.
  14. For two modules (Levels 4 & 6), comparisons between the

    student attendance, final mark and intranet activity, categorized into various resource types, were made. COMPARISON OF MEASURES
  15. COMP1314: Digital Media, Computing and Programming 1st Year Course with

    53 students Correlation between Average Mark and Attendance % = 0.638 0 10 20 30 40 50 60 70 80 90 100 0 10 20 30 40 50 60 70 80 90 100 Attendance % Average Mark
  16. COMP1314: Digital Media, Computing and Programming 1st Year Course with

    53 students Correlation between Average Mark and Intranet Activity = 0.63 0 500 1000 1500 2000 2500 3000 3500 0 10 20 30 40 50 60 70 80 90 100 Number of interactions with Intranet Average Mark
  17. COMP1314: Digital Media, Computing and Programming 1st Year Course with

    53 students Correlation Intranet interactions/Average mark 0.60 Overall attendance/Average mark 0.64 Intranet interactions/Overall attendance 0.44 COMP1314 Intranet interactions/Average mark 0.63 Lecture/tutorial slide views/Average mark 0.48 Lecture slide/tutorial views/Overall attendance 0.46 Coursework specification views/Average mark 0.23
  18. COMP1640: Enterprise Web Software Development 3rd Year Course with 109

    students Correlation Intranet interactions/Average mark 0.17 Overall attendance/Average mark 0.42 Intranet interactions/Overall attendance 0.23 COMP1640 Intranet interactions/Average mark 0.19 Lecture/tutorial slide views/Average mark -0.07 Lecture slide/tutorial views/Overall attendance 0.18 Coursework specification views/Average mark 0.38
  19. Attribute Full Data (66 students) Cluster 0 (40 students) Cluster

    1 (26 students) programmeID P11361 P11361 P03657 CW Mark (%) 48 34 70 Attendance (%) 61 55 70 Total File Views 40 24 64 Tutorial Views 24 15 37 Lecture Views 13 6 22 CW Spec. Views 2 1 3 66 students enrolled on a Level 4 programming module (COMP1314) Cluster 0: “Average/Failing” students Cluster 1: “Good” students Results of the simple K-means algorithm revealed the two most prominent classes of students
  20. Red – Cluster 1 i.e. “Good” student behaviour Blue –

    Cluster 0 i.e. “Average/Failing” student behaviour Final Mark % Programme ID
  21. Final Mark % Programme ID Red – Cluster 1 i.e.

    “Good” student behaviour Blue – Cluster 0 i.e. “Average/Failing” student behaviour
  22. Red – Cluster 1 i.e. “Good” student behaviour Blue –

    Cluster 0 i.e. “Average/Failing” student behaviour Final Mark % Programme ID
  23. Red – Cluster 1 i.e. “Good” student behaviour Blue –

    Cluster 0 i.e. “Average/Failing” student behaviour Final Mark % Programme ID
  24. Apple Lisa PRESENTING STUDENT DATA BACK TO STUDENTS and LECTURERS,

    USING USER CENTRIC QUERIES, FORMATS and METAPHORS
  25. Review of Existing Systems Few systems available for general use

    ✖ Primarily targeted at educators. Only 5 of the 22 systems being designed purely for use by students Only 4 of the studies gathered the requirements for the systems directly from users Currently analysing visualisation techniques used and types/sources of data used
  26. WP3. Requirements Gathering Set as Coursework Case Study: Identify GUI

    metaphors that will engage and motivate them as learners and personalise their own learning experience 2nd Year Computing Module - 82 students in 14 groups Deliverables included: Sets of User Persona, analysed results of requirements elicitation sessions and annotated screen mock-ups of potential LA Dashboards (highlighting 5 key features along with objective justifications wherever possible).
  27. 'My Timeline': Past events which have been completed successfully provide

    gratification to the user in the form of positive icons such as thumbs up or smiley faces. The past timeline balances with the upcoming events to try and alleviate future workload stress by demonstrating positive success at the same time.
  28. Course/Module Progress Bar: a progress bar based upon the how

    far in the course users are. Indicating how much of the course they should know and how much time is left until the course finishes.
  29. Comparison with peers: The chance for the user to see

    how they are comparing with the top 20% of the class and how they are doing compared with the average mark.
  30. HEFCE Catalyst Grant £99,790 (£49,988 from Catalyst Fund, £49,802 in

    matched funding from Keele) Title: Learner Centred Design for Learning Analytics This project aims to avoid the common problem in Learning Analytics (LA) of the technology and data driving the user experience, and therefore the ability to interpret and use the information. By sharing the data directly with students, using student-centred representations of their learning activity, this project aims to facilitate a common understanding of the learning experience between lecturers and students. Expanding on a successful teaching innovation project at Keele University interface metaphors for LA will be identified that motivate and personalise the learning experience of cohorts with differing levels of technical experience and levels of digital literacy. We will then produce appropriate visualisations of student activity based on the data available at Keele University and incorporate them into the delivery of relevant modules with the key aims of increasing engagement, making the VLE a more active space for learning and teaching and bridging the current gap between physical and digital spaces.
  31. Outcomes for students Students in lecture hall ©Jirka Matousek via

    Flickr • access to personalised notifications and support e.g. highlighting/suggesting resources that have not been viewed. • increased levels of engagement, in particular VLE usage. • personalisation of cohort module delivery by the lecturer • real-time feedback for students enabling them to judge their progress during a module using a different metric than current models of formative and summative feedback. • direct involvement with the development of tools that support their learning.
  32. 1 Being the best you can be/Effort (ability to maintain

    effort) 2 Build self-confidence 3 Career/Vocation/Job prospects 4 Industry 5 Giving yourself options 6 Grades/Marks/Qualifications 7 Mastery of a subject/Interest in Subject/Stretch themselves intellectually 8 Mentoring/Family 9 Money 10 Part of a Professional community 11 Self-efficacy/ Helplessness (this might be the opposite of self-efficacy) 12 Sense of connectedness with others with similar goals/ Success as a group of peers 13 Social Prestige/Recognition Initial Identified Motivators for Studying in HE
  33. Looks how they feel Shows how hard they are trying

    No point in spending £9,000 if you’re not going to try hard and do well A B ↑ ↑ “When thinking about what motivates you to study your degree, which of these do you prefer and why?”. “Why..?” “Why..?” Laddering
  34. Fun

  35. “The cost of poor usability is high. It includes unsatisfied,

    ineffective learners and ineffective e-learning initiatives. Learners who find an e-learning program hard to use might: • Carry out their task reluctantly • Be confused about the learning exercise • Fail to engage with the e-learning, possibly abandon the e-learning completely, fail to learn or retain knowledge.” (Abedour and Smith, 2006) ©CollegeDegrees360 via Flickr