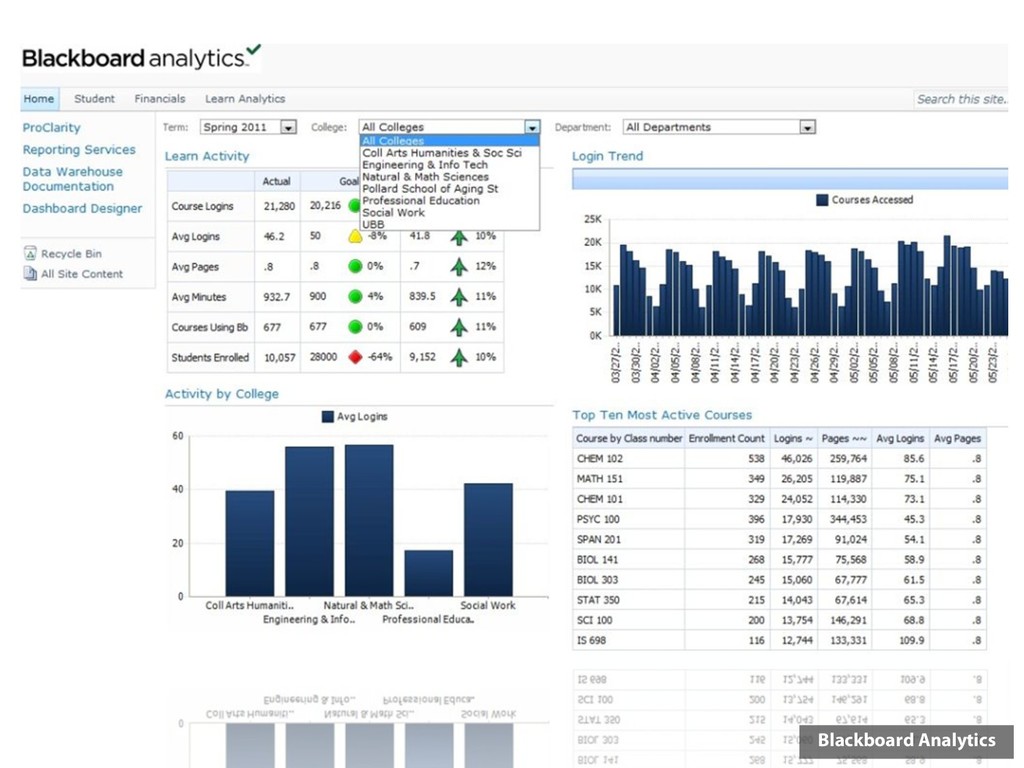
run • No way to bulk download all “raw” data • Student Overview for a Single Course is the most useful BUT have to run for each student KLE Data Review ✓ Around 11 “reports” available 9 Course Reports, a Performance Dashboard and a Retention Centre
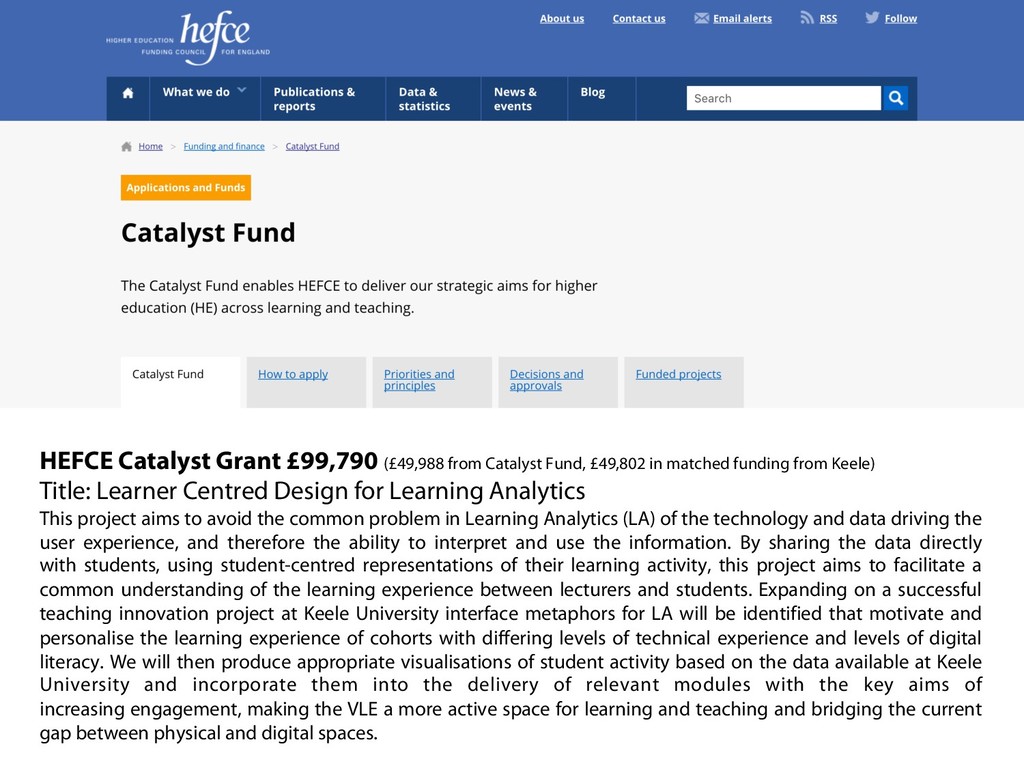
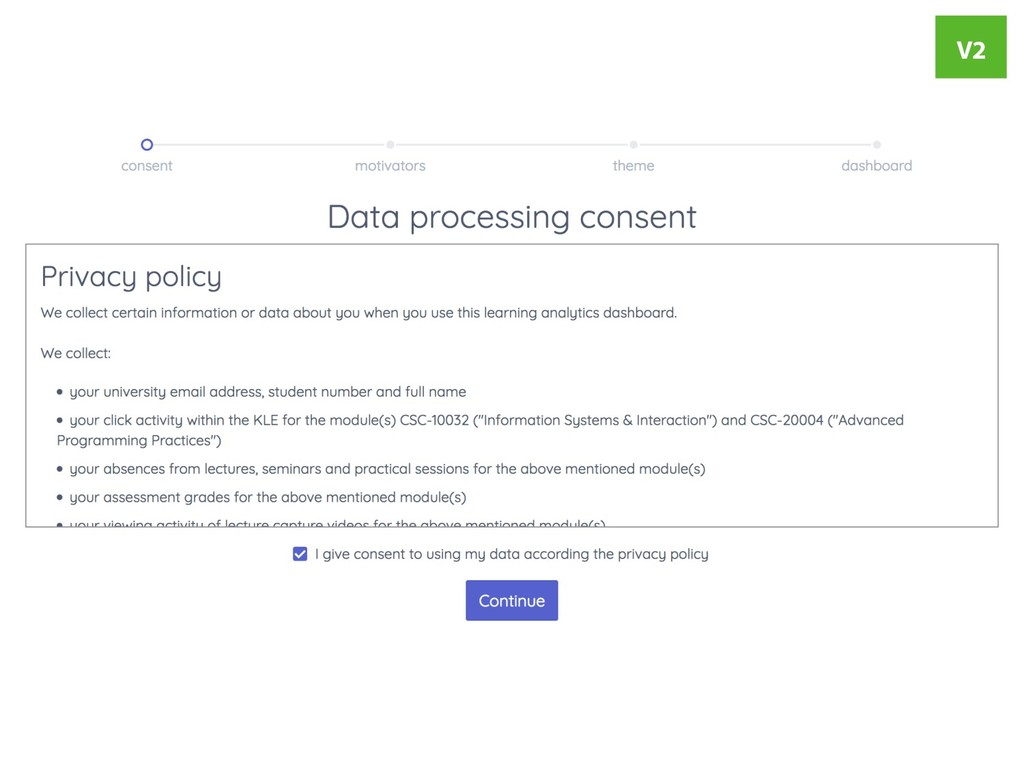
matched funding from Keele) Title: Learner Centred Design for Learning Analytics This project aims to avoid the common problem in Learning Analytics (LA) of the technology and data driving the user experience, and therefore the ability to interpret and use the information. By sharing the data directly with students, using student-centred representations of their learning activity, this project aims to facilitate a common understanding of the learning experience between lecturers and students. Expanding on a successful teaching innovation project at Keele University interface metaphors for LA will be identified that motivate and personalise the learning experience of cohorts with differing levels of technical experience and levels of digital literacy. We will then produce appropriate visualisations of student activity based on the data available at Keele University and incorporate them into the delivery of relevant modules with the key aims of increasing engagement, making the VLE a more active space for learning and teaching and bridging the current gap between physical and digital spaces.
Flickr • Access to personalised notifications and support e.g. highlighting/suggesting resources that have not been viewed. • Increased levels of engagement, in particular VLE usage. • Personalisation of cohort module delivery by the lecturer • Real-time feedback for students enabling them to judge their progress during a module using a different metric than current models of formative and summative feedback. • Direct involvement with the development of tools that support their learning.
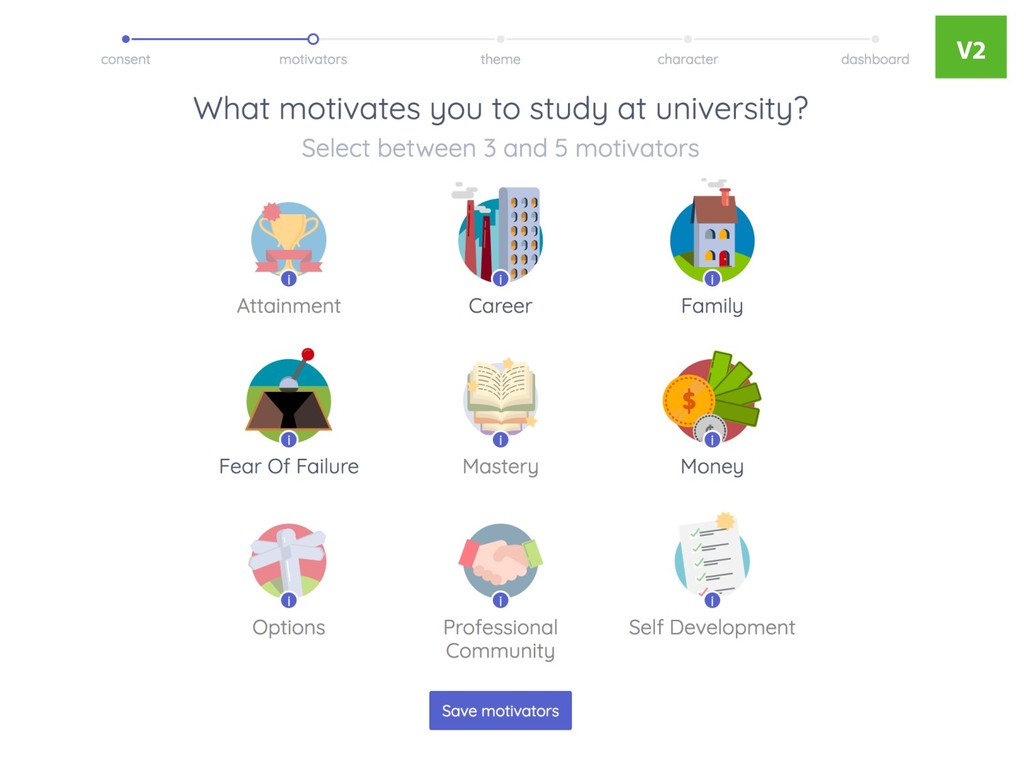
effort) 2 Build self-confidence 3 Career/Vocation/Job prospects 4 Industry 5 Giving yourself options 6 Grades/Marks/Qualifications 7 Mastery of a subject/Interest in Subject/Stretch themselves intellectually 8 Mentoring/Family 9 Money 10 Part of a Professional community 11 Self-efficacy/ Helplessness (this might be the opposite of self-efficacy) 12 Sense of connectedness with others with similar goals/ Success as a group of peers 13 Social Prestige/Recognition Motivators for Studying in HE (Literature) Student Ambassadors
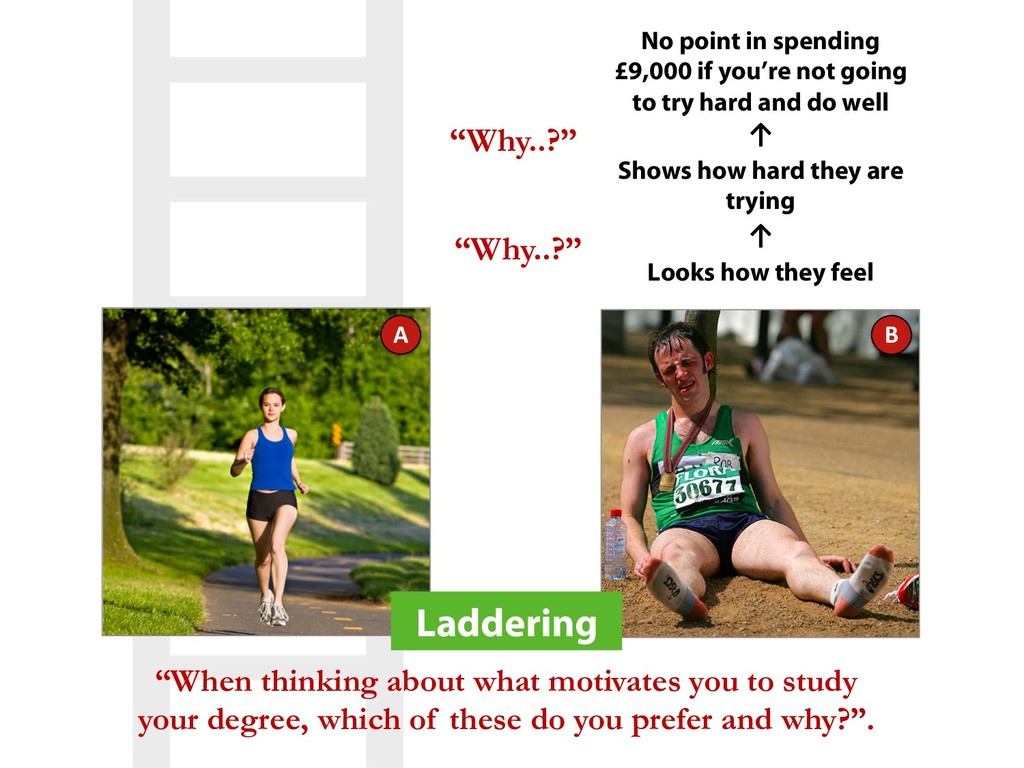
No point in spending £9,000 if you’re not going to try hard and do well ↑ ↑ “When thinking about what motivates you to study your degree, which of these do you prefer and why?”. “Why..?” “Why..?” Laddering A B
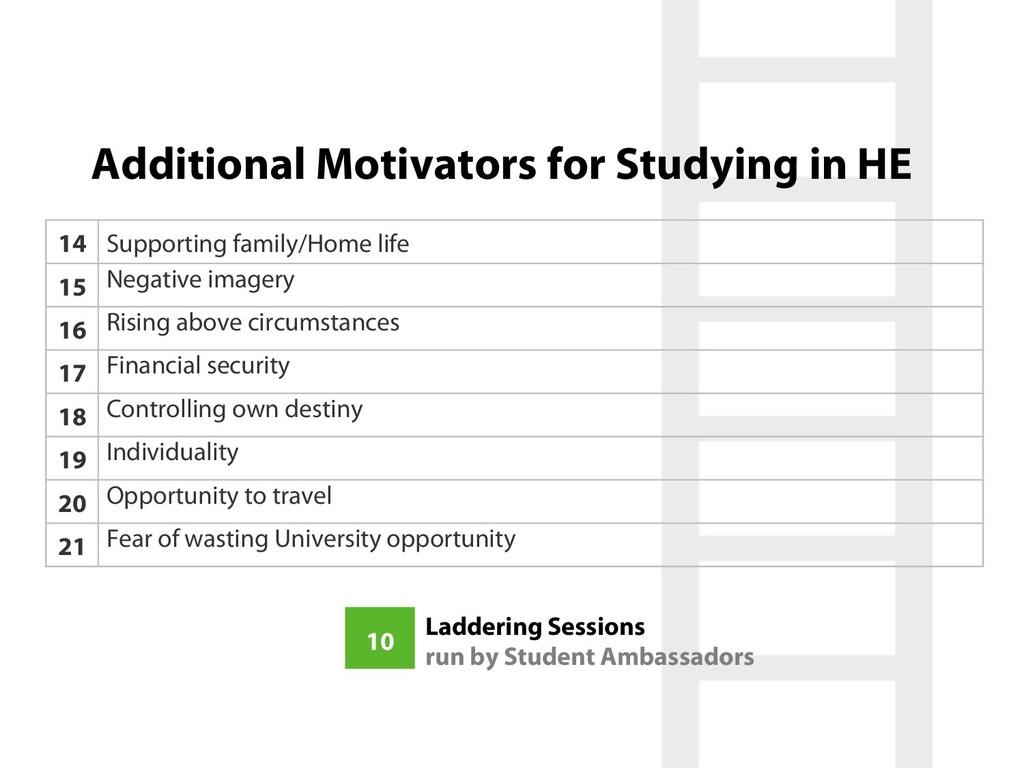
circumstances 17 Financial security 18 Controlling own destiny 19 Individuality 20 Opportunity to travel 21 Fear of wasting University opportunity Additional Motivators for Studying in HE Laddering Sessions run by Student Ambassadors 10
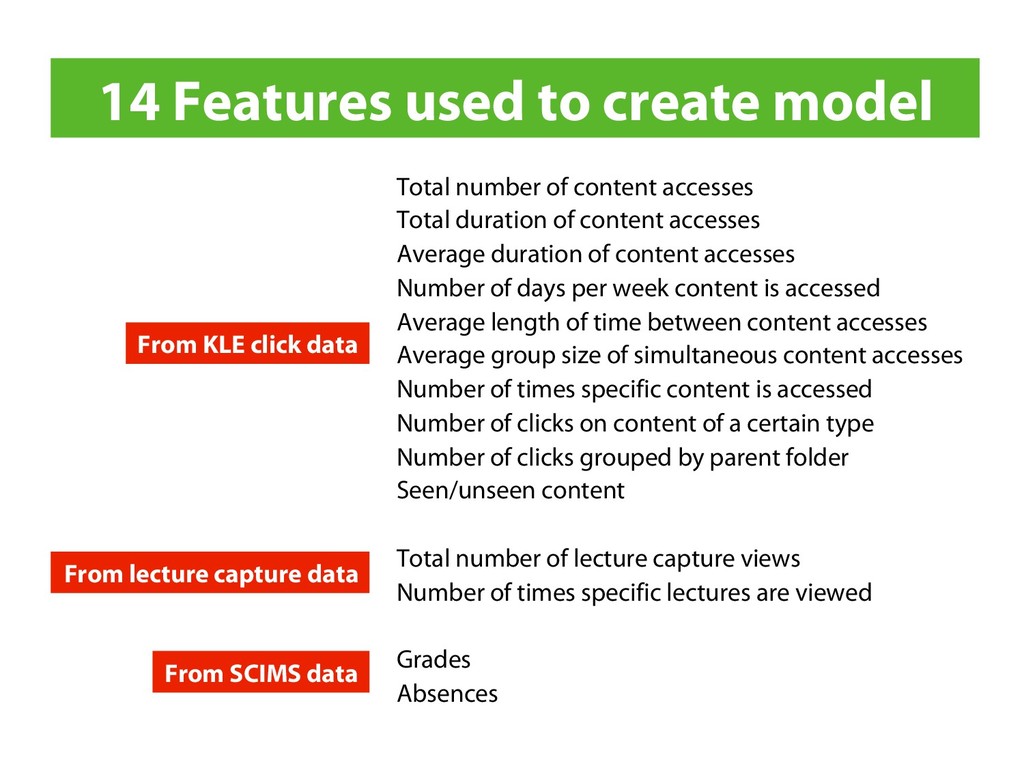
accesses Total duration of content accesses Average duration of content accesses Number of days per week content is accessed Average length of time between content accesses Average group size of simultaneous content accesses Number of times specific content is accessed Number of clicks on content of a certain type Number of clicks grouped by parent folder Seen/unseen content Total number of lecture capture views Number of times specific lectures are viewed Grades Absences From KLE click data From lecture capture data From SCIMS data
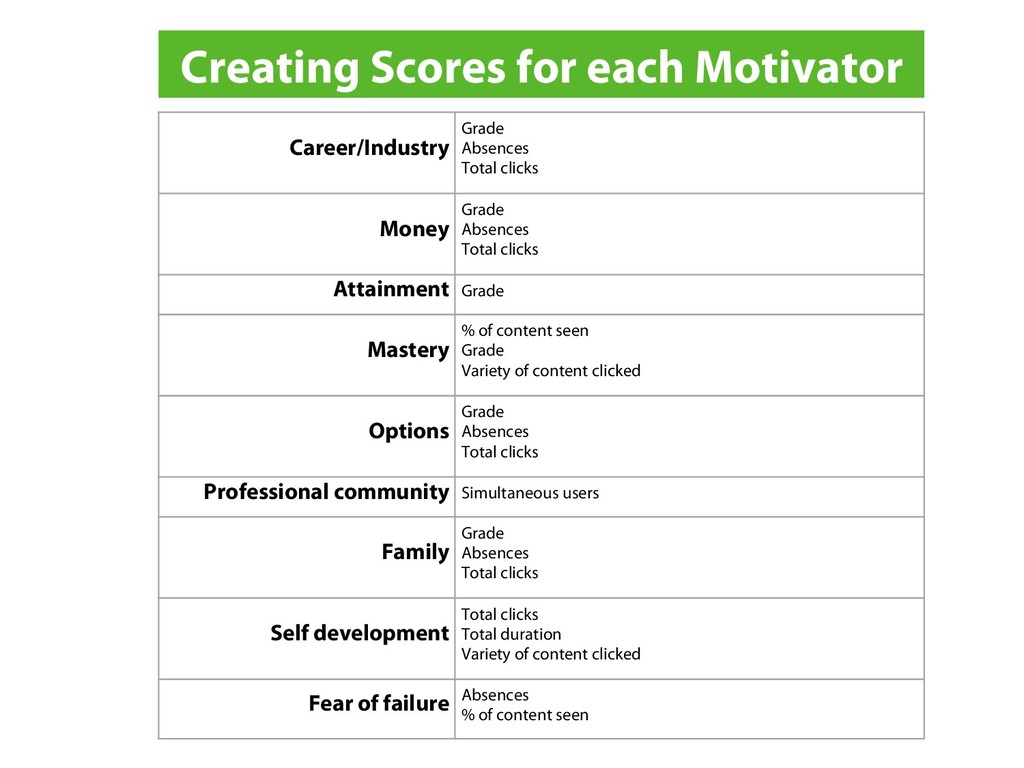
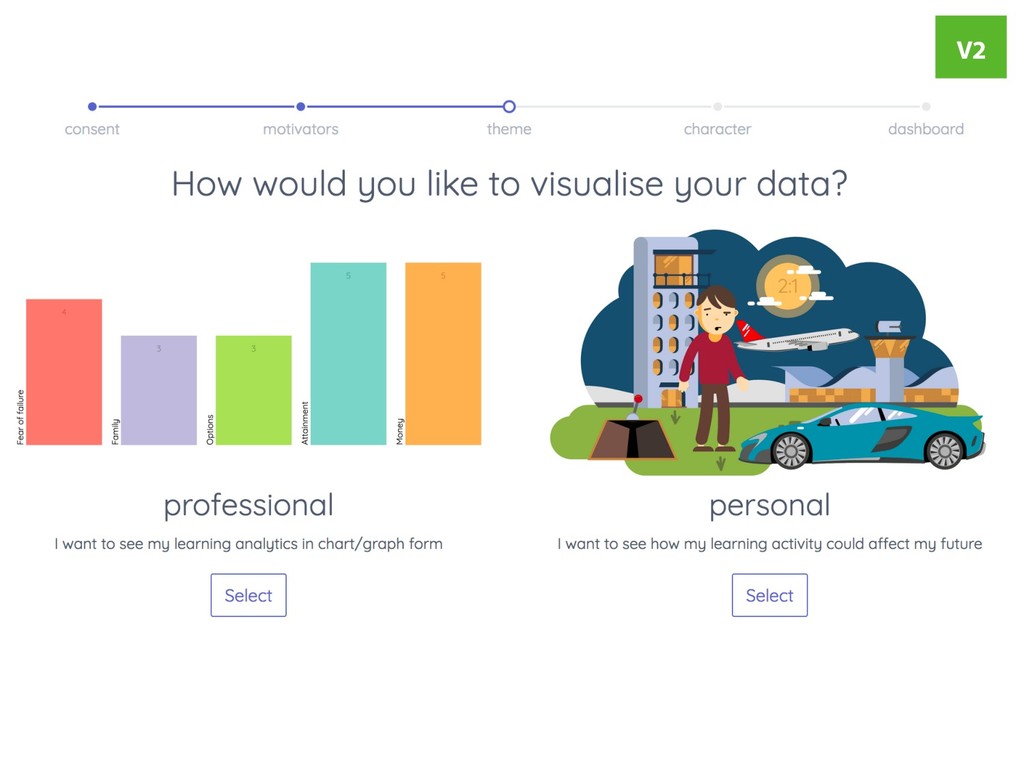
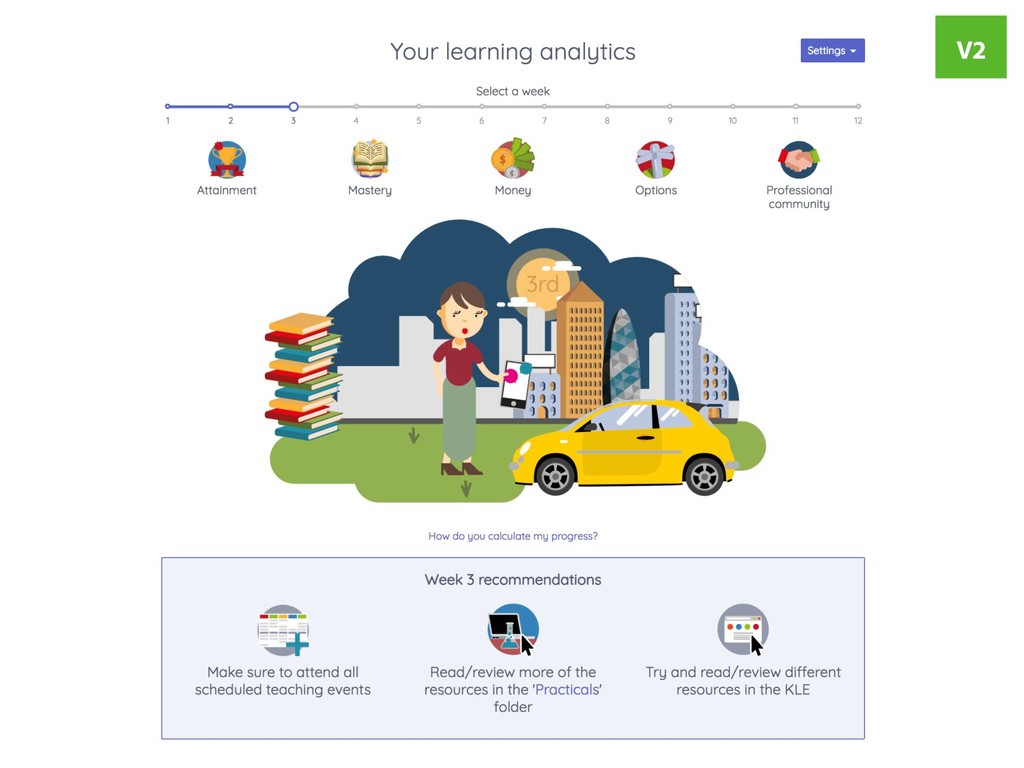
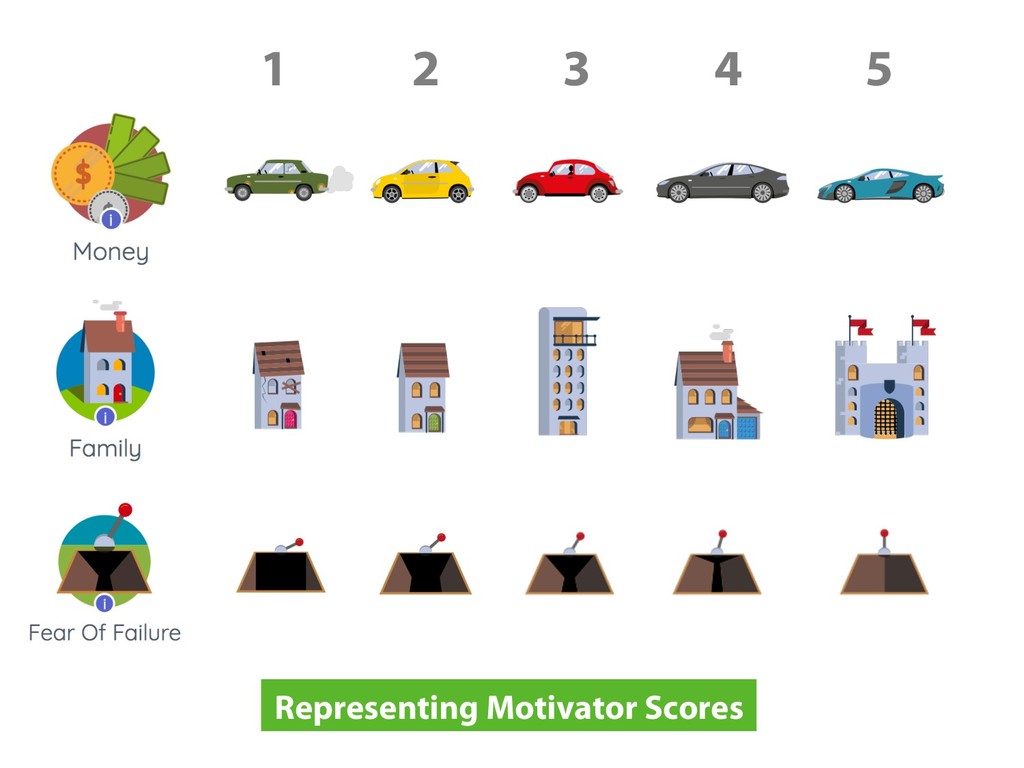
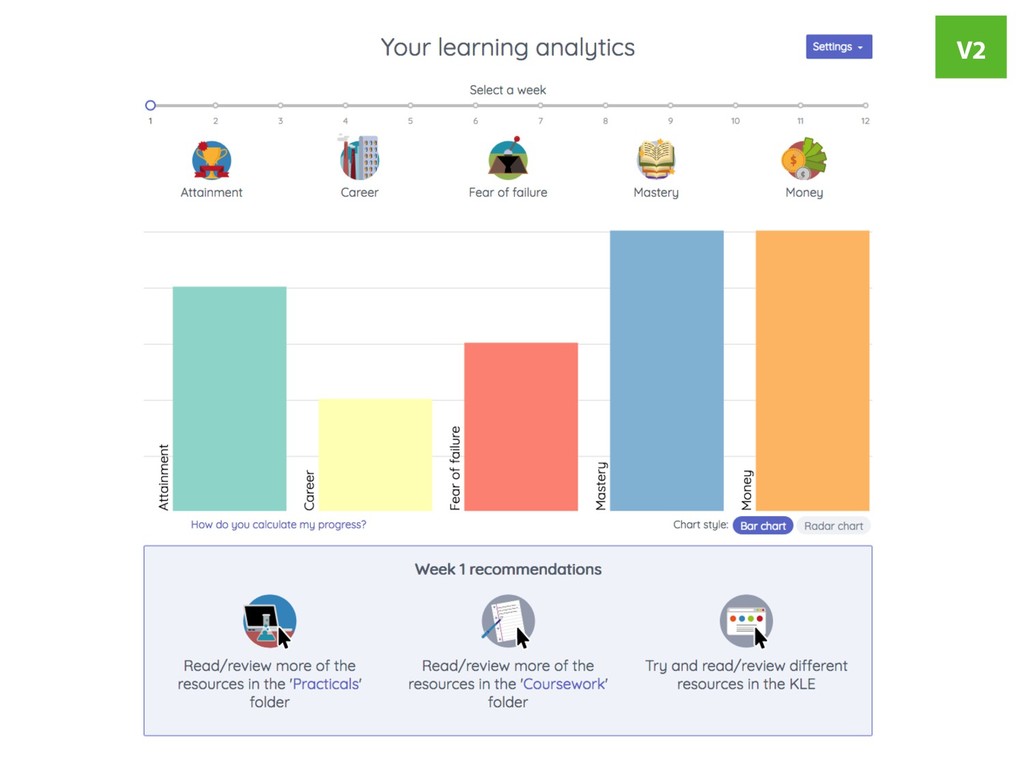
Attainment Grade Mastery % of content seen Grade Variety of content clicked Options Grade Absences Total clicks Professional community Simultaneous users Family Grade Absences Total clicks Self development Total clicks Total duration Variety of content clicked Fear of failure Absences % of content seen Creating Scores for each Motivator
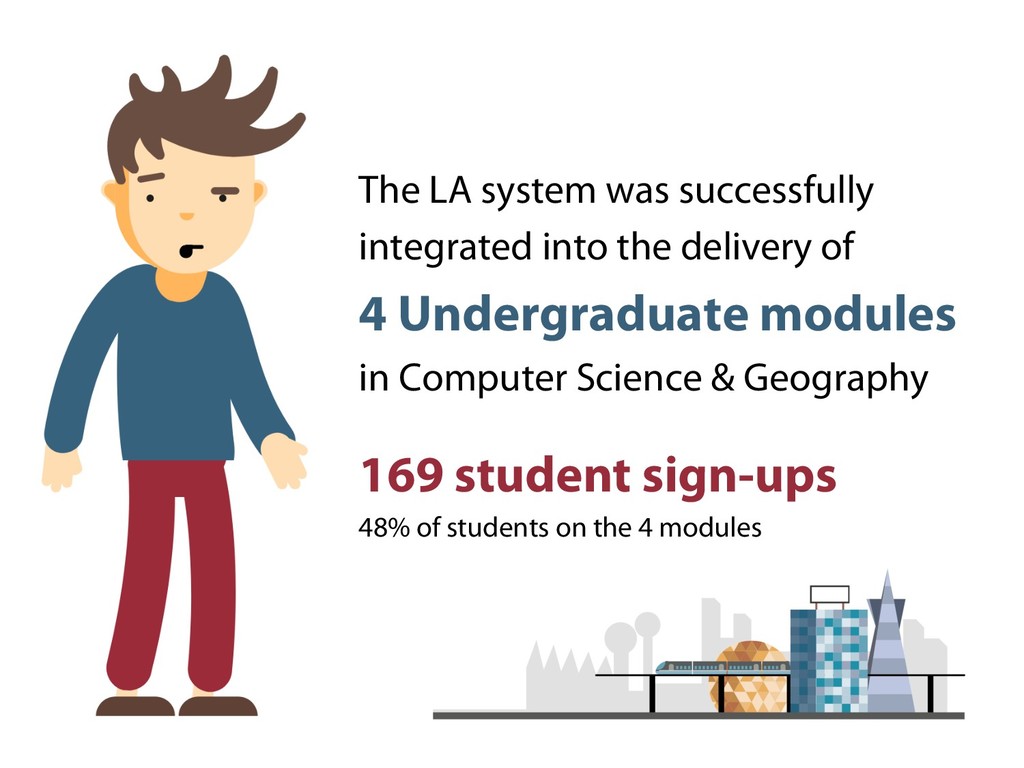
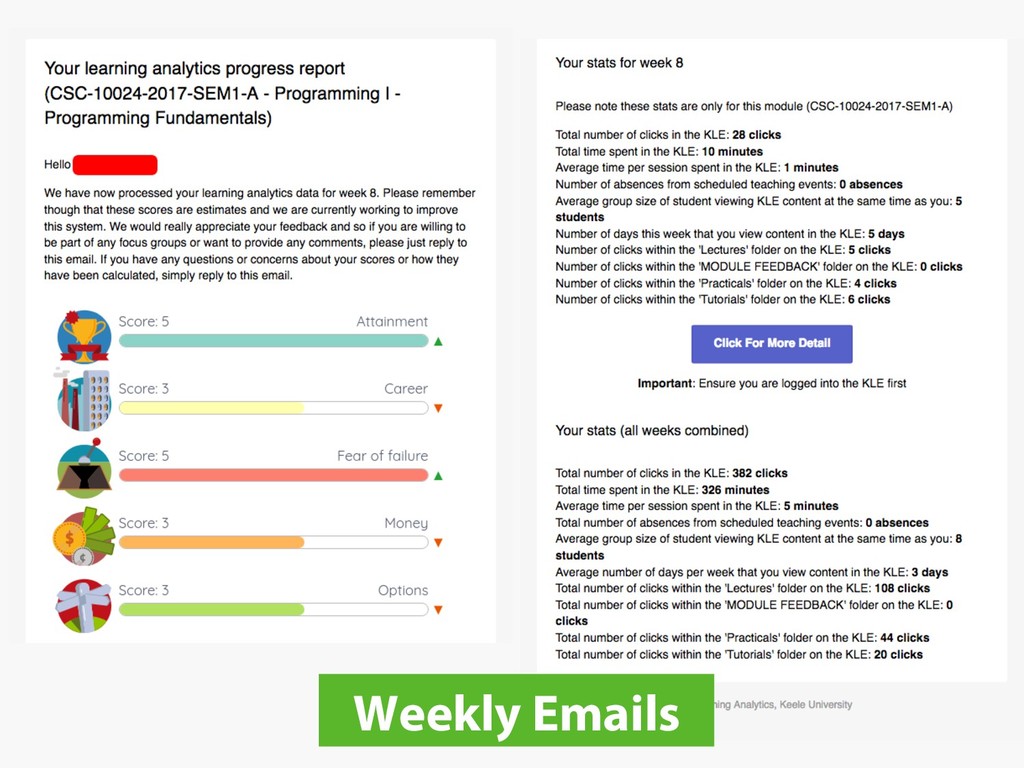
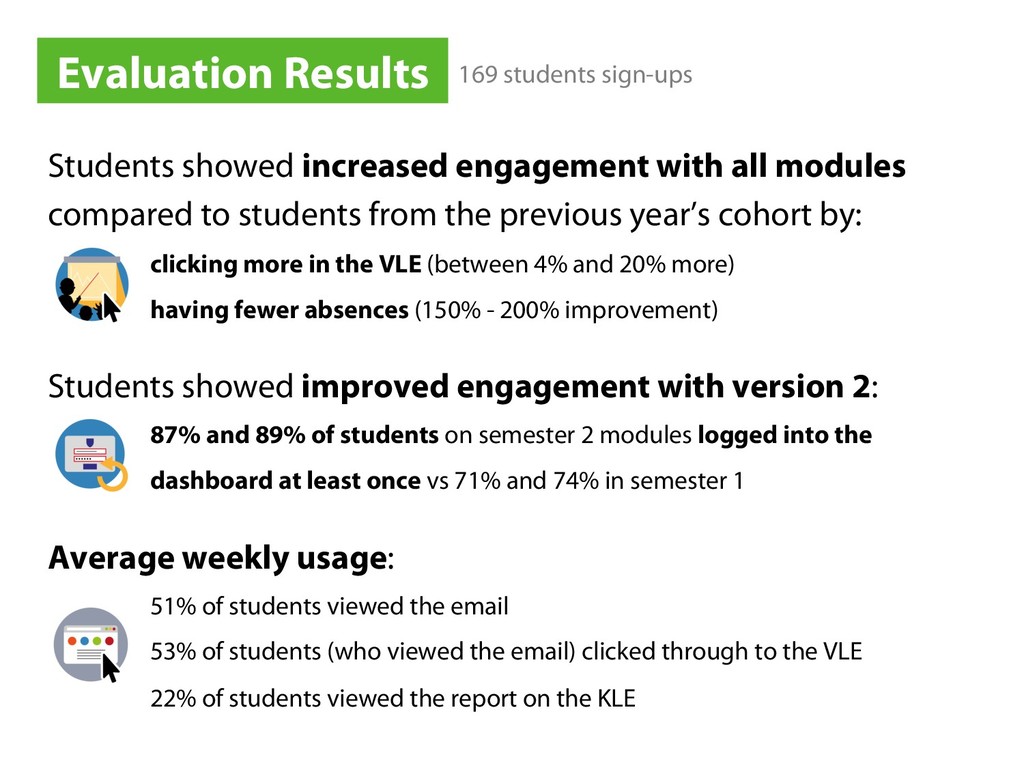
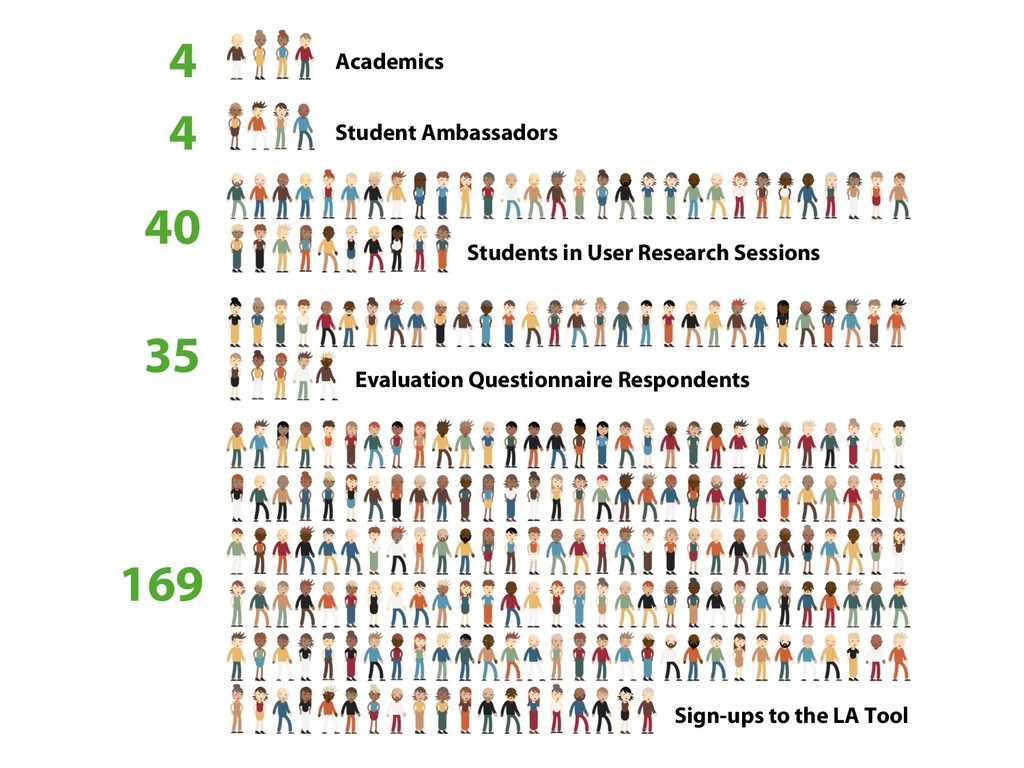
from the previous year’s cohort by: clicking more in the VLE (between 4% and 20% more) having fewer absences (150% - 200% improvement) Students showed improved engagement with version 2: 87% and 89% of students on semester 2 modules logged into the dashboard at least once vs 71% and 74% in semester 1 Evaluation Results 169 students sign-ups Average weekly usage: 51% of students viewed the email 53% of students (who viewed the email) clicked through to the VLE 22% of students viewed the report on the KLE
would influence your behaviour in the following weeks? Evaluation Results Yes - 57% No - 20% Maybe - 23% Questionnaire - 35 students “It did upset me, so I tried harder” “I tend to get lazier as the semester goes on, having a reminder that I am actually doing less work is good.” “Feels like someone is watching how much work I am doing” “I want to feel the satisfaction of a good week” “It helps you realise roughly how much work you are doing” “Don't want to simply be a perfunctory student.” “I didn't see a change in score.” “I think it is discouraging if the analytics indicate a predicted grade of lower than what you expect (and know) you will achieve” “I’m aware of when and why I stop interacting with the VLE, analytics cant understand real world circumstances” “I don’t think measuring performance based on VLE activity alone is a good way to measure it”
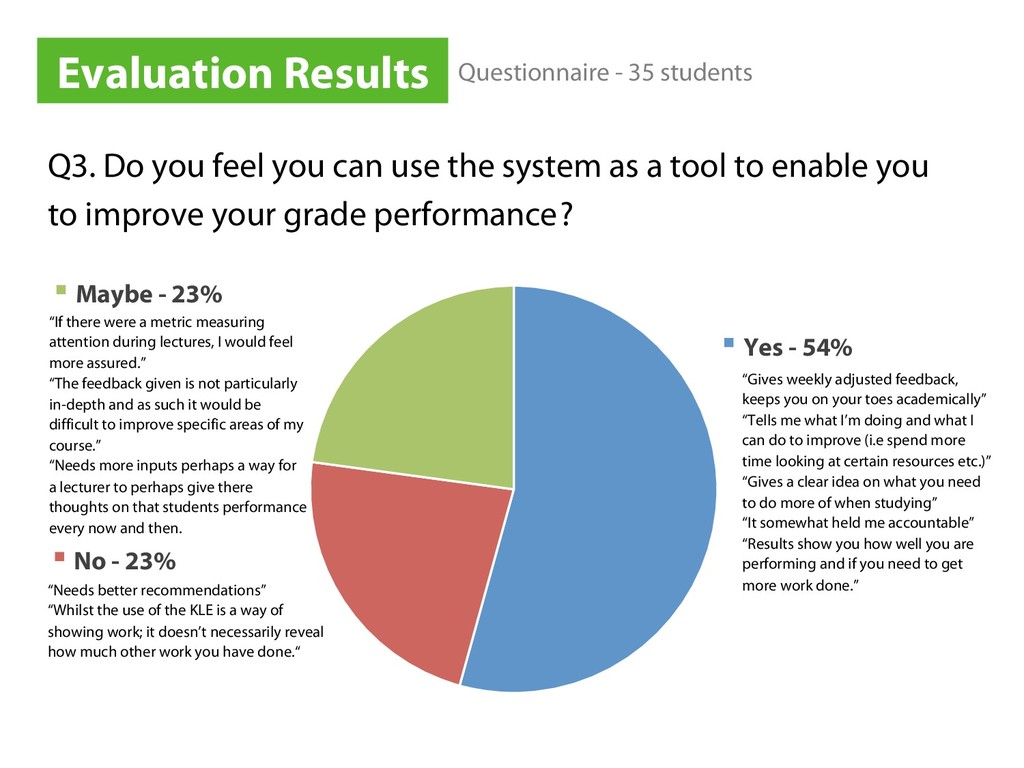
a tool to enable you to improve your grade performance ? Evaluation Results Yes - 54% No - 23% Maybe - 23% Questionnaire - 35 students “Gives weekly adjusted feedback, keeps you on your toes academically” “Tells me what I’m doing and what I can do to improve (i.e spend more time looking at certain resources etc.)” “Gives a clear idea on what you need to do more of when studying” “It somewhat held me accountable” “Results show you how well you are performing and if you need to get more work done.” “If there were a metric measuring attention during lectures, I would feel more assured.” “The feedback given is not particularly in-depth and as such it would be difficult to improve specific areas of my course.” “Needs more inputs perhaps a way for a lecturer to perhaps give there thoughts on that students performance every now and then. “Needs better recommendations” “Whilst the use of the KLE is a way of showing work; it doesn’t necessarily reveal how much other work you have done.“
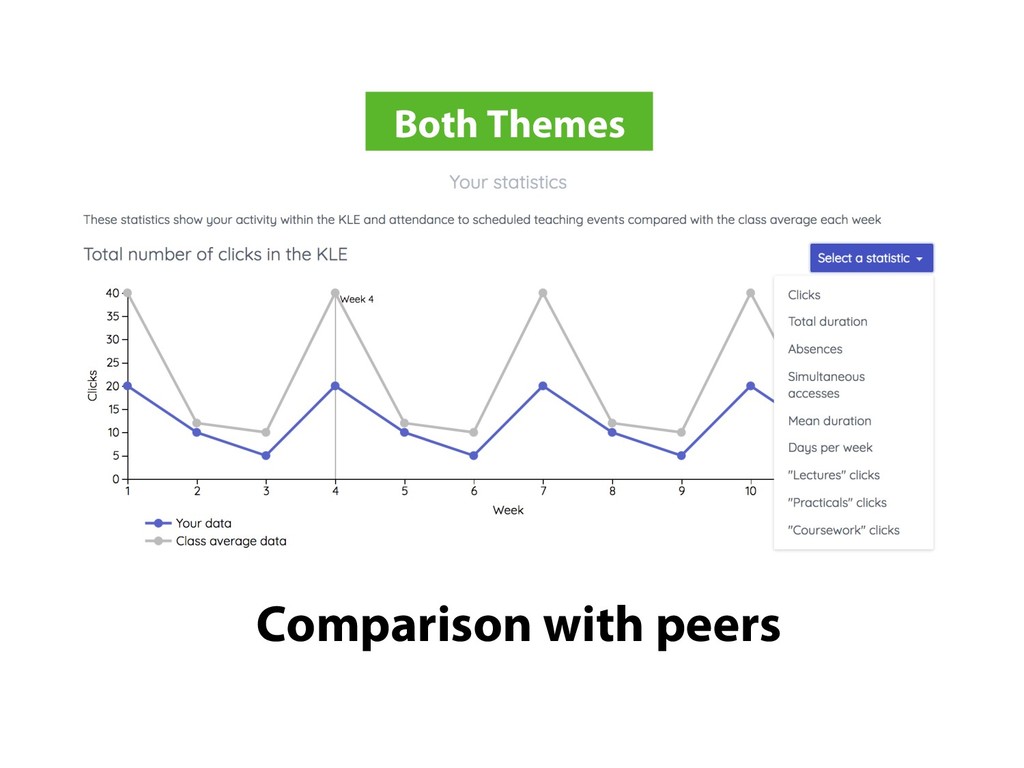
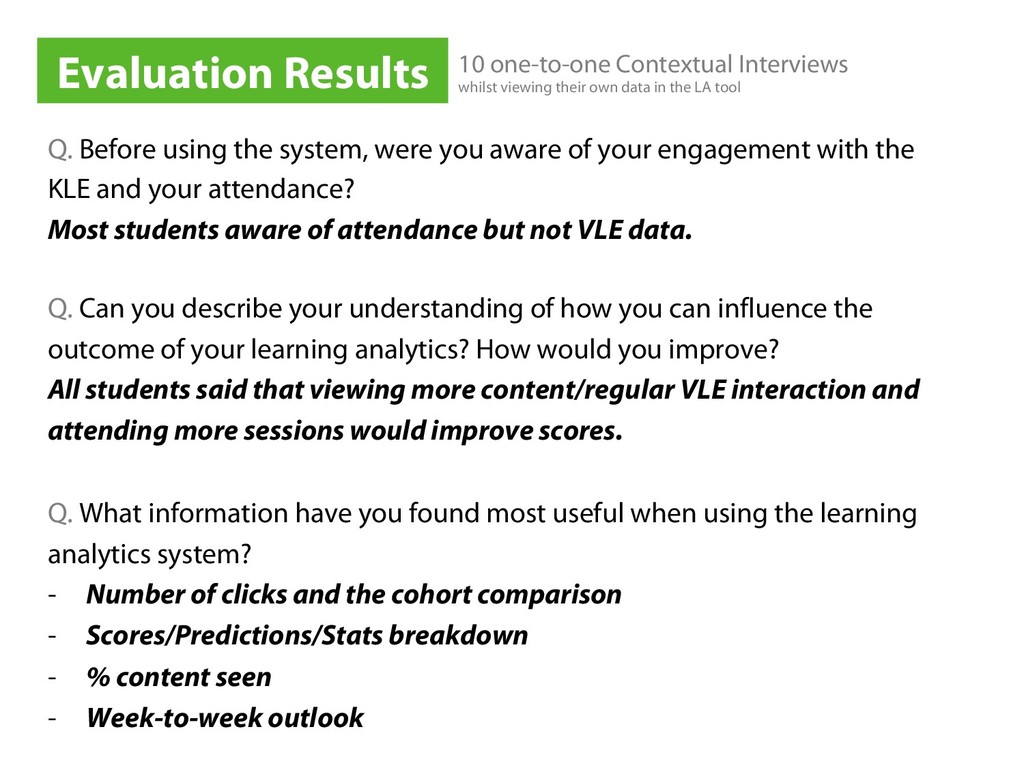
engagement with the KLE and your attendance? Most students aware of attendance but not VLE data. Q. Can you describe your understanding of how you can influence the outcome of your learning analytics? How would you improve? All students said that viewing more content/regular VLE interaction and attending more sessions would improve scores. Q. What information have you found most useful when using the learning analytics system? - Number of clicks and the cohort comparison - Scores/Predictions/Stats breakdown - % content seen - Week-to-week outlook Evaluation Results 10 one-to-one Contextual Interviews whilst viewing their own data in the LA tool
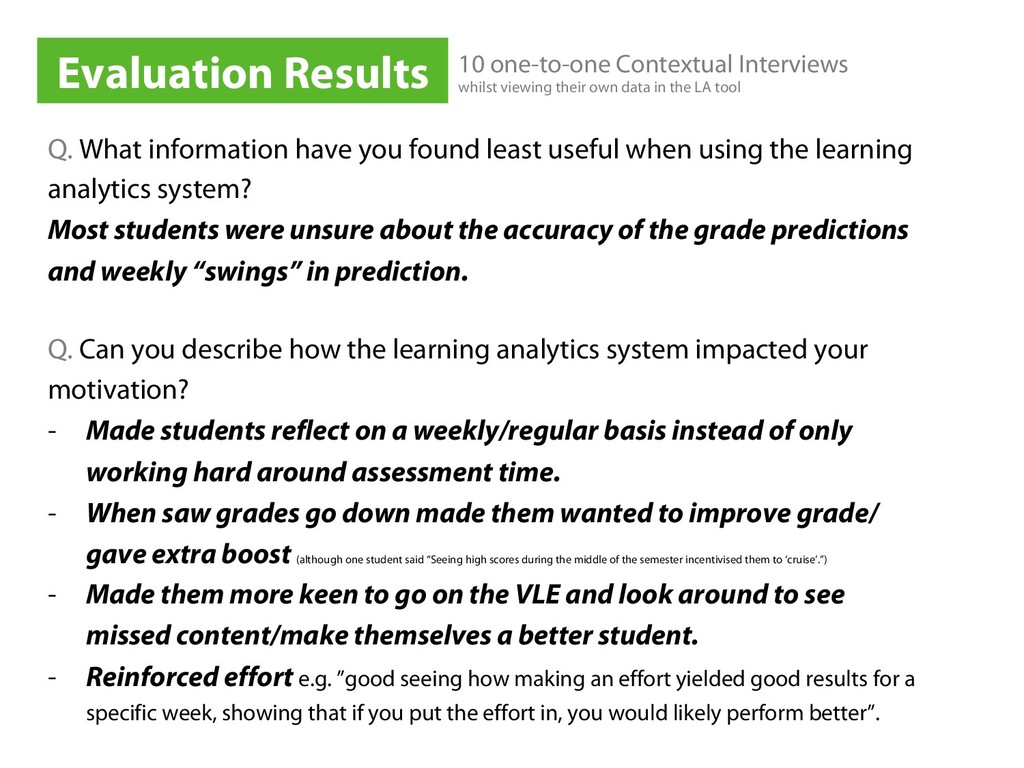
the learning analytics system? Most students were unsure about the accuracy of the grade predictions and weekly “swings” in prediction. Q. Can you describe how the learning analytics system impacted your motivation? - Made students reflect on a weekly/regular basis instead of only working hard around assessment time. - When saw grades go down made them wanted to improve grade/ gave extra boost (although one student said “Seeing high scores during the middle of the semester incentivised them to ‘cruise’.”) - Made them more keen to go on the VLE and look around to see missed content/make themselves a better student. - Reinforced effort e.g. ”good seeing how making an effort yielded good results for a specific week, showing that if you put the effort in, you would likely perform better”. Evaluation Results 10 one-to-one Contextual Interviews whilst viewing their own data in the LA tool
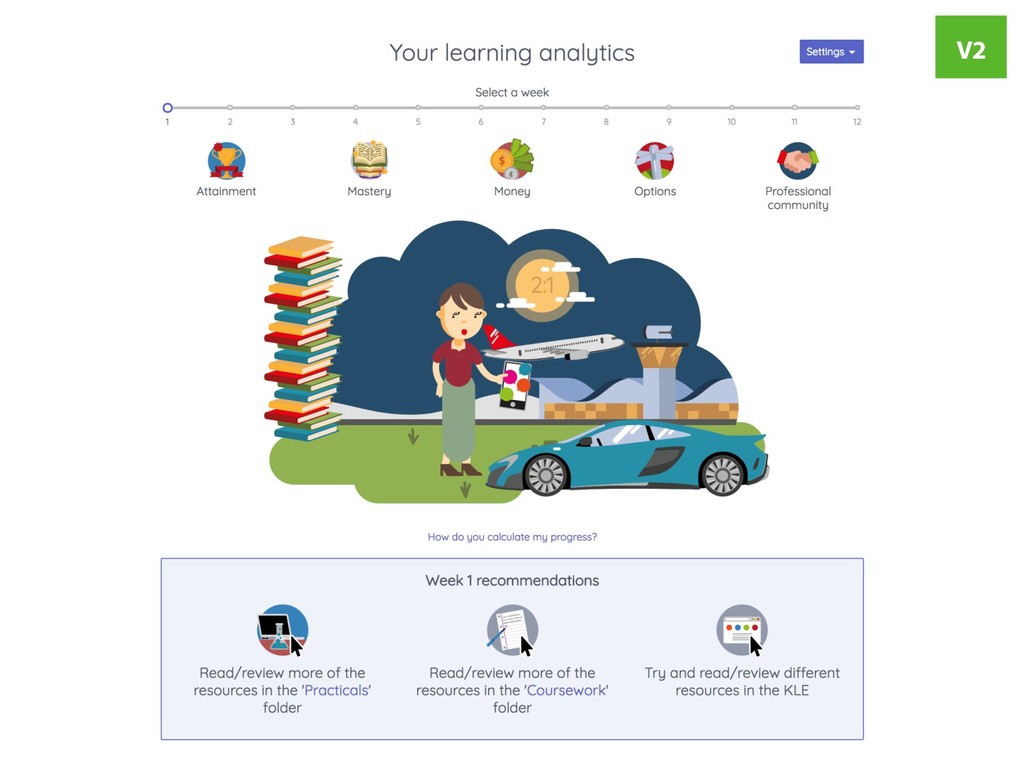
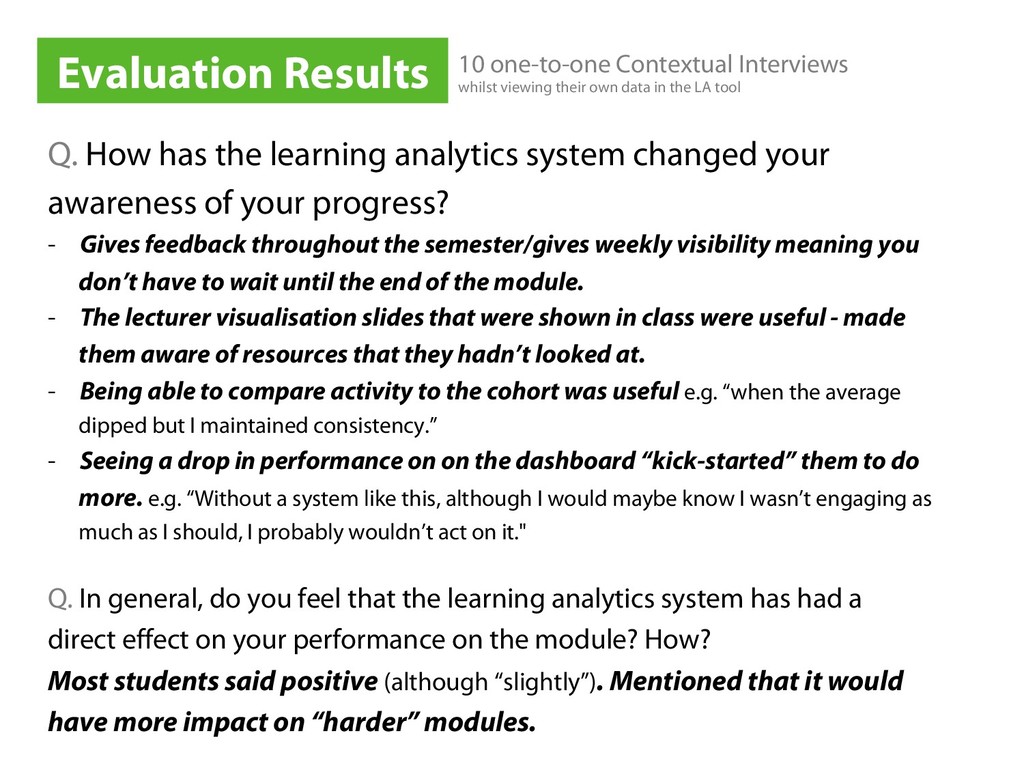
of your progress? - Gives feedback throughout the semester/gives weekly visibility meaning you don’t have to wait until the end of the module. - The lecturer visualisation slides that were shown in class were useful - made them aware of resources that they hadn’t looked at. - Being able to compare activity to the cohort was useful e.g. “when the average dipped but I maintained consistency.” - Seeing a drop in performance on on the dashboard “kick-started” them to do more. e.g. “Without a system like this, although I would maybe know I wasn’t engaging as much as I should, I probably wouldn’t act on it." Q. In general, do you feel that the learning analytics system has had a direct effect on your performance on the module? How? Most students said positive (although “slightly”). Mentioned that it would have more impact on “harder” modules. Evaluation Results 10 one-to-one Contextual Interviews whilst viewing their own data in the LA tool
![Dr Ed de Quincey e.de [email protected] Chris Briggs [email protected] KEELE](https://files.speakerdeck.com/presentations/b7d87d9f69614cffa0a4a7b6cc5398e7/slide_54.jpg)