Upgrade to Pro — share decks privately, control downloads, hide ads and more …

#hayfever; A longitudinal study into hay fever related tweets in the UK

#hayfever; A longitudinal study into hay fever related tweets in the UK

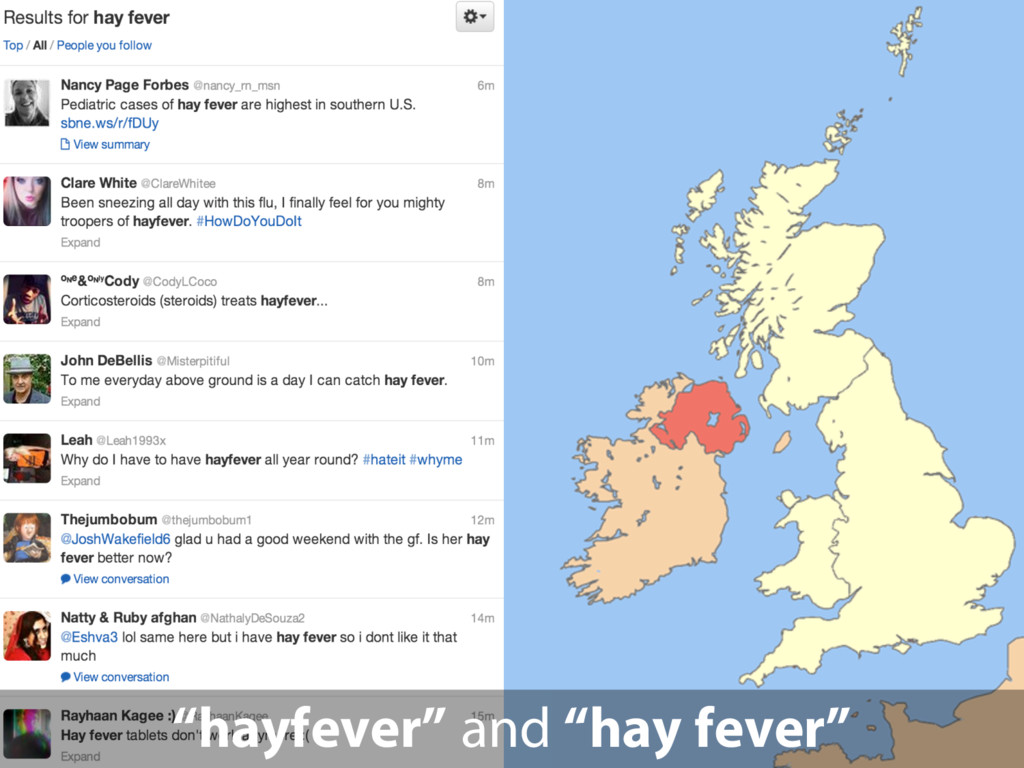
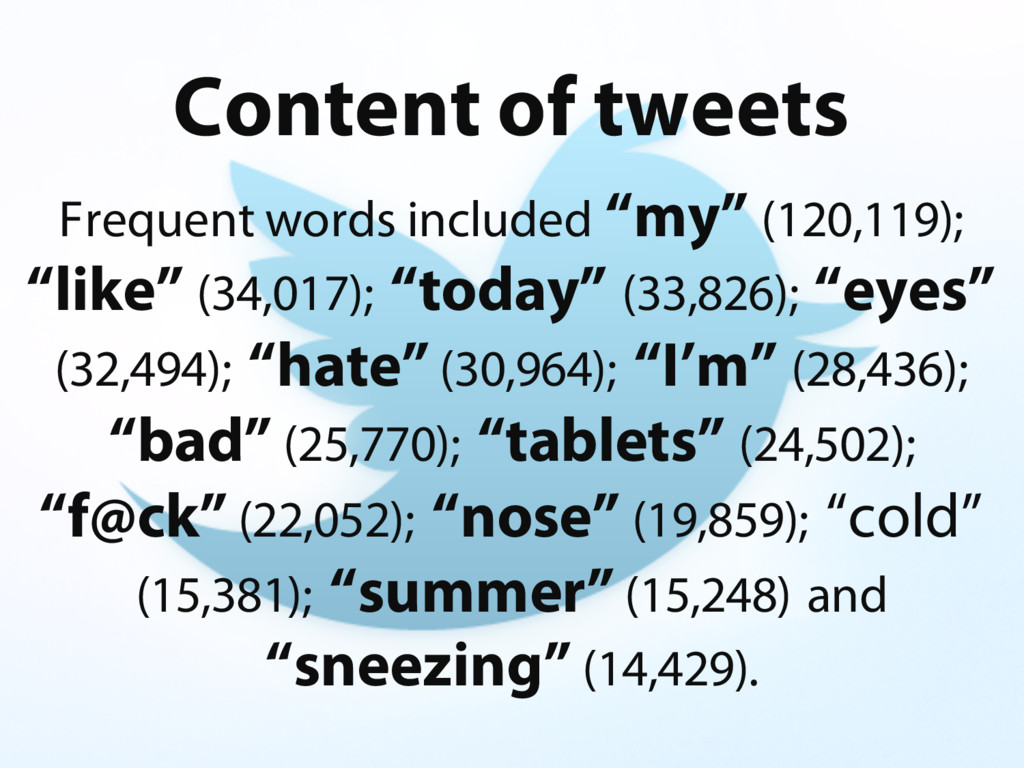
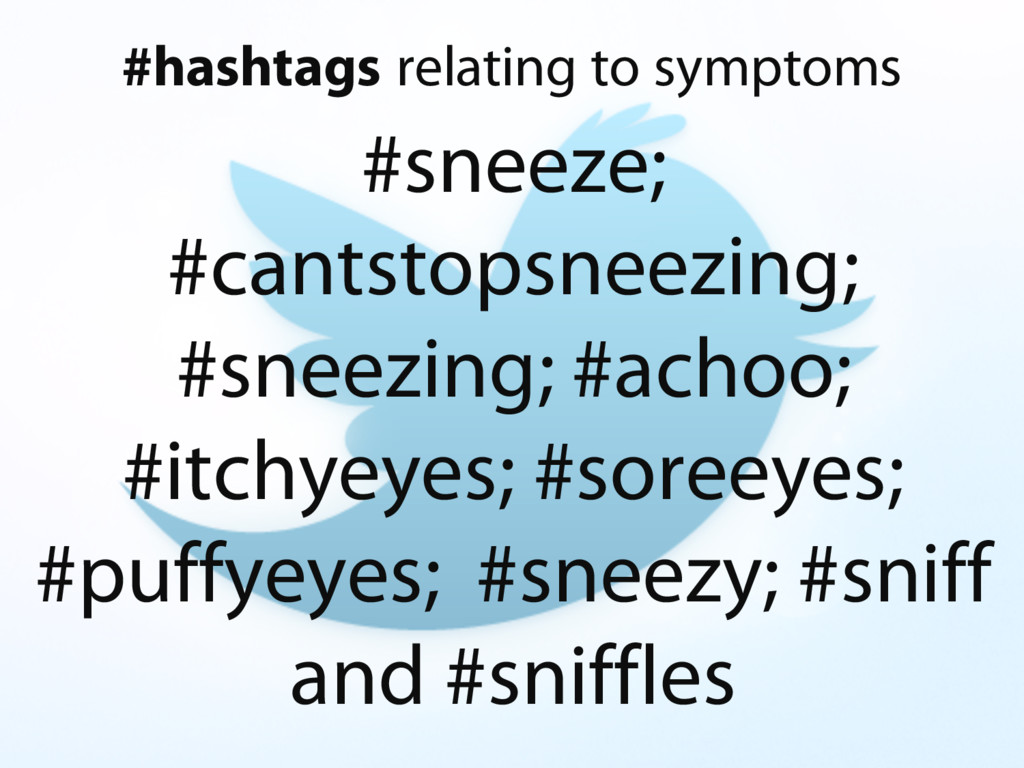
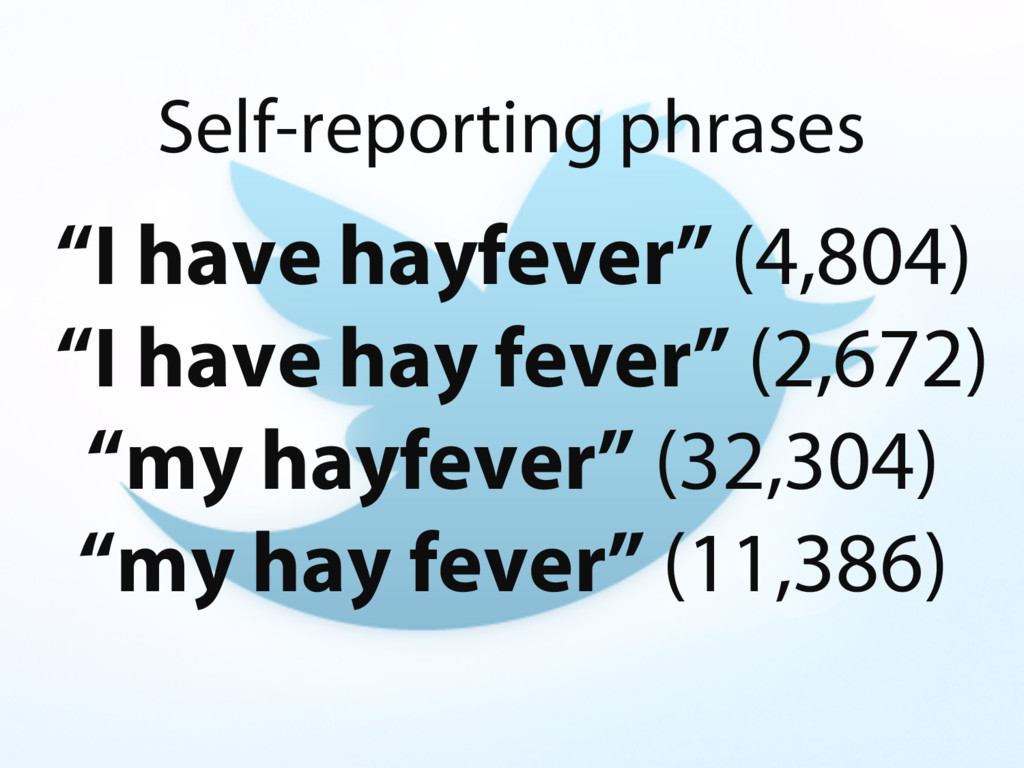
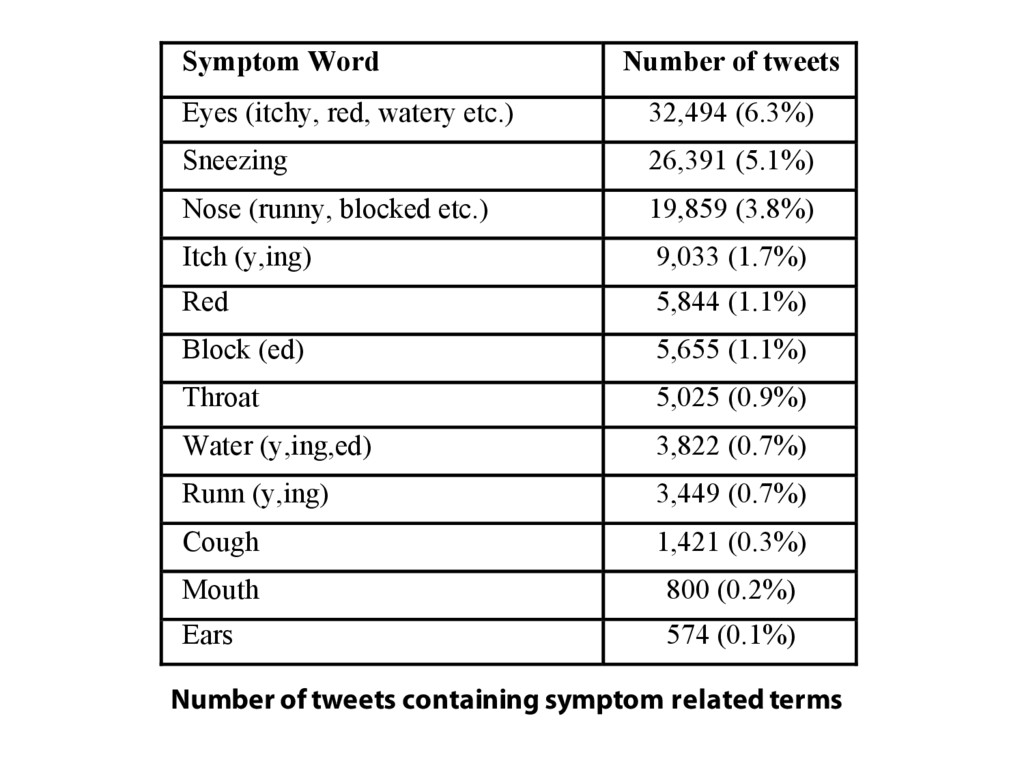
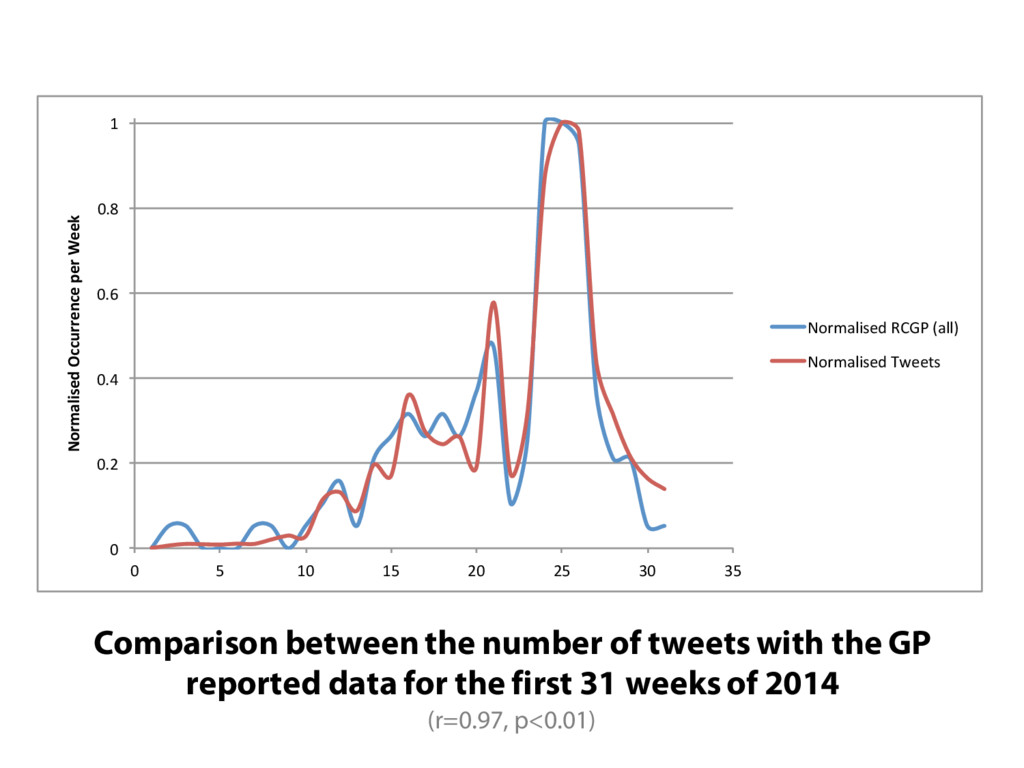
This paper describes a longitudinal study that has collected and analysed over 512,000 UK geolocated tweets over 2 years from June 2012 that contained instances of the words “hayfever” and “hay fever”. The results indicate that the temporal distribution of the tweets collected in 2014 correlates strongly (r=0.97, p<0.01) with incidents of hay fever reported by the Royal College of General Practitioners (RCGP) in the same year. An analysis of the content of the tweets indicates that users are self-reporting common, often severe symptoms as well as the uses of medication. We conclude that hay fever related tweets provide a real-time, free and easily accessible source of data at a finer level of granularity than currently available data sets. The implications for researchers, health professionals and sufferers are also discussed.

Ed de Quincey

April 13, 2016
Tweet

More Decks by Ed de Quincey

Other Decks in Research

Transcript

  1. #hayfever; A
    longitudinal study
    into hay fever related
    tweets in the UK
    Dr Ed de Quincey, Keele University
    Dr Theo Kyriacou, Keele University
    Dr Thomas Pantin, Macclesfield Hospital
    Photo by Maja Dumat

    View Slide

  2. Dr Ed de Quincey @eddequincey
    Postgraduate Course Director, Lecturer in Computer Science
    School of Computing and Mathematics, KeeleUniversity
    Lead of the Software Engineering Research Cluster
    instagram.com/eddequincey

    View Slide

  3. The current UK hay
    fever prevalence is
    between 20-25%
    of the
    population,
    projected to rise to
    39% by 2030
    (Emberlin, 2010).
    Photo from “Hayfever hotspots: As pollen counts rise, our
    unique British map tells you where to avoid”
    http://www.dailymail.co.uk/health/article-1015294/Hayfever-hotspots-As-
    pollen-counts-rise-unique-British-map-reveals-avoid.html

    View Slide

  4. Surges in incidence of hay fever (allergic
    rhinitis) in spring and summer are
    commonly known as the hay fever
    season, with the main pollens in the
    UK being birch pollen, March to
    mid May, and grass pollen, late
    May to August (Emberlin, 2010).

    View Slide

  5. The Meteorological
    Office (Met Office)
    provide weekly pollen
    forecasts and the
    Royal College of
    General
    Practitioners (RCGP)
    produce weekly
    service reports.
    http://www.metoffice.gov.uk/public/weather/forecast/

    View Slide

  6. Photo by “A Guy Taking Pictures”
    For researchers and sufferers of hay fever,
    there is currently no method for identifying
    real-time, geolocated hay fever incidence.

    View Slide

  7. A promising approach in the related field
    of Epidemiological Intelligence to detect
    seasonal illnesses is the use of Social Media
    (de Quincey & Kostkova, 2010). By collecting
    incidences of users self reporting illnesses
    on twitter, it has been shown that
    outbreaks can be predicted 1-2 weeks
    before RCGP data indicates (Szomszor et al, 2012).

    View Slide

  8. View Slide

  9. “1486 following, 283 followers and 134
    updates and 36 direct messages to
    hayfever sufferers on Twitter”
    http://www.figarodigital.co.uk/case-study/Kleenex.aspx

    View Slide

  10. BENADRYL® Social Pollen Count

    View Slide

  11. 2nd GRF One Health Summit 2013
    http://www.socialslurp.co.uk/benadryl-pollen-hotspot-goes-tits-up/

    View Slide

  12. “hayfever” and “hay fever”

    View Slide

  13. 512,198 tweets
    294,010 people
    Since 20th June 2012 and 31st July 2014
    69.4% “Hayfever”
    30.6% “Hay fever”

    View Slide

  14. View Slide

  15. Distribution similar to Pollen Calendars produced by the National Pollen
    and Aerobiology Research Unit, with peaks in June/July, reductions
    through August/September, no pollen from October to January and
    then a rise in March

    View Slide

  16. The highest number of tweets posted was 5,826 on the 26th of June
    2012. 52% (3,002) of these were retweets of a tweet from a user,
    @carolineflack1, who currently has 1.7 million followers. A related
    phenomenon was seen when a tweet by @GemmaAnneStyles, who
    currently has 3.16 million followers, was retweeted 1,353 times.
    Photo by “Pop Sugar”
    “The Harry Styles Effect”

    View Slide

  17. Frequent words included “my” (120,119);
    “like” (34,017); “today” (33,826); “eyes”
    (32,494); “hate” (30,964); “I’m” (28,436);
    “bad” (25,770); “tablets” (24,502);
    [email protected]” (22,052); “nose” (19,859); “cold”
    (15,381); “summer” (15,248) and
    “sneezing” (14,429).
    Content of tweets

    View Slide

  18. #sneeze;
    #cantstopsneezing;
    #sneezing; #achoo;
    #itchyeyes; #soreeyes;
    #puffyeyes; #sneezy; #sniff
    and #sniffles
    #hashtags relating to symptoms

    View Slide

  19. “I have hayfever” (4,804)
    “I have hay fever” (2,672)
    “my hayfever” (32,304)
    “my hay fever” (11,386)
    Self-reporting phrases

    View Slide

  20. Symptom Word Number of tweets
    Eyes (itchy, red, watery etc.) 32,494 (6.3%)
    Sneezing 26,391 (5.1%)
    Nose (runny, blocked etc.) 19,859 (3.8%)
    Itch (y,ing) 9,033 (1.7%)
    Red 5,844 (1.1%)
    Block (ed) 5,655 (1.1%)
    Throat 5,025 (0.9%)
    Water (y,ing,ed) 3,822 (0.7%)
    Runn (y,ing) 3,449 (0.7%)
    Cough 1,421 (0.3%)
    Mouth 800 (0.2%)
    Ears 574 (0.1%)
    Number of tweets containing symptom related terms

    View Slide

  21. Photo by e-Magine Art
    27,553 tweets related to
    medication were found
    (containing terms such as “medicine”; “tablets”;
    “meds”; “medication”; “pill’; “spray” and “drugs”).
    670 tweets related to
    drug efficacy
    (“tablets don’t work” and “the pills don’t work”)

    View Slide

  22. Utilising a profanity
    dictionary, the number of
    tweets containing
    expletives was found to be
    around 11% (55,515).
    “Hayfever is totally kicking my **** today. The *******.”

    View Slide

  23. Top 5 locations for number of tweets
    Location No of tweets No of tweets/Population
    London 86,460 1.03%
    Manchester 21,489 4.18%
    Birmingham 10,458 0.96%
    Liverpool 10,206 2.17%
    Bristol 8,244 1.88%

    View Slide

  24. Map Source Professor Jean Emberlin, PollenUK

    View Slide

  25. “Thank you for sight of your map. It matches what I would
    expect to see, broadly fewer instances of pollen being
    registered in Scotland, more in the south and southeast of
    England.” - Dr Peter Burt, Biometeorologist

    View Slide

  26. 0"
    0.2"
    0.4"
    0.6"
    0.8"
    1"
    0" 5" 10" 15" 20" 25" 30" 35"
    Normalised+Occurrence+per+Week+
    Normalised"RCGP"(all)"
    Normalised"Tweets"
    Comparison between the number of tweets with the GP
    reported data for the first 31 weeks of 2014
    (r=0.97, p<0.01)

    View Slide

  27. Daily peaks of hay fever incidence
    can be identified as they happen in
    specific places in the UK.

    View Slide

  28. No content filtering needed (?)

    View Slide

  29. For comparison the
    Met Office
    offered to provide
    Daily stats from
    March 2011 up until
    May 2013 for 18
    UK locations at a
    cost of £12,100 +
    Vat

    View Slide