(Recorded at https://youtu.be/sR3jxSXY7A4)
The question that most people ask after spinning up their first Kubernetes cluster is "how do I do monitoring and logging".
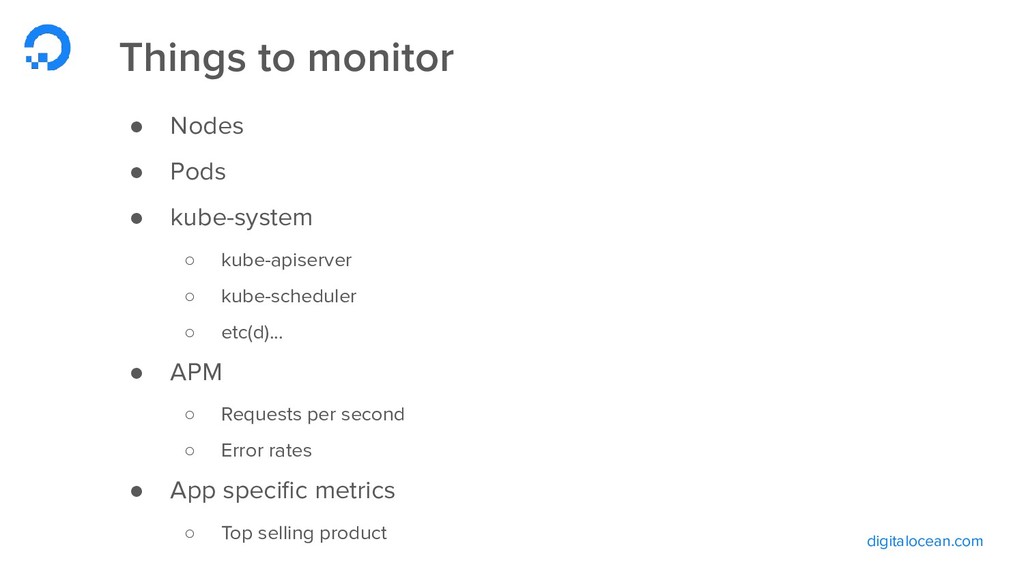
In this session we'll utilize open source tools like Prometheus, Helm, Grafana, and Loki to quickly go from being in the dark to having full visibility into the happenings of our clusters and workloads. We'll deploy an entire monitoring and logging stack to a fresh cluster live and discuss the pros and cons of such tools.
You'll leave this session with a playbook on how to bootstrap your cluster observability and some gotchas and lesson's learned from our monitoring of large workloads at DigitalOcean.