Upgrade to Pro — share decks privately, control downloads, hide ads and more …

And the beats go on! Geneva JUG

And the beats go on! Geneva JUG

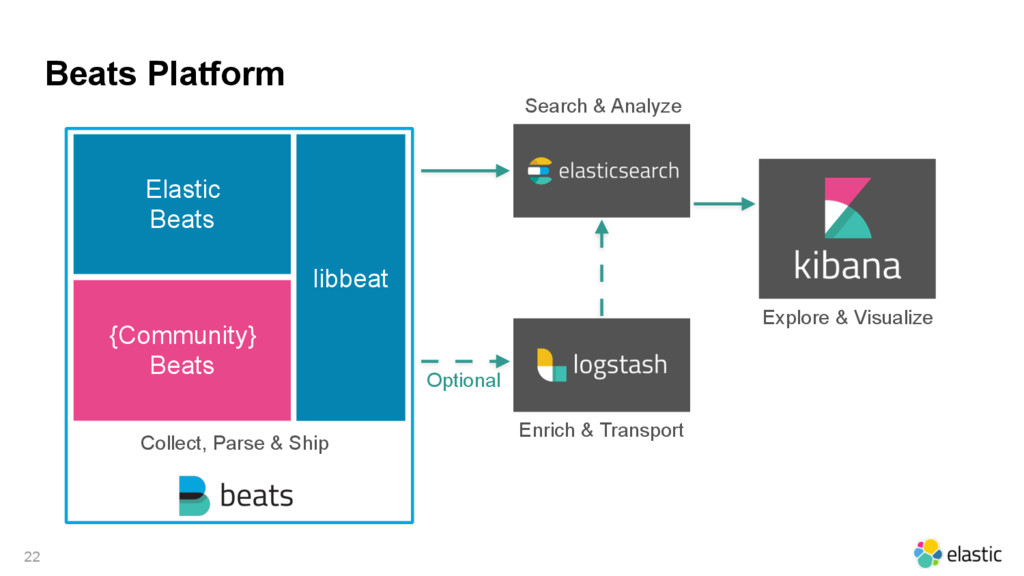
Venez découvrir les nouveaux Data Shippers pour Elasticsearch:
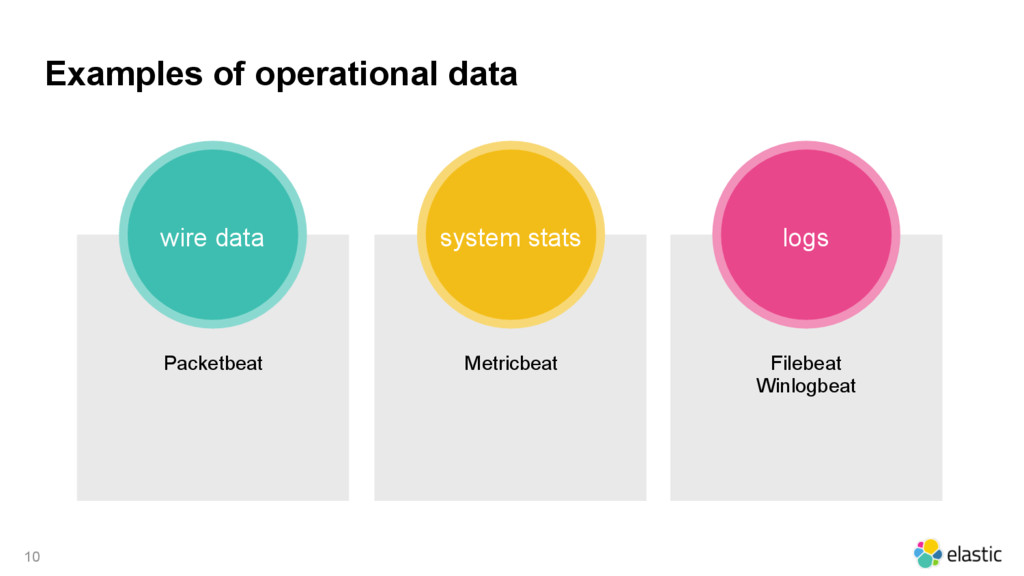
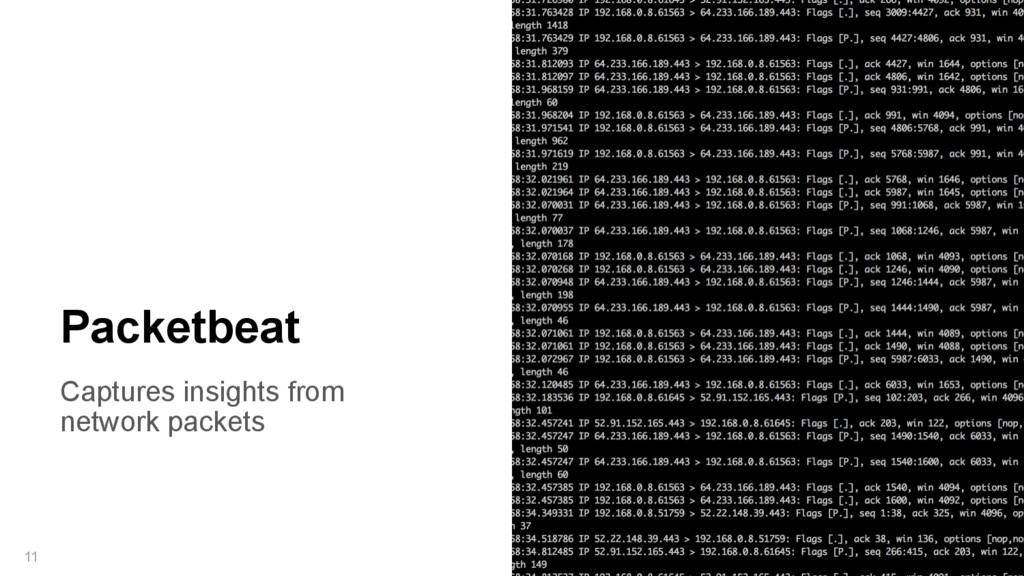
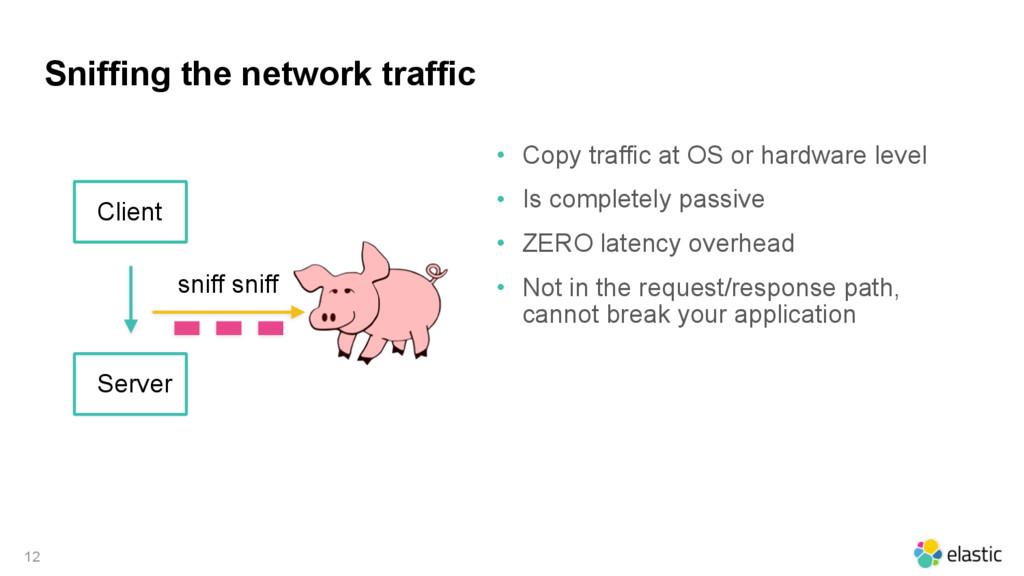
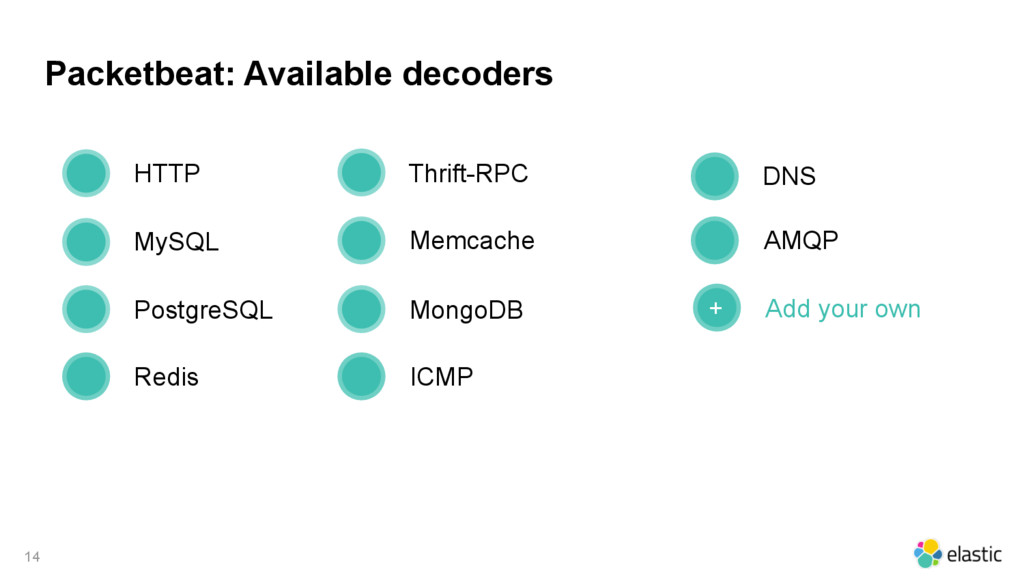
Packetbeat : décortiquez les protocoles réseau
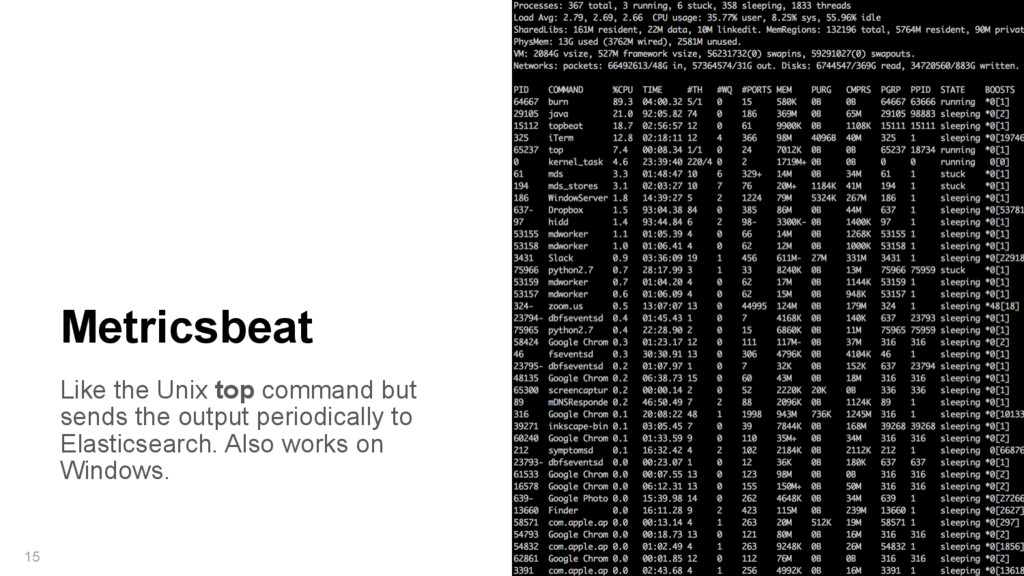
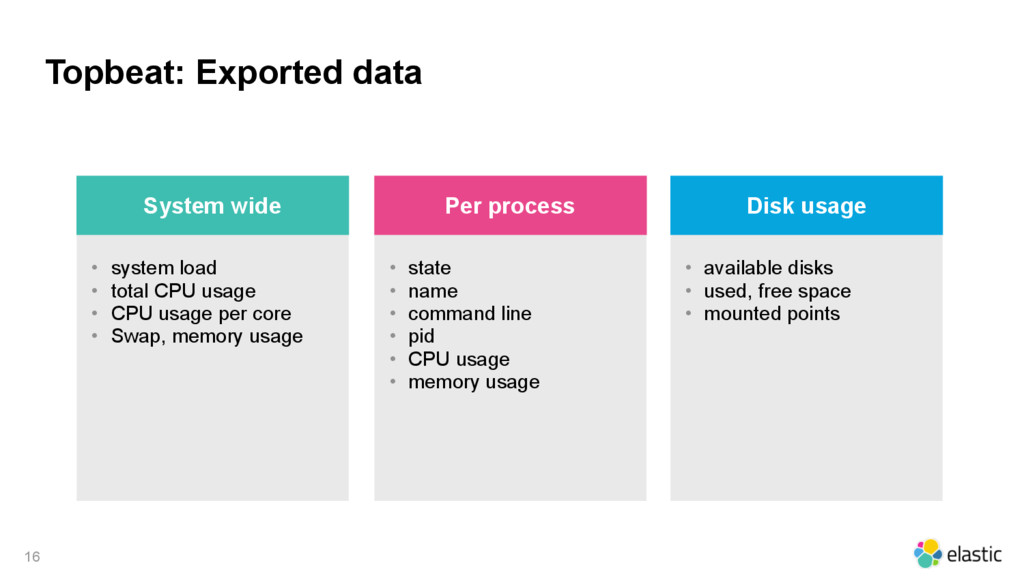
Metricbeat: récoltez vos métriques
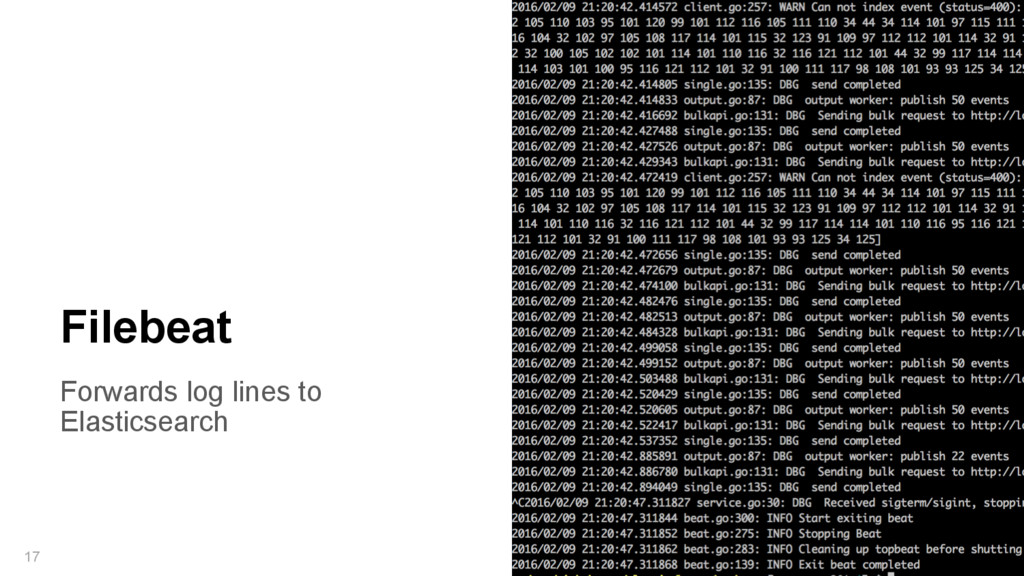
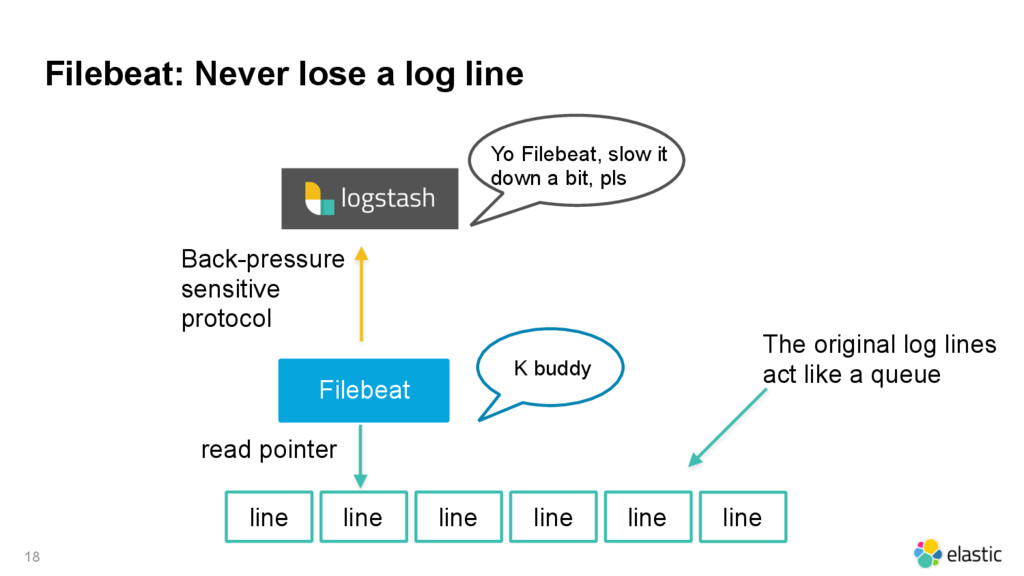
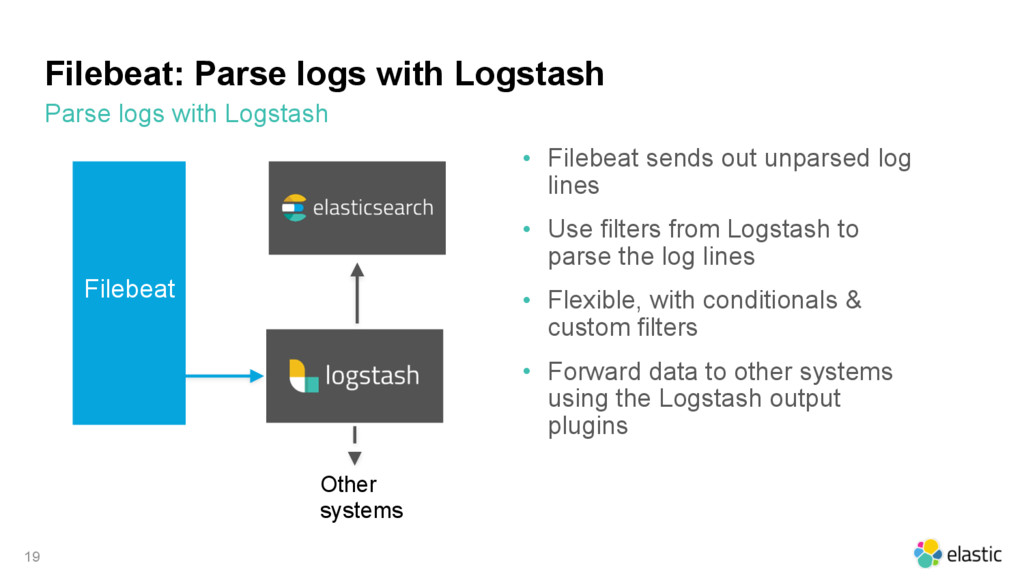
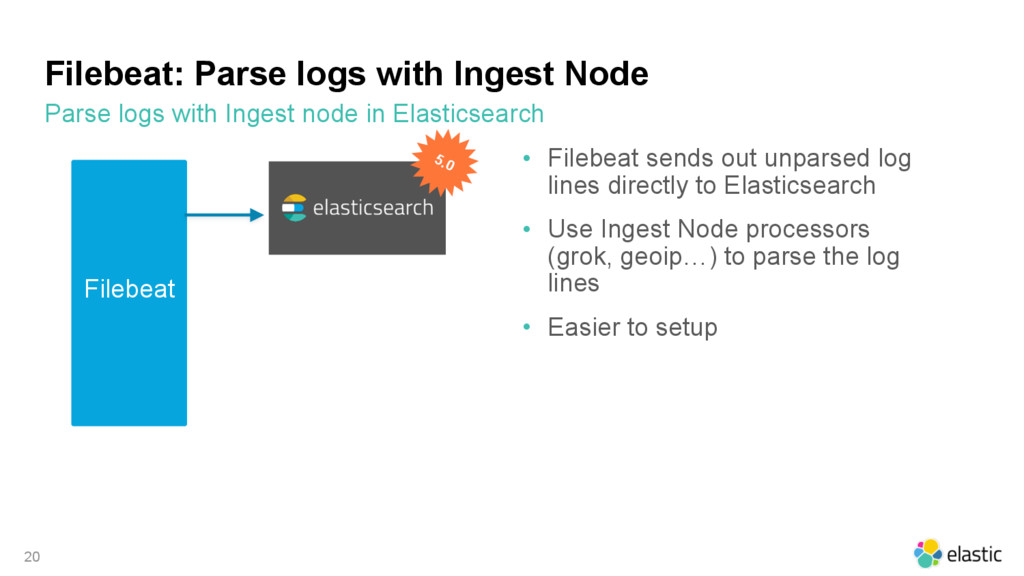
Filebeat: analysez vos logs en temps réel ou transmettez les vers logstash pour enrichissement
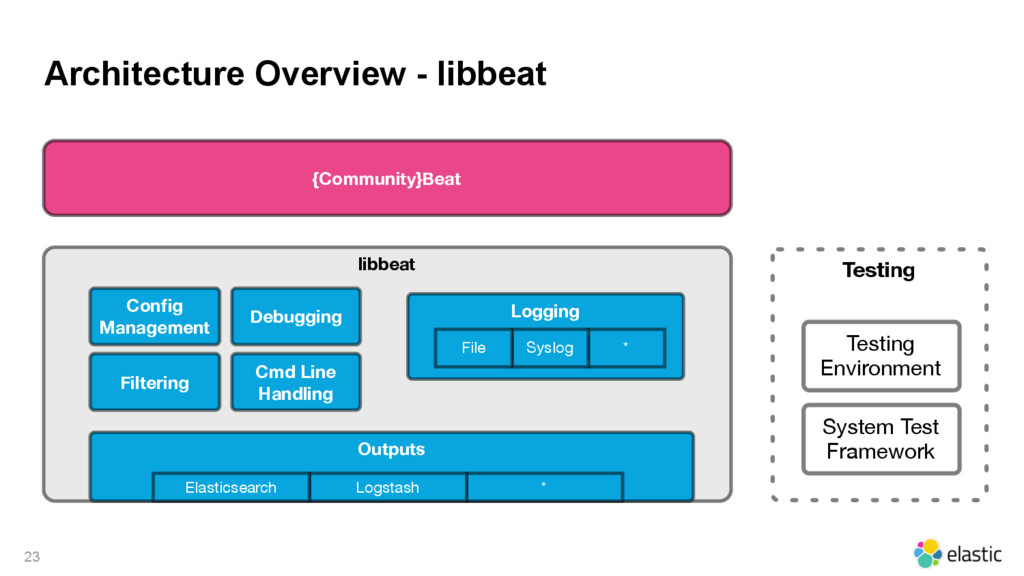
Et comment contribuer au mix et ajouter vos propres beats avec Libbeat.

Elastic Co

October 27, 2016
Tweet

More Decks by Elastic Co

Other Decks in Programming

Transcript

  1. 3

  2. 4 The only Elasticsearch as a Service offering powered by

    the creators of the Elastic Stack • Always runs on the latest software • One-click to scale/upgrade with no downtime • Free Kibana and backups every 30 minutes • Dedicated, SLA-based support • Easily add X-Pack features: security (Shield), alerting (Watcher), and monitoring (Marvel) • Pricing starts at $45 a month
  3. 5

  4. Examples of operational data 10 wire data system stats logs

    Packetbeat Metricbeat Filebeat Winlogbeat
  5. Sniffing the network traffic 12 Client Server sniff sniff •

    Copy traffic at OS or hardware level • Is completely passive • ZERO latency overhead • Not in the request/response path, cannot break your application
  6. Packetbeat: Real-time application monitoring 13 1 2 3 4 capture

    network traffic decodes network traffic correlates request with response in transactions extract measurements like response time, status 5 group meta info in json objects to send to Elasticsearch It does all of these in real-time directly on the target servers.
  7. Like the Unix top command but sends the output periodically

    to Elasticsearch. Also works on Windows. 15 Metricsbeat
  8. Topbeat: Exported data 16 • system load • total CPU

    usage • CPU usage per core • Swap, memory usage System wide • state • name • command line • pid • CPU usage • memory usage Per process • available disks • used, free space • mounted points Disk usage
  9. Filebeat: Never lose a log line 18 line line line

    line line read pointer Filebeat Back-pressure sensitive protocol Yo Filebeat, slow it down a bit, pls K buddy line The original log lines act like a queue
  10. Filebeat: Parse logs with Logstash Parse logs with Logstash 19

    • Filebeat sends out unparsed log lines • Use filters from Logstash to parse the log lines • Flexible, with conditionals & custom filters • Forward data to other systems using the Logstash output plugins Filebeat Other systems
  11. Filebeat: Parse logs with Ingest Node Parse logs with Ingest

    node in Elasticsearch 20 • Filebeat sends out unparsed log lines directly to Elasticsearch • Use Ingest Node processors (grok, geoip…) to parse the log lines • Easier to setup Filebeat 5.0
  12. Beats Platform 22 Explore & Visualize Search & Analyze Enrich

    & Transport Optional libbeat {Community} Beats Elastic Beats Collect, Parse & Ship
  13. Architecture Overview - libbeat 23 {Community}Beat libbeat Outputs * Logstash

    Elasticsearch Config Management Debugging Logging * Syslog File Cmd Line Handling Filtering Testing Testing Environment System Test Framework
  14. 25

  15. 26