Upgrade to Pro — share decks privately, control downloads, hide ads and more …

Correlating Metrics and Logs

Elastic Co
March 08, 2017

Correlating Metrics and Logs

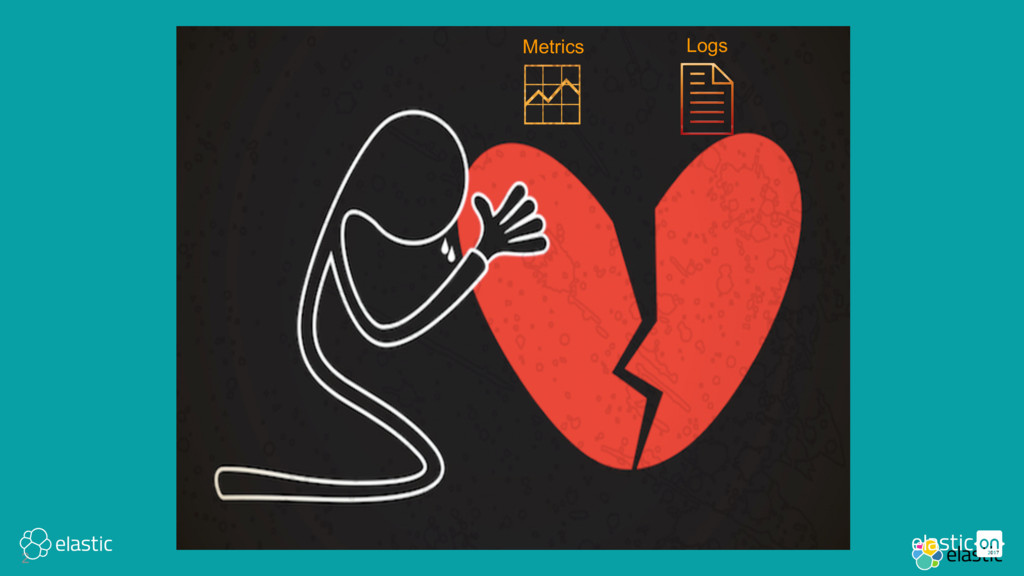
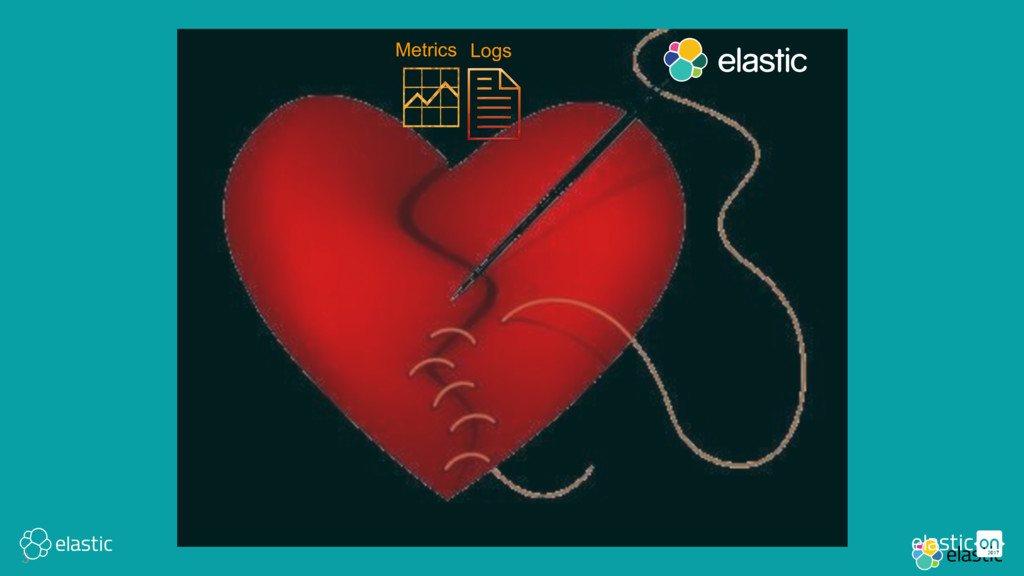
Metrics and logs are meant to be together. Why do we insist on keeping them apart? Learn about our mission to reunite them, in the process deriving powerful operational insights using brand-new Kibana visualizations and machine learning techniques.

Tanya Bragin l Director, Product Management l Elastic

Elastic Co

March 08, 2017
Tweet

More Decks by Elastic Co

Other Decks in Technology

Transcript

  1. 1
    Elastic
    March 8, 2017
    @tbragin
    Correlating Metrics and Logs
    Tanya Bragin, Dir. Product Management

    View Slide

  2. 2
    Logs
    Metrics

    View Slide

  3. 3
    Logs
    Metrics

    View Slide

  4. 4
    Definitions

    View Slide

  5. 5
    Oxford Dictionary
    { }
    logs:
    records of incidents or observations

    View Slide

  6. 6
    Oxford Dictionary
    { }
    metrics:
    a set of figures or statistics that
    measure results

    View Slide

  7. 7
    Logs vs Metrics
    7
    64.242.88.10 - - [07/Mar/2017:16:10:02 -0800] "GET /mailman/listinfo/hsdivision HTTP/1.1" 200 6291
    64.242.88.10 - - [07/Mar/2017:16:11:58 -0800] "POST /twiki/bin/view/TWiki/WikiSyntax HTTP/1.1" 404 7352
    64.242.88.10 - - [07/Mar/2017:16:20:55 -0800] "GET /twiki/bin/view/Main/DCCAndPostFix HTTP/1.1" 200 5253
    For each event, print out what happened.
    07/Mar/2017 16:10:00 all 2.58 0.00 0.70 1.12 0.05 95.55
    07/Mar/2017 16:20:00 all 2.56 0.00 0.69 1.05 0.04 95.66
    07/Mar/2017 16:30:00 all 2.64 0.00 0.65 1.15 0.05 95.50
    Every x minutes, measure the CPU load and print it out.
    Logs are records of discrete events, if an when they happen
    Metrics are periodic measurements of some KPIs

    View Slide

  8. 8
    Logs and Metrics are both “time series”
    8
    07/Mar/2017 16:10:00 all 2.58 0.00 0.70 1.12 0.05 95.55
    64.242.88.10 - - [07/Mar/2017:16:10:02 -0800] "GET /mailman/listinfo/hsdivision HTTP/1.1" 200 6291
    64.242.88.10 - - [07/Mar/2017:16:11:58 -0800] "POST /twiki/bin/view/TWiki/WikiSyntax HTTP/1.1" 404 7352
    07/Mar/2017 16:20:00 all 2.56 0.00 0.69 1.05 0.04 95.66
    64.242.88.10 - - [07/Mar/2017:16:20:55 -0800] "GET /twiki/bin/view/Main/DCCAndPostFix HTTP/1.1" 200 5253
    07/Mar/2017 16:30:00 all 2.64 0.00 0.65 1.15 0.05 95.50

    View Slide

  9. 9
    Unified analysis for all time series events
    9
    You can aggregate log information into “time series”
    Metric: CPU (avg, per interval)
    Logs: # events (count, per interval)

    View Slide

  10. 10
    Unified analysis for all time series events
    10
    You can aggregate log information into “time series”
    Metric: CPU (avg, per interval)
    Logs: # events (count, per interval)
    Metric: CPU (avg, per interval)
    Logs: response time (avg, per interval)

    View Slide

  11. 11
    DEMO TIME

    View Slide

  12. 12
    • Single pane of glass for Monitor -> Troubleshoot -> Root-Cause-Analysis
    • Machine learning and correlation on both types of data
    • Unified analytics and dashboards
    Correlate logs and metric data in one UI
    12
    what you gain

    View Slide

  13. 13
    • Manage a single ingest pipeline
    • Manage a single datastore
    Operational efficients are significant
    13
    what you gain

    View Slide

  14. 14
    Storage and Analysis

    View Slide

  15. 15
    Elasticsearch is a great datastore for metrics
    15
    https://www.elastic.co/blog/searching-numb3rs-in-5.0
    • BKD Trees
    • 71% faster at index time
    • 66% less disk usage
    • 85% less memory usage
    • New data types
    • Half float
    • Scaled float

    View Slide

  16. 16
    Metricbeat
    16
    • One Beat collects from many services
    • Periodic poling and predefined data structure
    • Ships with several modules or build your own
    ‒ System
    (replaces Topbeat)
    ‒ Apache
    ‒ MySQL
    ‒ PostgreSQL
    ‒ Nginx
    ‒ Redis
    ‒ Zookeeper
    ‒ MongoDB

    View Slide

  17. 17
    Filebeat modules
    17
    • Tails a file
    • Parses common formats using Ingest Node
    • Ships with several modules or build your own
    ‒ System
    ‒ Apache
    ‒ MySQL
    ‒ Nginx

    View Slide

  18. 18
    Time Series Visual Builder
    18
    •Works on top of pipeline
    aggregations
    •Visual way of combining
    aggregations into charts

    View Slide

  19. 19
    Timelion
    19
    Flexible and extensible query language for ad-hoc time-series analytics

    View Slide

  20. 20 20
    Typical Logging+Metrics Deployment
    Beats
    Logstash
    Elasticsearch Kibana
    X-Pack X-Pack
    Nodes (X)
    Instances (X)
    Master Nodes (3)
    Ingest Nodes (X)
    Data Nodes – Hot (X)
    Data Notes – Warm (X)
    Filebeat:
    Log Files
    Metricbeat:
    Metrics
    Packetbeat:
    Wire Data
    your{beat}
    Data Collection ETL Storage Visualization

    View Slide

  21. 21
    Logs+Metrics Use Cases

    View Slide

  22. 22
    • Use Metricbeat to collect CPU+Memory metrics
    • Use Filebeat to collect operating system logs
    • Use Packetbeat to sniff network traffic
    • Use Kibana to automatically visualize and correlate this data
    IT Infrastructure Monitoring
    22
    Collect system health and performance data
    Example: Walgreens

    View Slide

  23. 23
    • Collect metrics and logs at billions of events per day
    • Persist data in 6 globally-distributed data centers
    • Thousands of developers using centralized Kibana+Tribe instance
    Application Monitoring
    23
    Collect custom application telemetry and logs
    Example: Blizzard Entertainment

    View Slide

  24. 24
    • Monitor power, cooling, temperature, weather data
    • 6-12 months lookback
    • 150B documents online
    IOT Monitoring
    24
    Monitor a large set of low-power “edge devices”
    Example: National Energy Research
    Scientific Computing (NERSC) Center

    View Slide

  25. 25
    • Collect logs and metrics using edge devices
    • Deploying in over 100 locations in 70 countries
    • Data used for threat analytics
    IOT Monitoring
    25
    Monitor a large set of low-power “edge devices”
    Example: Nature Conservancy

    View Slide

  26. 26
    • You may already be doing it!
    • Don’t boil the ocean
    • Add only the metrics you need to your existing logging system (and vice versa)
    • Leverage off-the-shelf functionality to get started quickly (e.g. Metricbeat, Filebeat)
    How to get started
    26

    View Slide

  27. 27
    Questions?
    Visit us at the AMA

    View Slide

  28. 28
    www.elastic.c
    o

    View Slide