Upgrade to Pro — share decks privately, control downloads, hide ads and more …

Diving In The Deep End: Logging and Metrics at Digital Ocean

Elastic Co
November 17, 2015

Diving In The Deep End: Logging and Metrics at Digital Ocean

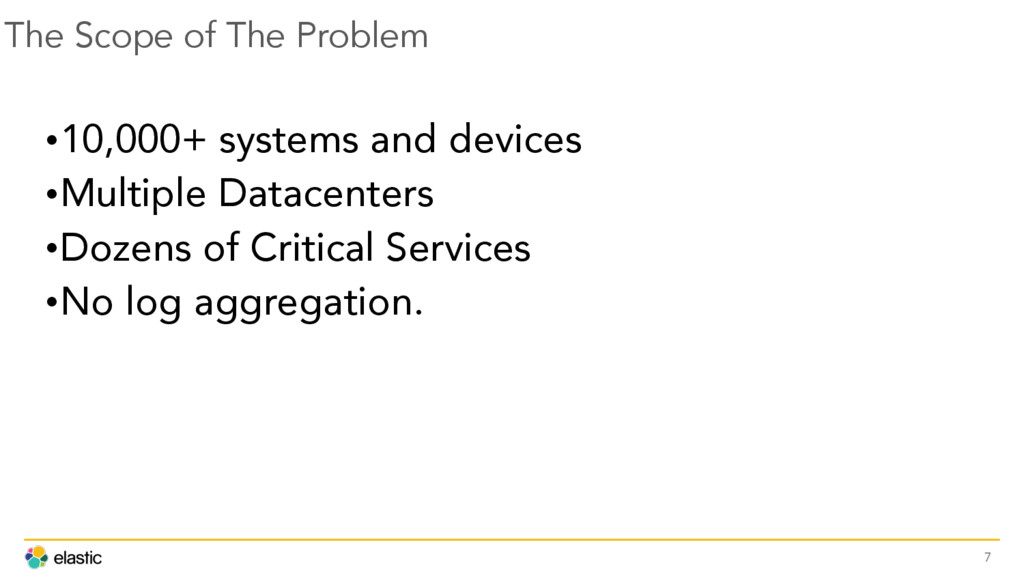
From server health checks to network monitoring to customer activity events -- logs are everywhere at DigitalOcean. In a single day, we collect more than a terabyte of real-time log data over our entire operations infrastructure. Buried in that non-stop stream of data is everything we need to know to keep DigitalOcean's cloud services up and running. This talk covers how we collect, parse, route, store, and make this data available to operations and engineers while keeping things simple enough for a small team to manage.

Elastic{ON} Tour | New York City | November 17, 2015
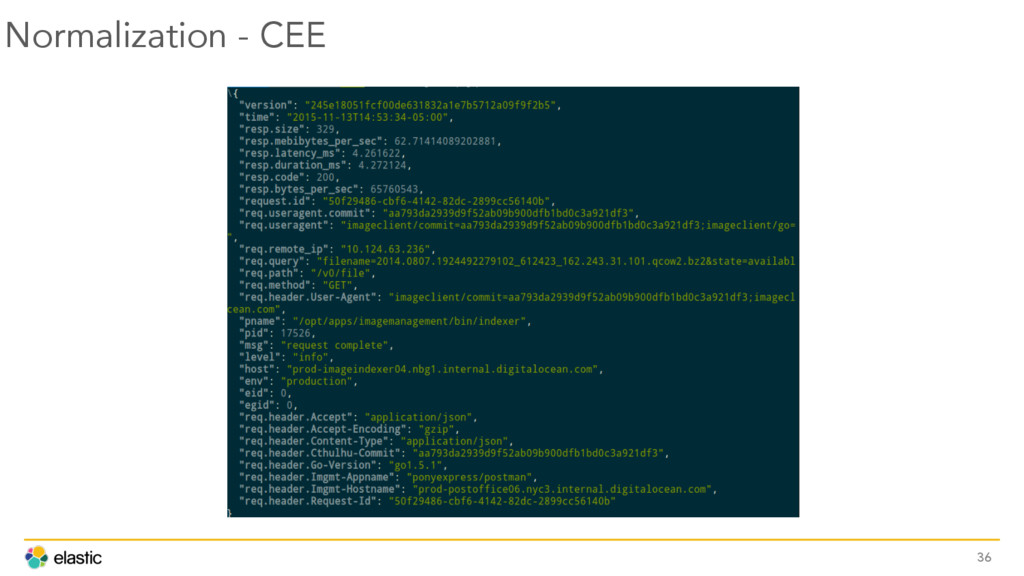
Elastic Co

November 17, 2015
Tweet

More Decks by Elastic Co

Other Decks in Technology

Transcript

  1. Diving in the Deep End: Logging & Metrics @ DigitalOcean

    Brian Knox, Tech Lead - Metrics & Logging Team | DigitalOcean 1
  2. Who Is this Person? 3 Brian Knox Things I Am:

    •Tech Lead, Metrics Team •Open Source Contributor ▪Rsyslog ▪ZeroMQ
  3. Who Is this Person? 5 Brian Knox Things I Am

    Not: •Frequent Speaker •Comfortable •Head Shot Model •Actually A Captain
  4. The Scope of The Problem 7 •10,000+ systems and devices

    •Multiple Datacenters •Dozens of Critical Services •No log aggregation.
  5. That Was A Lot Of Words We Help People To:

    •Know what is happening now. •Reason about what will happen in future. 14
  6. Solving One Problem At A Time You can't design a

    correct architecture when you don't understand the scope of the problem. 16
  7. Aggregation 20 •Rsyslog aggregator per region •Forward all logs for

    each region to the local regional aggregator •Write the logs to local disk, organized by host and program name ▪Easy to do with Rsyslog, it’s what it was made for ▪In-house expertise (me!)
  8. Aggregation 21 •Immediate Benefits: ▪Could begin analysis on log volume

    per day ▪Could now SSH to a central host to tail, grep, etc
  9. Aggregation •We were receiving around 100,000 log lines a second

    total. •That's more than we knew before. •Started doing some aggregate analysis of logs with simple scripts and learned... 22
  10. Aggregation •~ 70% of our log traffic was a single

    program that ran on every hypervisor, essentially saying “I'M STILL NOT DOING ANYTHING” as fast as it could. •Easy win: make it stop. 23
  11. Elasticsearch 26 •Get all logs loaded into Elasticsearch ▪More detailed

    analysis on log volume broken out by: oRegions oHosts oPrograms oLog Levels ▪Begin analysis of log content (thanks to full text indexing)
  12. Elasticsearch 27 •Small  cluster  from  repurposed  hardware   •Did  not

     have  to  be  (and  could  not  possibly  be)  perfect   •Just  needed  to  serve  its  purpose:   lLearn  what  we  could  about  our  logs   lLearn  what  we  could  about  Elasticsearch  from  an  operational  perspective   lUse  what  we  learned  to  design  the  next  iteration
  13. Elasticsearch – What Did We Learn? 28 •Learned who our

    loggers were: lPerl services lGolang services lRuby services lThird party services lLinux services lLinux Kernel lNetwork devices (routers, switches, firewalls) •Learned there was a lot of data in our logs that could be utilized if we structured out logs better
  14. Normalization  –  CEE  –  The  Vision  (TM) “Common Event Expression

    (CEE™) improves the audit process and the ability of users to effectively interpret and analyze event log and audit data. This is accomplished by defining an extensible unified event structure, which users and developers can leverage to describe, encode, and exchange their CEE Event Records.” 32
  15. Normalization - CEE <190>2015-03-25T16:57:40.945788-04:00 prod-imageindexer01 indexer[13813]: @cee:{"action":"image_delete", "controller":"images", "count":0, "egid":0,

    "eid":0, "env":"production", "host":"prod- imageindexer01.nyc3.internal.digitalocean.com", "level":"info", "msg":"deleting images/kernels", "pid":13813, "pname":"/opt/apps/ imagemanagement/bin/indexer", "request.id":"14234b67-3dd6-4926- bfdc-3cb74219c512", "time":"2015-03-25T16:57:40-04:00", "version":"bc304e26752d81ba9c6530076a94d4f5f512d0bd"} 35
  16. Kibana What We Now Had: lAll logs forwarded to regional

    aggregators lMost logs from our own systems structured lLogs stored on disk on aggregators for 3 days lLogs forwarded from aggregators to Elasticsearch 39
  17. Ummon Problem: It was difficult for support to examine event

    logs the way they were accustomed to. 46
  18. Logtalez Problem: We want to “tail” logs from remote services

    in real-time in a safe, secure, convenient manner. 49
  19. Logging Pipeline Components •Rsyslog for log shipping, parsing, and routing.

    •ZeroMQ for ephemeral real-time log stream subscriptions. •HAProxy for load balancing syslog traffic. •Elasticsearch for log indexing, storage and search. •Kibana for dashboards and exploration. 56
  20. New Elasticsearch Cluster 74 Problem: Internal “droplets” weren’t available at

    the time, we went with available hardware. This gave us what we needed short term, but we couldn't horizontally scale.
  21. New Elasticsearch Cluster - Planning 76 What We Knew: •Our

    total daily ingest rate •Our ingest rate per index •How fast a single droplet can index data What We Needed To Know: •The right droplet size to pick for the most benefit •How many of them we would need
  22. New Elasticsearch Cluster - Topology 78 •108 Total Shards on

    43 16GB Droplets ▪344 Cores ▪6.8 Terrabytes Max Storage ( 5.1 Terrabytes Usable @ 75% ) ▪688 Gigs of Memory ▪2 to 3 shards per droplet per day ▪28-42 shards for 14 total day retention
  23. Liblognorm 79 Problem: Some logs are still semi- structured, making

    it difficult to extract useful information from them.
  24. Liblognorm •Liblognorm is a log normalization library that creates log

    parsers for extracting field data from rulesets. •Liblognorm parse rules can be loaded into rsyslog using the mmnormalize module. 81
  25. Liblognorm – Field Extractors •Number •Float •Kernel-timestamp •Word •String-to •Char-to

    •Quoted-string •Date-rfc3164 •Date-rfc5424 •Ipv4 •Mac48 82 •Tokenized •Recursive •Regex •Iptables •Time-24h •Time-12hr •Duration •named_suffixed •Json •Cee-syslog
  26. Liblognorm – Field Extractors rule=: %-:word% IN=%-:word% OUT=%-:word% PHYSIN=%-:word% PHYSOUT=

    %-:word% SRC=%src-ip:ipv4% DST=%dst-ip:ipv4% LEN=%-:number% TOS= %-:word% PREC=%-:word% TTL=%-:number% ID=%-:number% %-:word% PROTO=%proto:word% SPT=%src-port:number% DPT=%dst-port:number% %-:rest% 83
  27. Watcher for Real Time Alerting •Problem: While it's easier to

    see what is going on in our infrastructure, we still aren't as proactive as we need to be. 84
  28. ZeroMQ Log Transport •Stateless connections •Encryption ( libsodium ) •Certificate

    Auth ( CurveZMQ ) •Load Balancing •Publish Subscribe •Application Layer Routing •Batch Acknowledgement •Credit based flow control 89
  29. ZeroMQ Log Transport - Stateless •Rsyslog on the Elasticsearch indexers

    can connect back to bound endpoints on the aggregators. The aggregators do not need to know about the indexing endpoints. Traffic will automatically be load balanced across all elasticsearch indexer endpoints. 90
  30. ZeroMQ Log Transport – Pub / Sub •Each branch in

    each rsyslog routing rule will have a ZeroMQ publish port where authorized subscribers can connect and receive topic based streams. This allows for: l Ad-hoc analytics l Easy tracing and debugging of log flow end to end 91
  31. ZeroMQ Log Transport – Microservices •Creating log flows through a

    series of microservices providing various filters and rules in an on demand fashion. Spin up, analyze in real-time, spin down. 92
  32. ZeroMQ Log Transport – Efficient Security •Current throughput tests of

    plugins with “typical” DO logs shows an upper capacity of ~ 150,000 encrypted log lines a second with simple RFC3164 parsing 93