Upgrade to Pro — share decks privately, control downloads, hide ads and more …

Elastic{ON} 2018 - Seven deadly sins of Elasticsearch benchmarking

Elastic Co
March 01, 2018

Elastic{ON} 2018 - Seven deadly sins of Elasticsearch benchmarking

Elastic Co

March 01, 2018
Tweet

More Decks by Elastic Co

Other Decks in Technology

Transcript

  1. 2

  2. • Run a well-defined workload • Measure performance metrics •

    Change a parameter • Compare results What is Benchmarking? 3 Characteristics
  3. 5

  4. • Same hardware: CPU, memory, disk, network • Same software:

    kernel / system libraries, JVM and Elasticsearch version • Same configuration: file system, I/O scheduler, network configuration Relevancy 6 Be close to production
  5. • Stable environment: Don’t change kernel / system libraries, JVM

    and Elasticsearch version • Turn off system daemons (e.g. updates) • Load generator is on a separate machine • Low-latency, high-throughput network between all machines • No other traffic on that network Reduce Noise 7 Better reproducible numbers
  6. • CPU L1 - L3 cache (incl. prefetching unit) •

    Disk-internal cache (absorb I/O spikes) • OS page cache (buffers writes to disk) • Application caches: shard request cache, node query cache Caches Everywhere 13 Consider in Warmup and Workload Definition
  7. • Important metrics: Throughput • Run at maximum throughput •

    Watch error rate (bulk rejections, request timeouts) and reduce load if necessary Tips 23 Batch Operations (e.g. bulk indexing)
  8. • Important metrics: Latency • Run at a defined throughput

    (use production metrics for guidance) • Latency >> service time is a clear sign of saturation Tips 24 Interactive Operations (e.g. searches)
  9. Measuring Latency 25 Modelling Arrivals: Deterministic schedule at 1 query/s

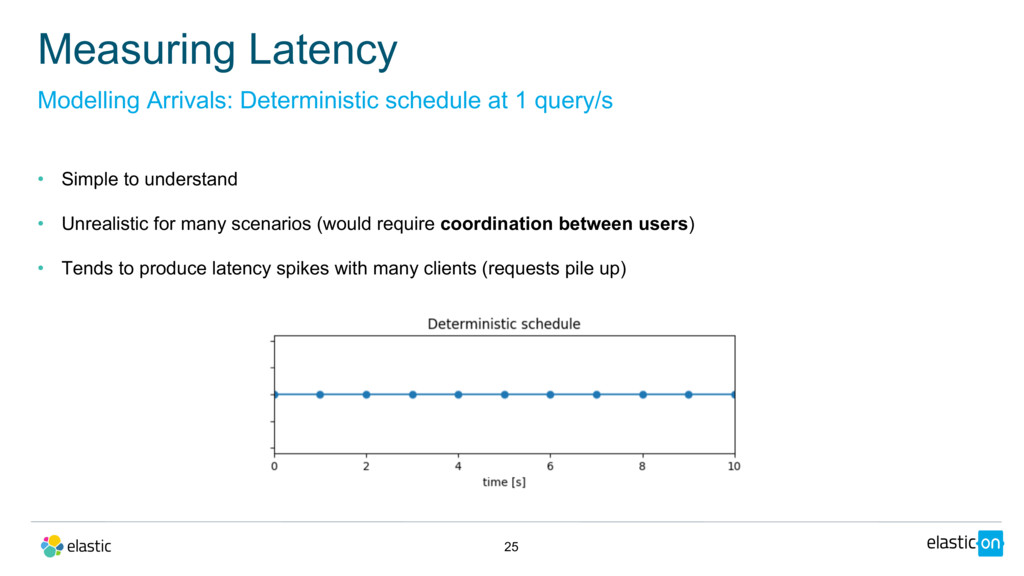
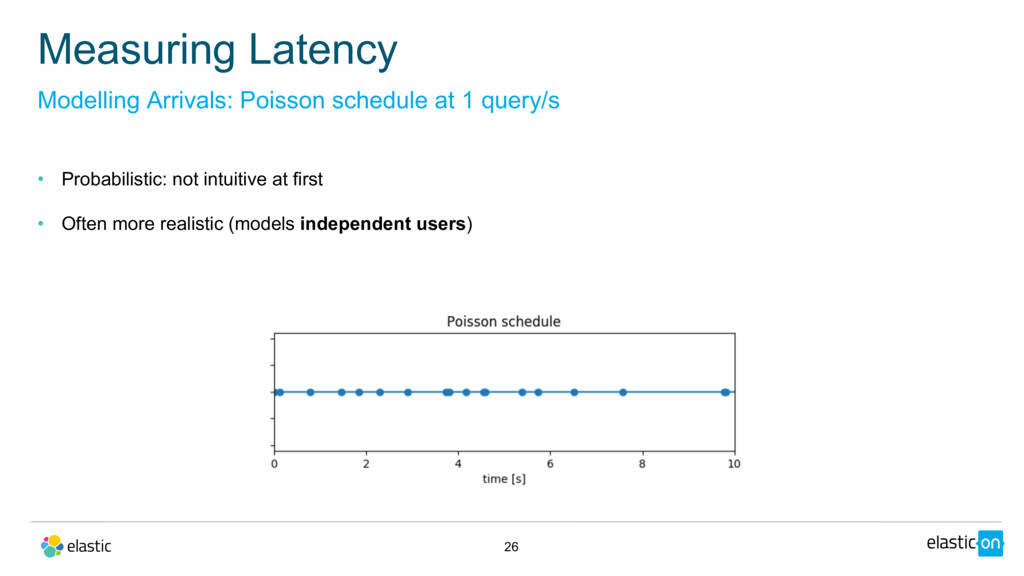
    • Simple to understand • Unrealistic for many scenarios (would require coordination between users) • Tends to produce latency spikes with many clients (requests pile up)
  10. Measuring Latency 26 Modelling Arrivals: Poisson schedule at 1 query/s

    • Probabilistic: not intuitive at first • Often more realistic (models independent users)
  11. Newsflash: Benchmarking software has bugs • Response status code checks

    (the fast 404)? • Maximum throughput of your load generator? 29 “It must be correct. After all, it produces numbers with 6 decimal places!”
  12. 31 # increase default request timeout es = Elasticsearch(target_hosts, timeout=60)

    while True: sendBulk(es) Example 1: Inappropriate Timeout Overwhelming Elasticsearch
  13. Example 2: Contention in Elasticsearch? 32 More clients, less load?

    Client Count Median Throughput [docs/s] 1 100.000 2 87.500 4 80.000 8 70.000
  14. 34 while read -r query do curl --data "${query}" "http://es:9200/cars/_search"

    & done < popular_car_queries.txt Example 3: Let’s query
  15. Be critical • Don’t trust any random script • Stress-test

    your load generator • Cross-check behavior on network level (Wireshark) • Test error scenarios (e.g. 404s) 35 Check, check and then check again
  16. Are you stressing the right component? 37 Check every subcomponent

    Load Generator Elasticsearch Master Nodes (3) Ingest Nodes (X) Data Nodes - Hot (X) Data Nodes - Warm (X)
  17. Are you stressing the right component? 38 More nodes: No

    throughput gains? Elasticsearch Node Count Median Throughput [docs/s] 1 1.300 2 2.600 3 2.600
  18. 39 Time ens3 HH:MM:SS KB/s in KB/s out 10:07:12 0.11

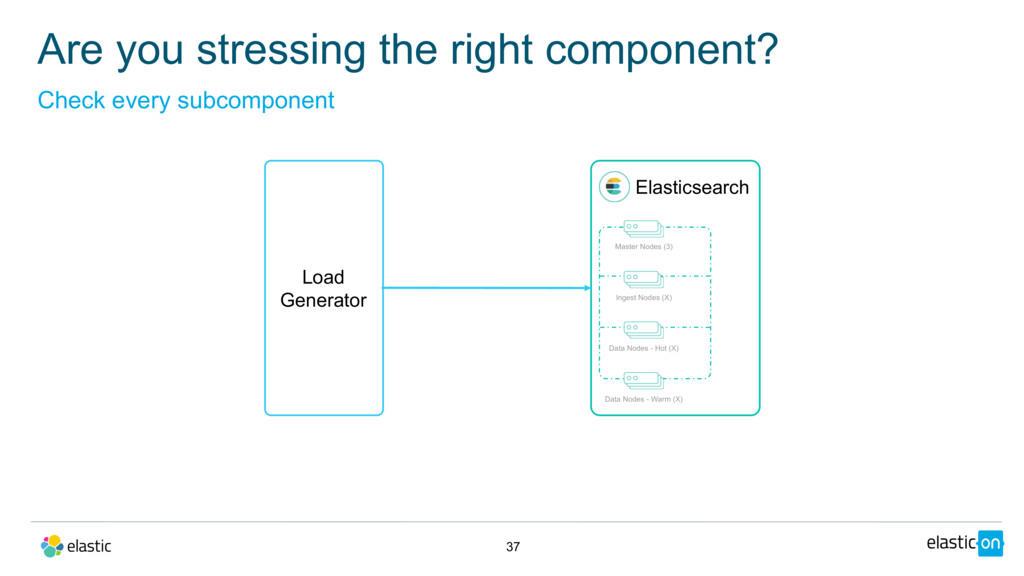
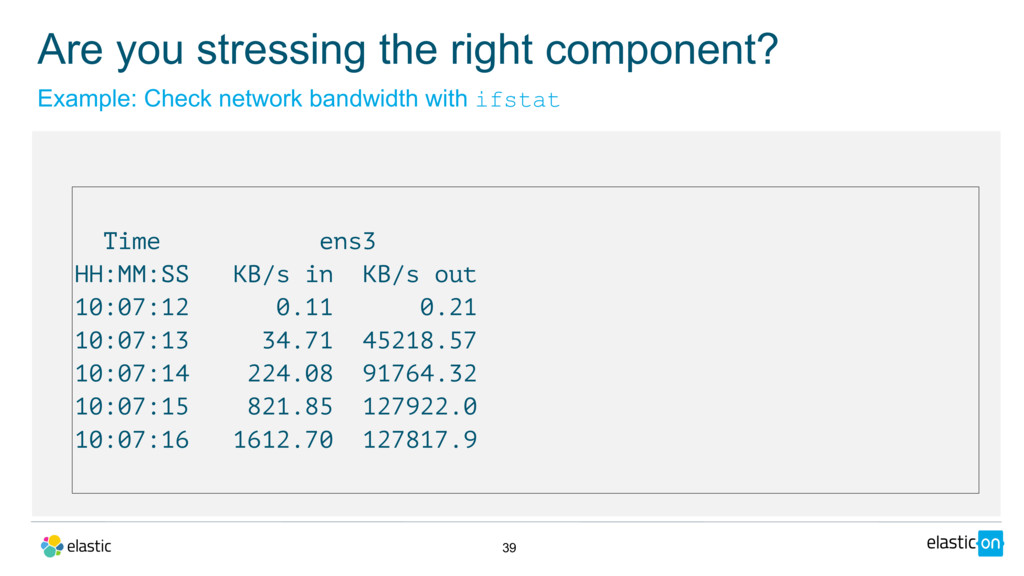
    0.21 10:07:13 34.71 45218.57 10:07:14 224.08 91764.32 10:07:15 821.85 127922.0 10:07:16 1612.70 127817.9 Example: Check network bandwidth with ifstat Are you stressing the right component?
  19. 40 Time ens3 HH:MM:SS KB/s in KB/s out 12:16:32 0.13

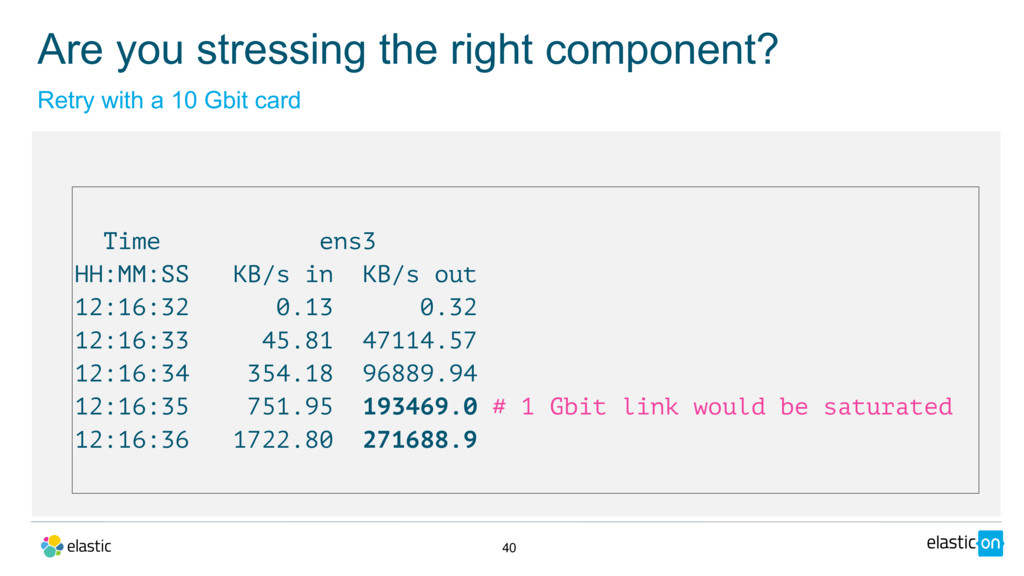
    0.32 12:16:33 45.81 47114.57 12:16:34 354.18 96889.94 12:16:35 751.95 193469.0 # 1 Gbit link would be saturated 12:16:36 1722.80 271688.9 Retry with a 10 Gbit card Are you stressing the right component?
  20. Are you stressing the right component? 41 Check every subcomponent

    Load Generator Switch Elasticsearch Master Nodes (3) Ingest Nodes (X) Data Nodes - Hot (X) Data Nodes - Warm (X)
  21. • Example approach: USE method by Brendan Gregg (http://www.brendangregg.com/usemethod.html) •

    Utilization • Saturation • Errors Are you stressing the right component? 42 Check methodically
  22. Benchmark Experiment Execution 46 Reset environment to known stable state

    1 2 3 Change one variable Run experiment (one or more iterations)
  23. 49 { "environment": "nightly", "trial-timestamp": "20180201T210054Z", "@timestamp": 1517544210265, "name": "cpu_utilization_1s",

    "value": 799.4, "unit": "%", "sample-type": "normal", "track": "nyc_taxis", "car": "4gheap", "meta": { "distribution_version": "7.0.0-alpha1", "source_revision": "df1c696", "node_name": "rally-node-0", "host_name": "192.168.14.3", "cpu_model": "Intel(R) Core(TM) i7-7700 CPU @ 3.60GHz", "os_name": "Linux", "os_version": "4.10.0-42-generic", "jvm_vendor": "Oracle Corporation", "jvm_version": "1.8.0_131" } } Example metrics record
  24. • Control every variable that you can (see “reducing noise”)

    • Run-to-run variation is a fact: lots of moving parts • Multiple trial runs (> 30) and statistical significance tests (e.g. t-test) Mitigating run-to-run variation 53 Statistical Significance Tests
  25. • Median, mean, mode: So many possibilities to choose! Median

    is robust against outliers • Report also at least minimum and maximum so readers get a feeling of the degree of variance Summarizing Results 54 General Tips
  26. • The meaningless mean: Half of the samples are worse

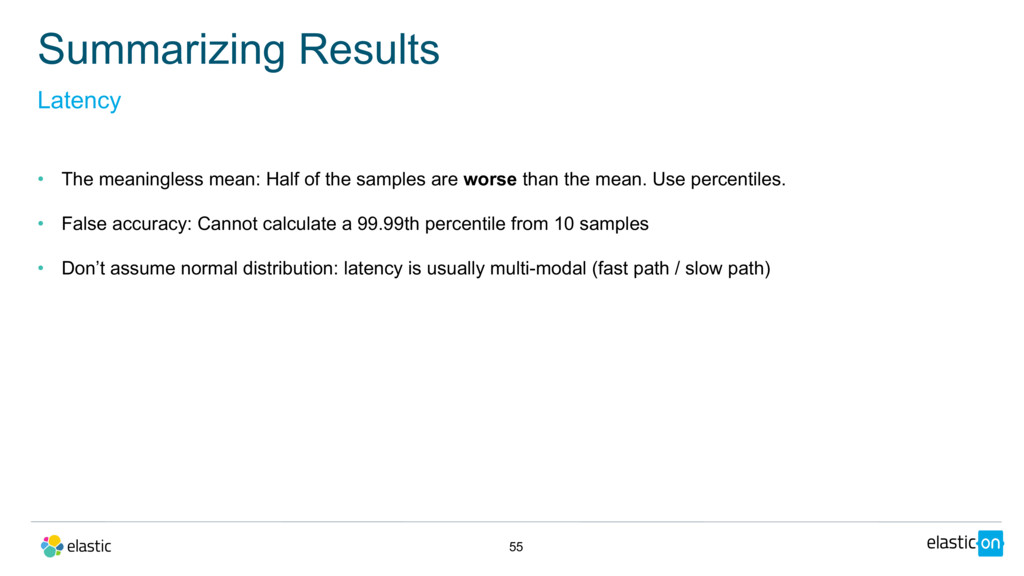
    than the mean. Use percentiles. • False accuracy: Cannot calculate a 99.99th percentile from 10 samples • Don’t assume normal distribution: latency is usually multi-modal (fast path / slow path) Summarizing Results 55 Latency
  27. 1. Benchmarks run in production-like environment 2. Warmup is considered

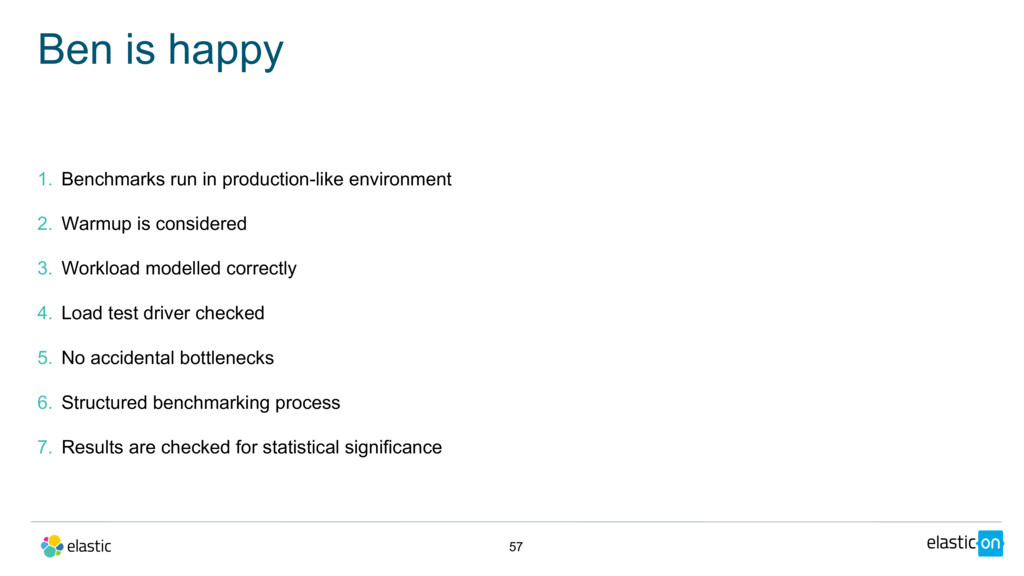
    3. Workload modelled correctly 4. Load test driver checked 5. No accidental bottlenecks 6. Structured benchmarking process 7. Results are checked for statistical significance Ben is happy 57
  28. • Macrobenchmarking tool Rally: https://github.com/elastic/rally • Rally implements many best

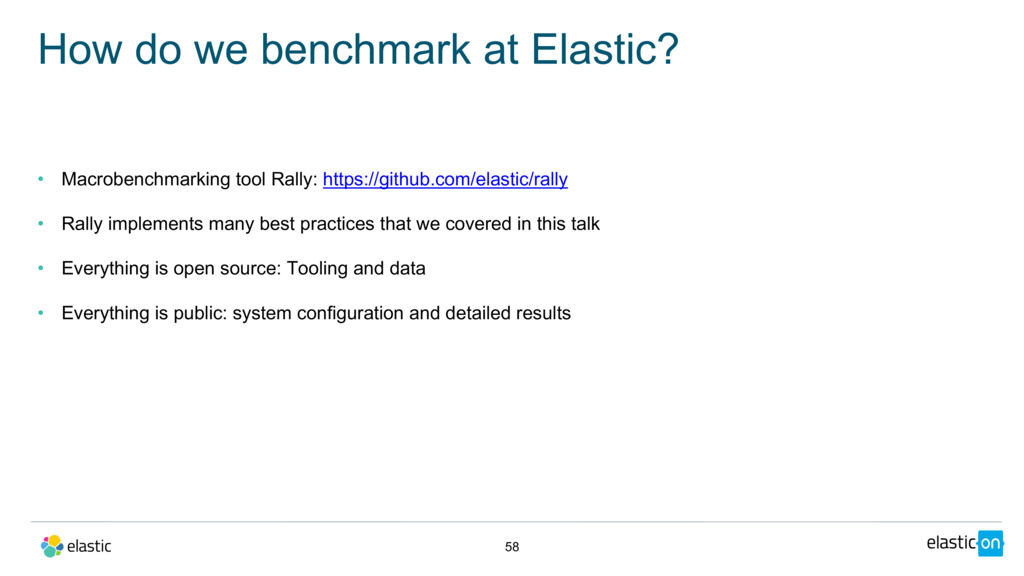
    practices that we covered in this talk • Everything is open source: Tooling and data • Everything is public: system configuration and detailed results How do we benchmark at Elastic? 58
  29. • Sin 1: On issuing TRIM: https://www.elastic.co/blog/is-your-elasticsearch-trimmed • Sin 3:

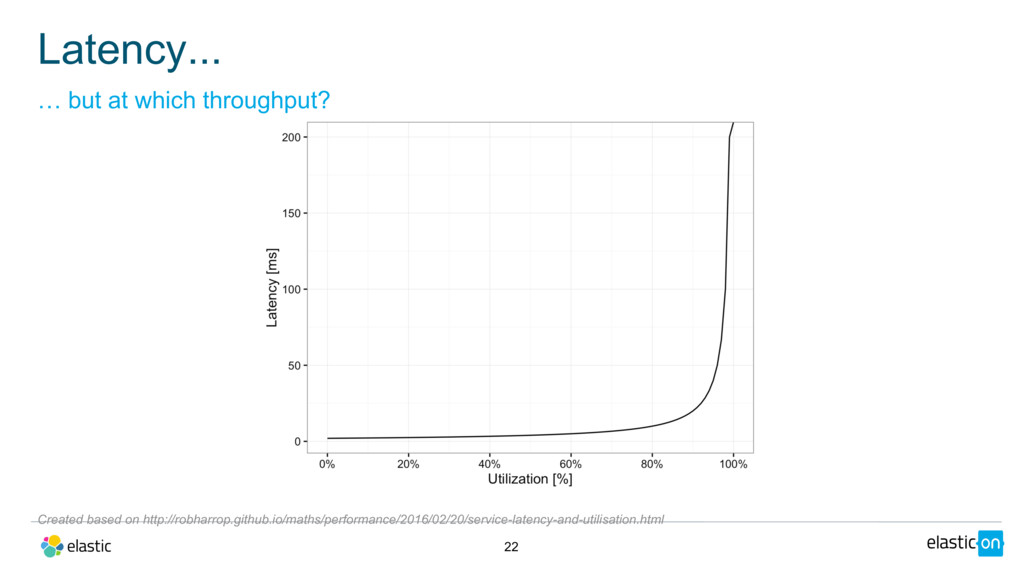
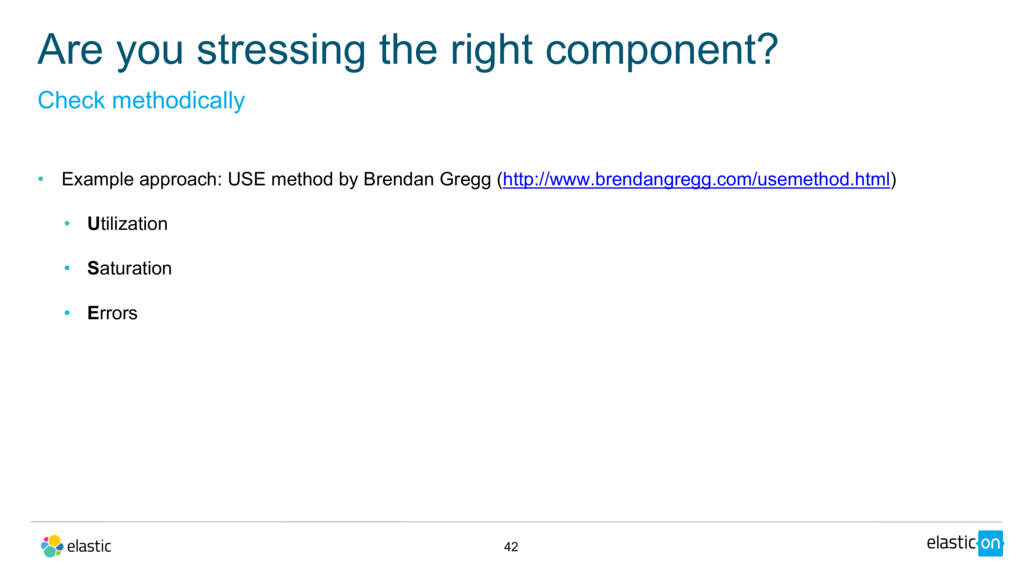
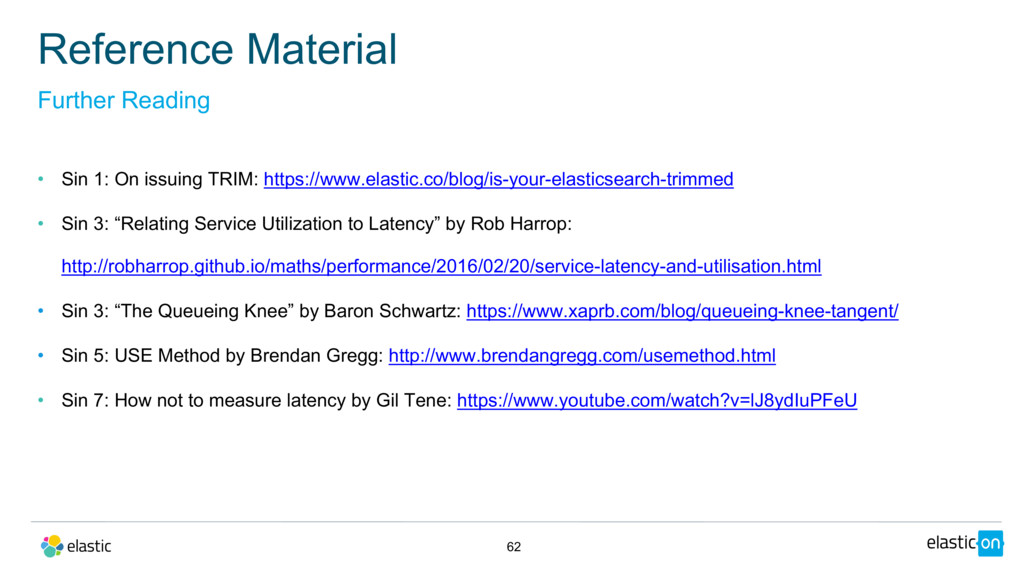
    “Relating Service Utilization to Latency” by Rob Harrop: http://robharrop.github.io/maths/performance/2016/02/20/service-latency-and-utilisation.html • Sin 3: “The Queueing Knee” by Baron Schwartz: https://www.xaprb.com/blog/queueing-knee-tangent/ • Sin 5: USE Method by Brendan Gregg: http://www.brendangregg.com/usemethod.html • Sin 7: How not to measure latency by Gil Tene: https://www.youtube.com/watch?v=lJ8ydIuPFeU Reference Material 62 Further Reading
  30. • Upgrade by gato-gato-gato (license: CC BY-NC-ND 2.0) • Oregon

    Dunes National Recreation Area by Theo Crazzolara (license: CC BY 2.0) • Paperwork by Erich Ferdinand (license: CC BY 2.0) • Coffee by Fil.Al (license: CC BY 2.0) • I miss coffee by Daniel Go (license: CC BY-NC 2.0) Reference Material 63 Image Credits 1/2
  31. • It's about the coffee by Neil Moralee (license: CC

    BY-NC-ND 2.0) • On an adventure by Dirk Dallas (license: CC BY-NC 2.0) • Traffic Jam by lorenz.markus97 (license: CC BY 2.0) • Swirl me back home by Nick Fisher (license: CC BY-ND 2.0) Reference Material 64 Image Credits 2/2
  32. Except where otherwise noted, this work is licensed under http://creativecommons.org/licenses/by-nd/4.0/

    Creative Commons and the double C in a circle are registered trademarks of Creative Commons in the United States and other countries. Third party marks and brands are the property of their respective holders. 65 Please attribute Elastic with a link to elastic.co