Upgrade to Pro — share decks privately, control downloads, hide ads and more …

How bol.com Makes Sense of its Logs Using the Elastic Stack

Elastic Co
October 29, 2015

How bol.com Makes Sense of its Logs Using the Elastic Stack

Renzo shares an overview of Bol.com using the Elastic stack to power its internal logging platform, making sense of events from 1500+ systems.

Renzo Toma | Elastic{ON} Tour Amsterdam | October 29, 2015

Elastic Co

October 29, 2015
Tweet

More Decks by Elastic Co

Other Decks in Technology

Transcript

  1. Renzo Tomà, bol.com
    1  
    How bol.com makes sense of its logs,
    using the Elastic technology stack.

    View Slide

  2. How bol.com makes sense of its logs,
    using the Elastic technology stack.
    2
    Renzo Tomà, Oct. 29 2015

    View Slide

  3. • Renzo Tomà
    • IT Operations engineer at bol.com, large webshop in the Netherlands and Belgium
    • Product owner & tech lead for 2 platforms: metrics & logsearch
    • Opensource user + contributor
    • Husband and dad of 2 cool kids!
    3
    Please to meet you

    View Slide

  4. ELK powers a Logsearch platform (“grep on steroids”).
    Log events from many layers of our infrastructure.
    Central user interface for querying: Kibana.
    For software developers, system engineers & our security team (~300 potential users).
    Supports development & operations co-op (sharing Kibana dashboards = 1 truth).
    Bottomline: faster incident resolution = less revenue loss.
    4
    bol.com & ELK

    View Slide

  5. ELK is a 1st class citizen, since datacenter rebuild go-live 
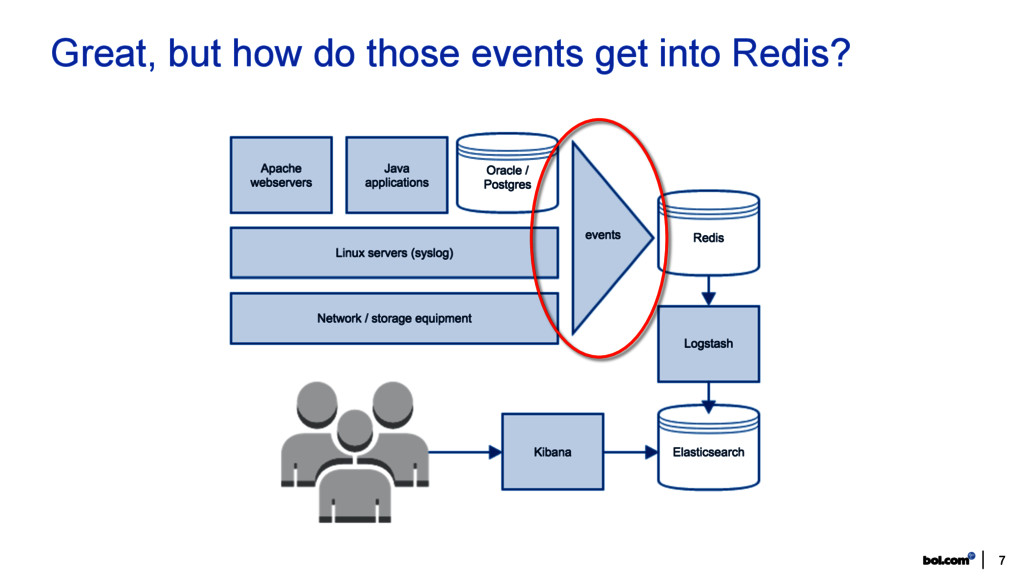
in 2014.
    Getting feeds from:
    • 3 datacenters
    • 5 frontend apps, 80+ services
    • lots of databases
    Log types: Apache and Tomcat access logging, Log4j, PostgreSQL, Oracle, syslog, …
    Numbers:
    • 1600+ servers emitting log events
    • 500-600 million events per day, indexing peaks at 25k/sec
    • 23 billion events stored, 14TB * 2 on disk
    • We keep 90 days available for search.
    5
    ELK as 1st class citizen

    View Slide

  6. 6
    Our high level design

    View Slide

  7. 7
    Great, but how do those events get into Redis?

    View Slide

  8. In 2013: tail files & ship lines to Logstash over UDP. Lots of grokking.
    Logstash (1 instance) unable to process feed in real time => data loss, incomplete events.
    Need for speed & simplicity!
    • Scale Logstash instances. Use Redis as message bus, to feed multiple Logstash instances.
    • Reduce need for complex grok. Format events in a structured format.
    In 2015: events get converted into JSON docs at the source. Our shippers run inside JVMs and DBs.
    Logstash reads from Redis and decodes events. No more grokking.
    Logstash out of work? No. Cleanup, enrichment (IP geo location) and metrics generations (lag, throughput).
    8
    Struggles in log shipping

    View Slide

  9. Application server access logging (Tomcat):
    Inside Tomcat: convert ‘hits’ into JSON doc and send to Redis: https://github.com/bolcom/redis-log-valve
    Java application logging (Log4j):
    Inside JVM: convert events into JSON doc and send to Redis:
    https://github.com/bolcom/log4j-jsonevent-layout + https://github.com/bolcom/log4j-redis-appender
    Webserver access logging (Apache):
    •  Custom LogFormat to output ‘hit’ as JSON: http://untergeek.com/2013/09/11/getting-apache-to-output-json-for-logstash-1-2-x/
    •  Apache sends JSON docs to external process, which sends to Redis.
    Docker logging:
    Shipper container: subscribes to logs for all running containers, convert events into JSON doc and send to Redis:
    https://github.com/bolcom/logspout-redis-logstash
    Oracle logging:
    Inside database: custom PL/SQL package with API, creates JSON docs and send to Redis.
    PostgreSQL logging:
    Inside database: hooks into logging, convert events into JSON doc and send to Redis: https://github.com/2ndquadrant-it/redislog
    9
    The logshippers we use

    View Slide

  10. Each Webshop request gets tagged with Request ID.
    Webshop is 
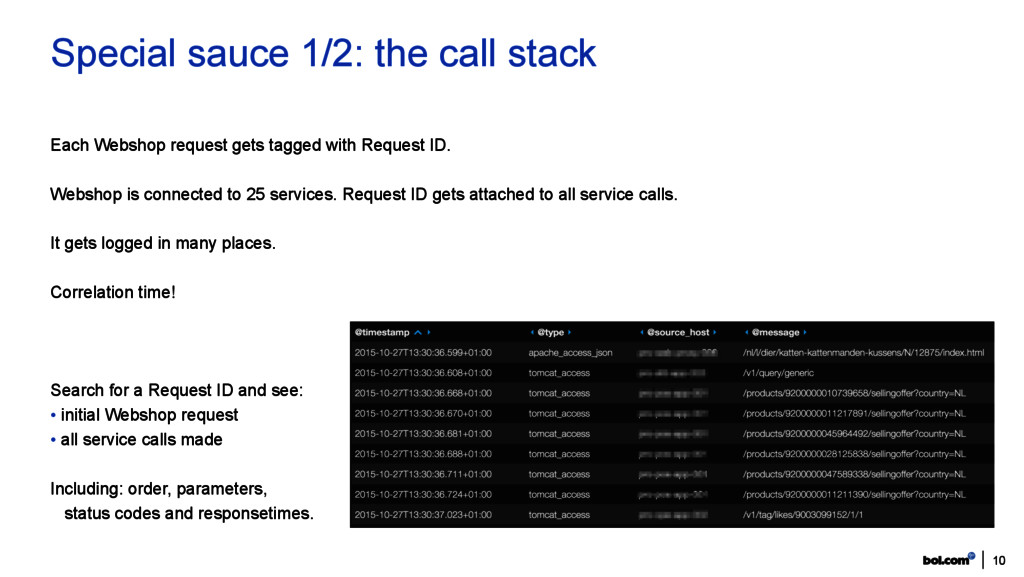
connected to 25 services. Request ID gets attached to all service calls.
    It gets logged in many places.
    Correlation time!
    Search for a Request ID and see:
    • initial Webshop request
    • all service calls made
    Including: order, parameters,
    status codes and responsetimes.
    10
    Special sauce 1/2: the call stack

    View Slide

  11. We have 5 frontend application and 80+ services. Services calling 
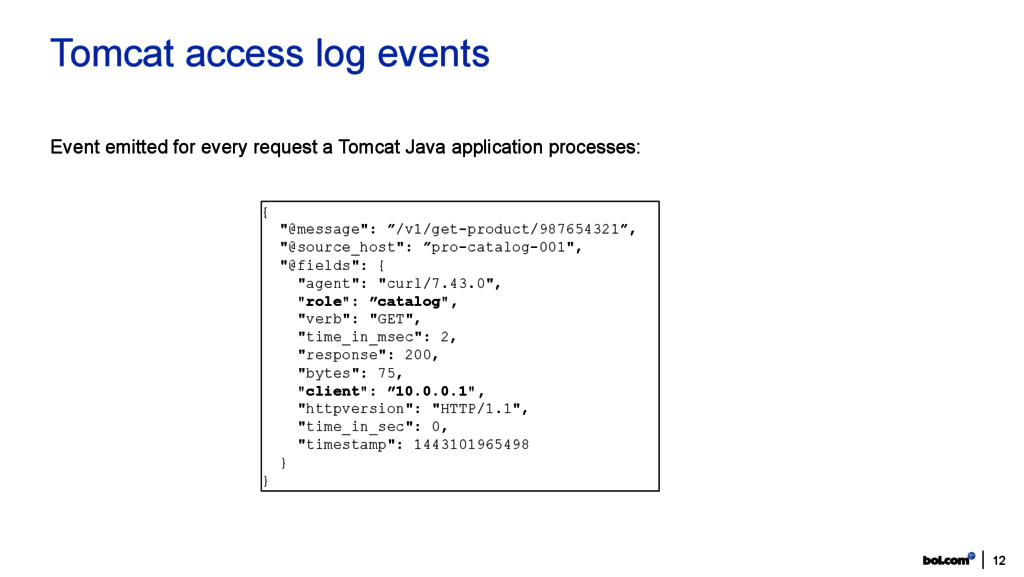
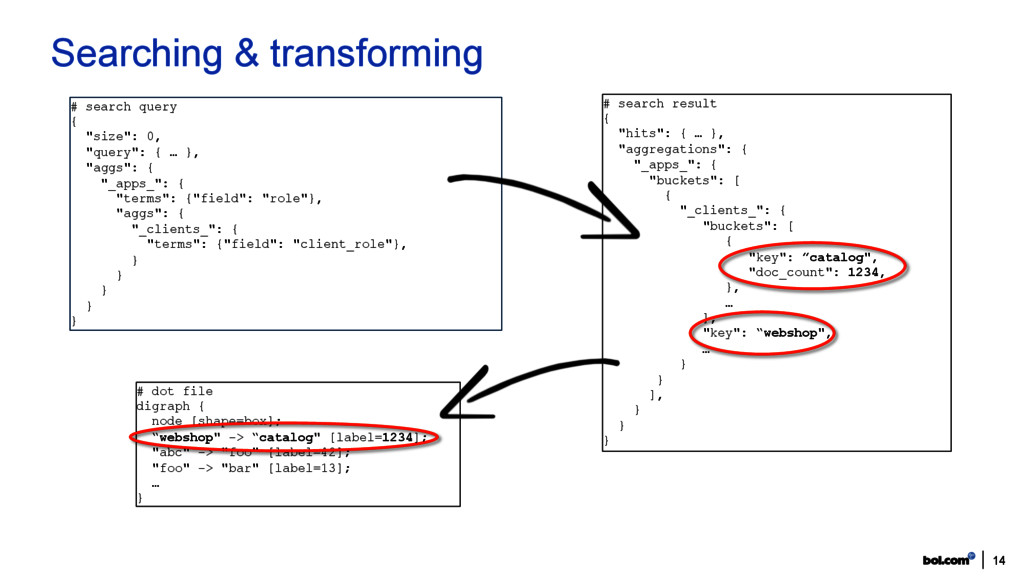
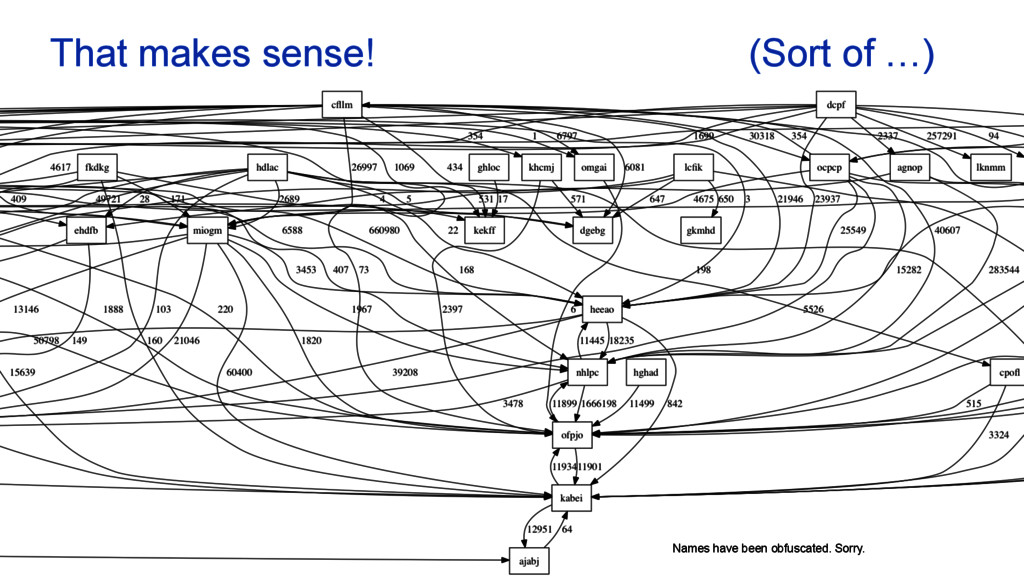
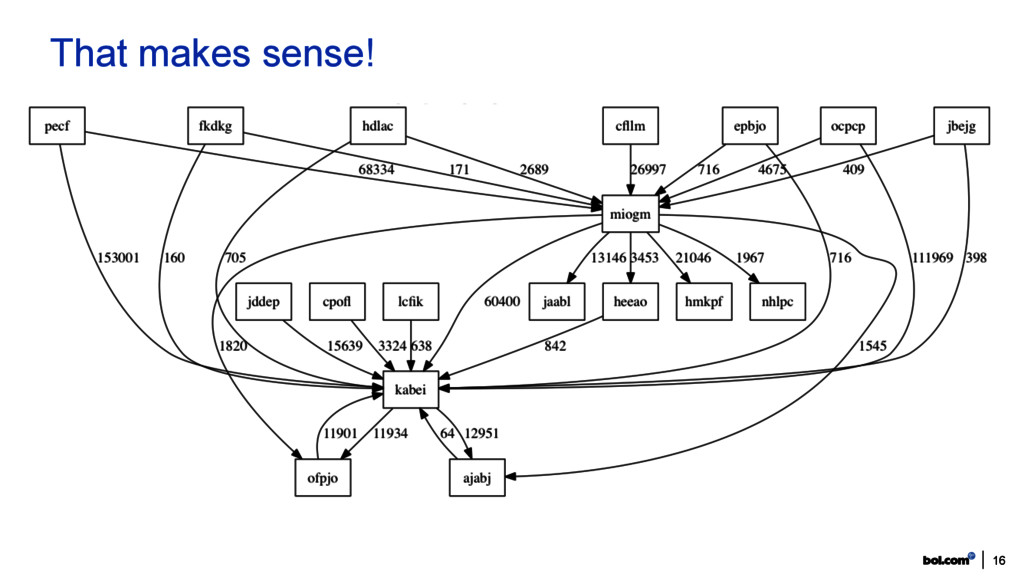
services.
    New services get introduced. New connections are made. Canary releases. A/B testing…
    Its a living distributed architecture.
    We need a map, we can trust!
    Let’s build a directed graph.
    • Use the Tomcat access logging
    • Add “A called B” information
    • Elasticsearch aggregation query
    • Transform the result and draw graph
    11
    Special sauce 2/2: the service map

    View Slide

  12. Event emitted for every request a Tomcat Java application processes:
    12
    Tomcat access log events
    {
    "@message": ”/v1/get-product/987654321”,
    "@source_host": ”pro-catalog-001",
    "@fields": {
    "agent": "curl/7.43.0",
    "role": ”catalog",
    "verb": "GET",
    "time_in_msec": 2,
    "response": 200,
    "bytes": 75,
    "client": ”10.0.0.1",
    "httpversion": "HTTP/1.1",
    "time_in_sec": 0,
    "timestamp": 1443101965498
    }
    }

    View Slide

  13. We create a lookup table for our whole datacenter IP space:
    “10.0.0.1”: “webshop”
    “10.0.0.2”: “catalog”

    Add new field, using Logstash ‘translate’ filter:
    translate {
    dictionary_path => ‘ip-to-role-mapping.yaml’
    field => ‘client’
    destination => ‘client_role’
    }
    That’s all we need.
    13
    Enrich events with external data
    {
    "@message": ”/v1/get-product/987654321”,
    "@source_host": ”pro-catalog-001",
    "@fields": {
    "agent": "curl/7.43.0",
    "role": ”catalog",
    "verb": "GET",
    "time_in_msec": 2,
    "response": 200,
    "bytes": 75,
    "client": ”10.0.0.1",
    ”client_role": ”webshop",
    "httpversion": "HTTP/1.1",
    "time_in_sec": 0,
    "timestamp": 1443101965498
    }
    }

    View Slide

  14. 14
    Searching & transforming
    # search query
    {
    "size": 0,
    "query": { … },
    "aggs": {
    "_apps_": {
    "terms": {"field": "role"},
    "aggs": {
    "_clients_": {
    "terms": {"field": "client_role"},
    }
    }
    }
    }
    }
    # search result
    {
    "hits": { … },
    "aggregations": {
    "_apps_": {
    "buckets": [
    {
    "_clients_": {
    "buckets": [
    {
    "key": ”catalog",
    "doc_count": 1234,
    },

    ],
    "key": “webshop",

    }
    }
    ],
    }
    }
    }
    # dot file
    digraph {
    node [shape=box];
    “webshop" -> “catalog" [label=1234];
    "abc" -> "foo" [label=42];
    "foo" -> "bar" [label=13];

    }

    View Slide

  15. 15
    That makes sense! (Sort of …)
    Names have been obfuscated. Sorry.

    View Slide

  16. 16
    That makes sense!

    View Slide

  17. Renzo Tomà
    [email protected]
    Thanks!

    View Slide