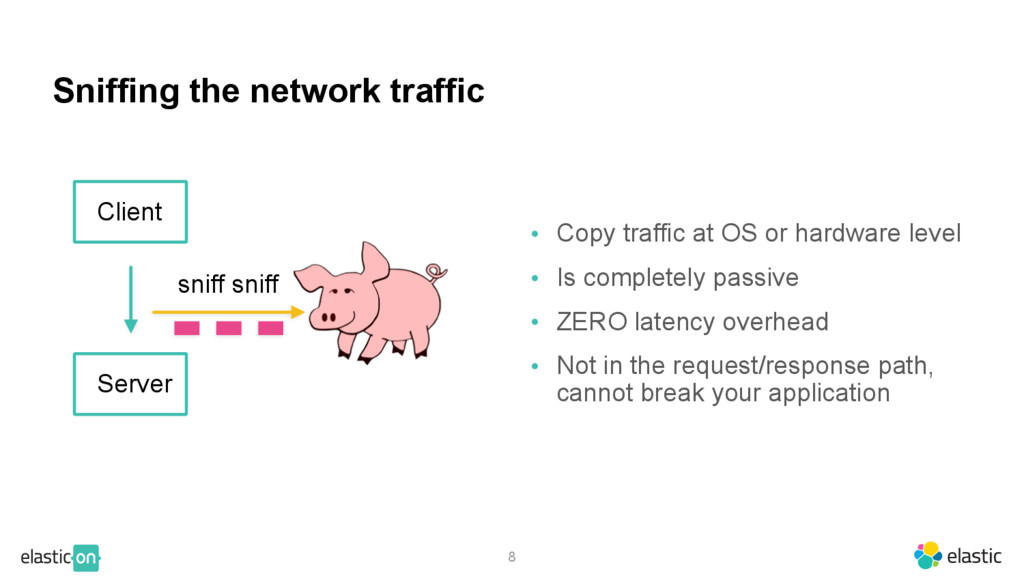
or hardware level • Is completely passive • ZERO latency overhead • Not in the request/response path, cannot break your application Client Server sniff sniff
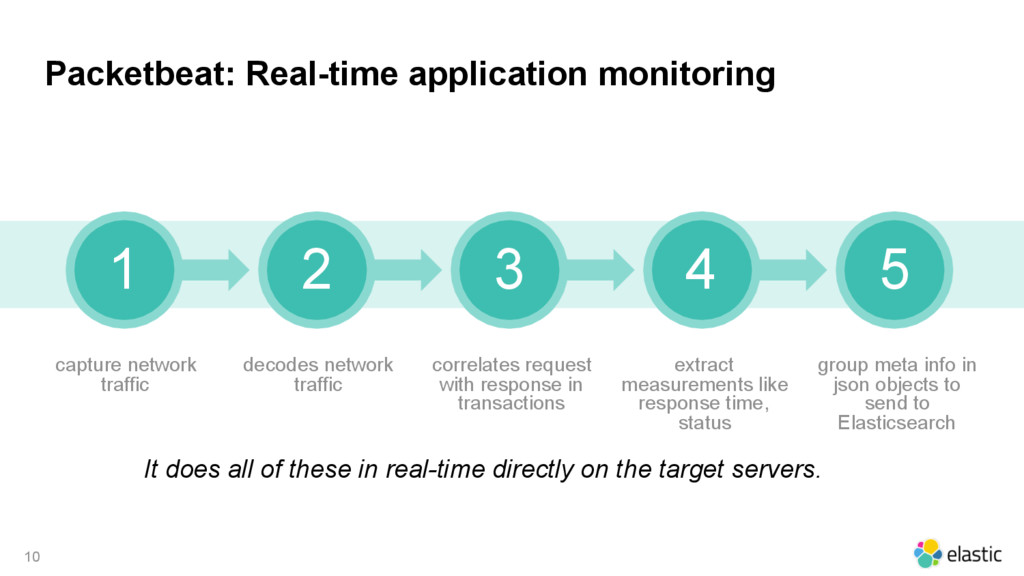
network traffic decodes network traffic correlates request with response in transactions extract measurements like response time, status 5 group meta info in json objects to send to Elasticsearch It does all of these in real-time directly on the target servers.
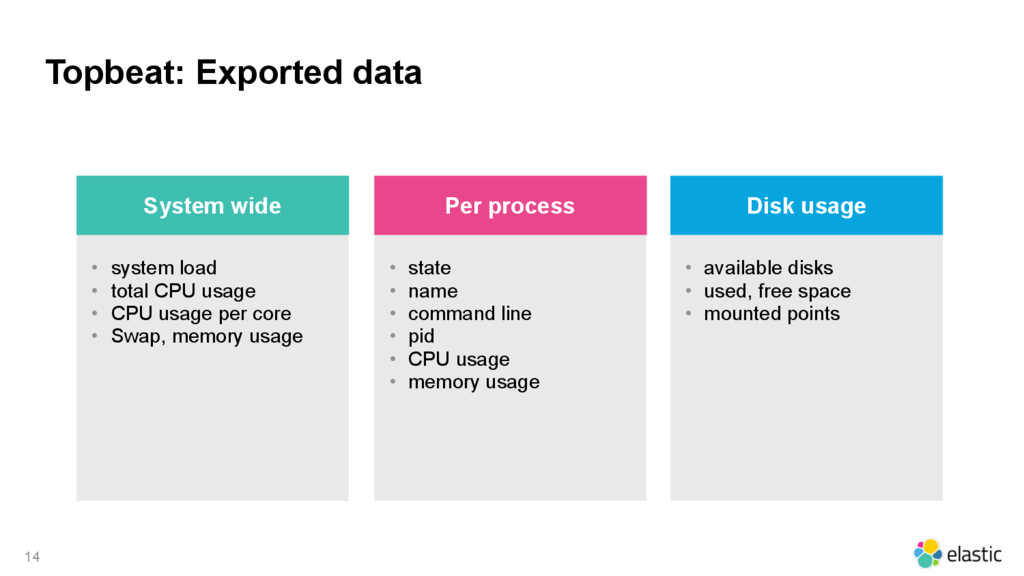
usage • CPU usage per core • Swap, memory usage System wide • state • name • command line • pid • CPU usage • memory usage Per process • available disks • used, free space • mounted points Disk usage
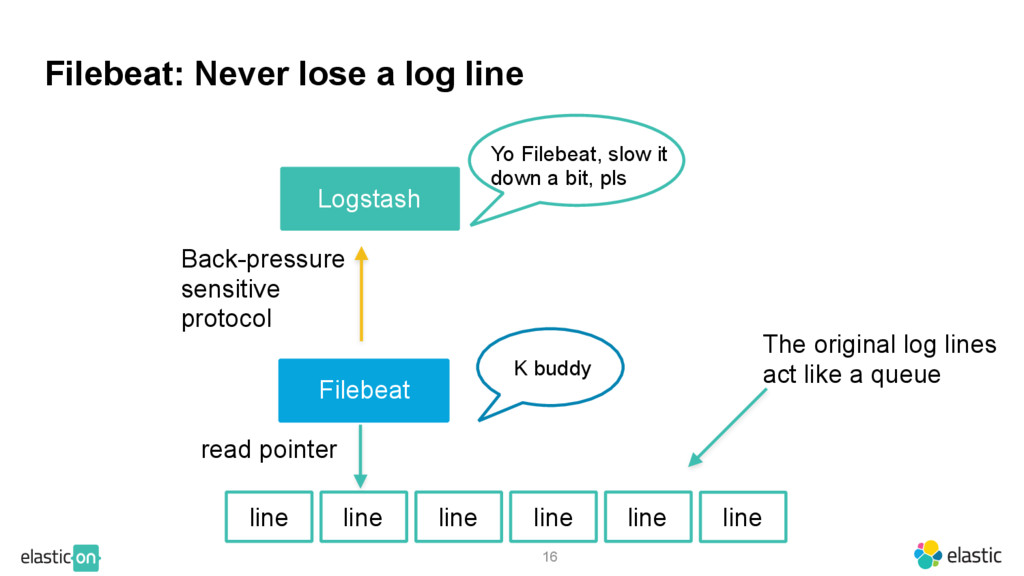
line line read pointer Filebeat Logstash Back-pressure sensitive protocol Yo Filebeat, slow it down a bit, pls K buddy line The original log lines act like a queue
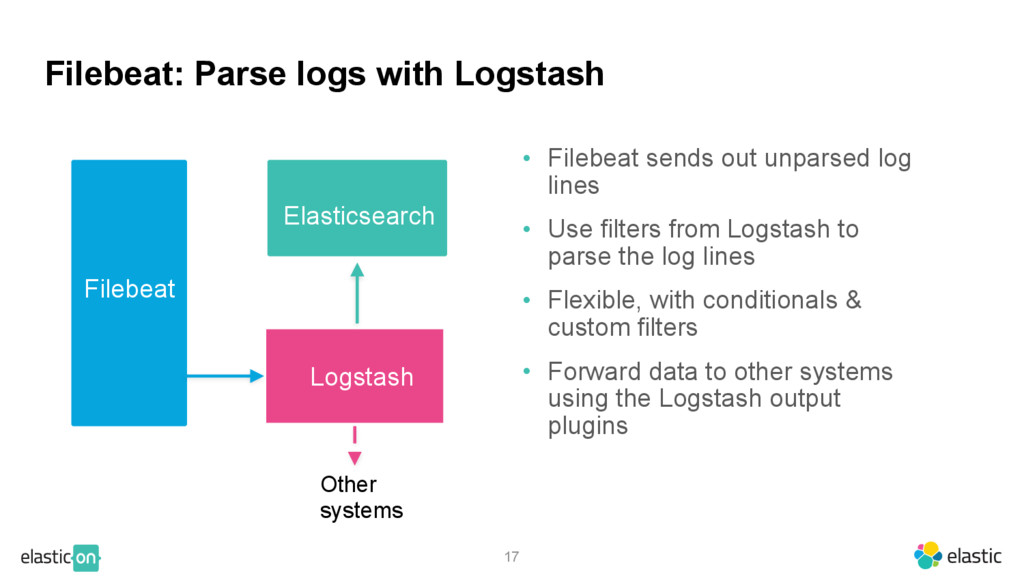
unparsed log lines • Use filters from Logstash to parse the log lines • Flexible, with conditionals & custom filters • Forward data to other systems using the Logstash output plugins Filebeat Elasticsearch Logstash Other systems
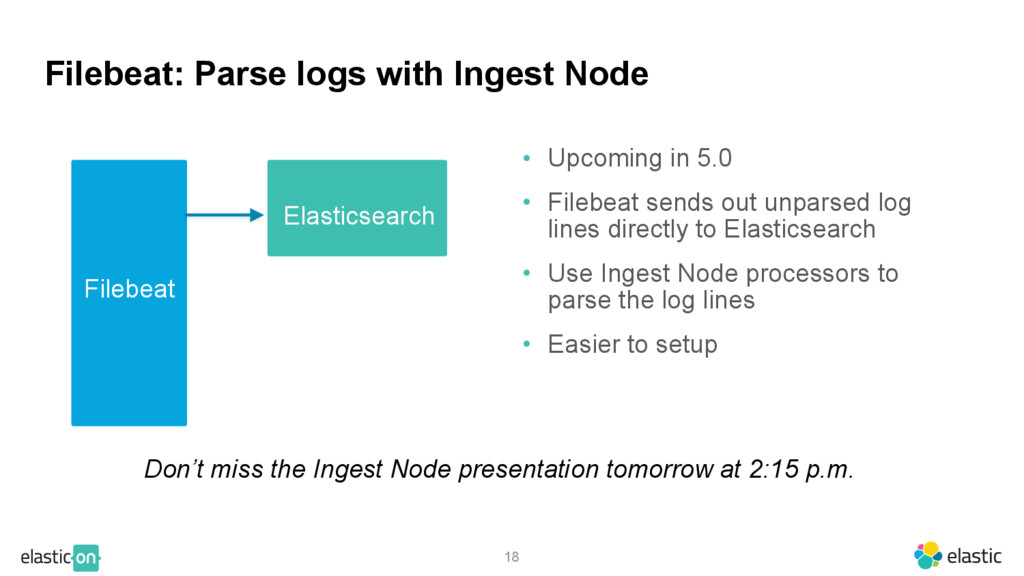
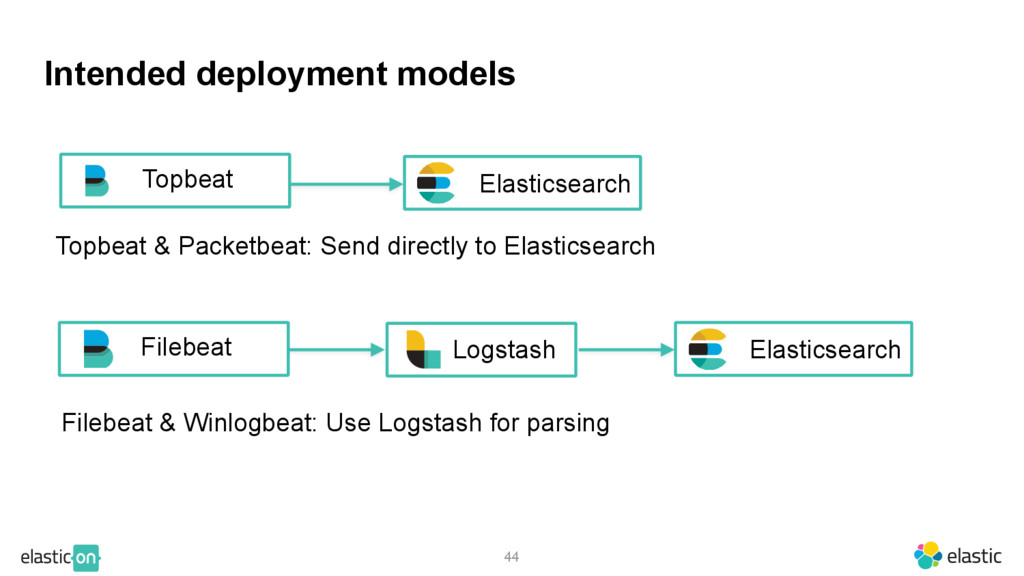
5.0 • Filebeat sends out unparsed log lines directly to Elasticsearch • Use Ingest Node processors to parse the log lines • Easier to setup Filebeat Elasticsearch Don’t miss the Ingest Node presentation tomorrow at 2:15 p.m.
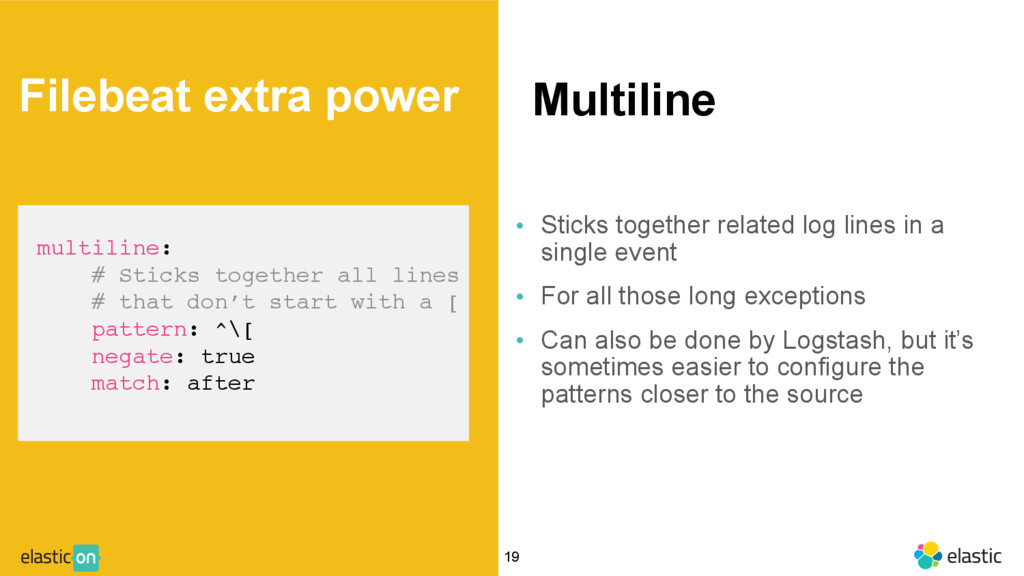
that don’t start with a [ pattern: ^\[ negate: true match: after Filebeat extra power • Sticks together related log lines in a single event • For all those long exceptions • Can also be done by Logstash, but it’s sometimes easier to configure the patterns closer to the source
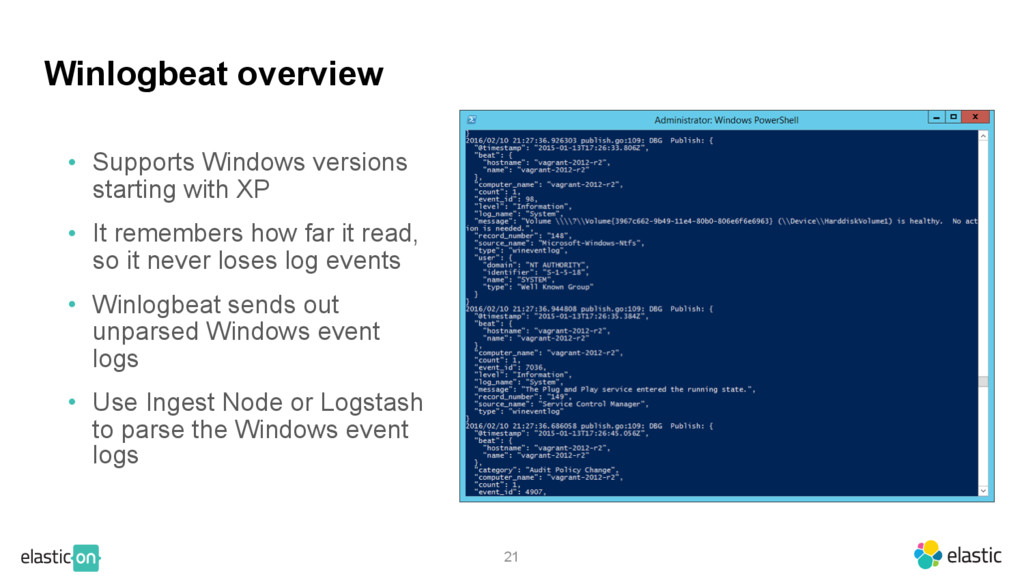
• It remembers how far it read, so it never loses log events • Winlogbeat sends out unparsed Windows event logs • Use Ingest Node or Logstash to parse the Windows event logs
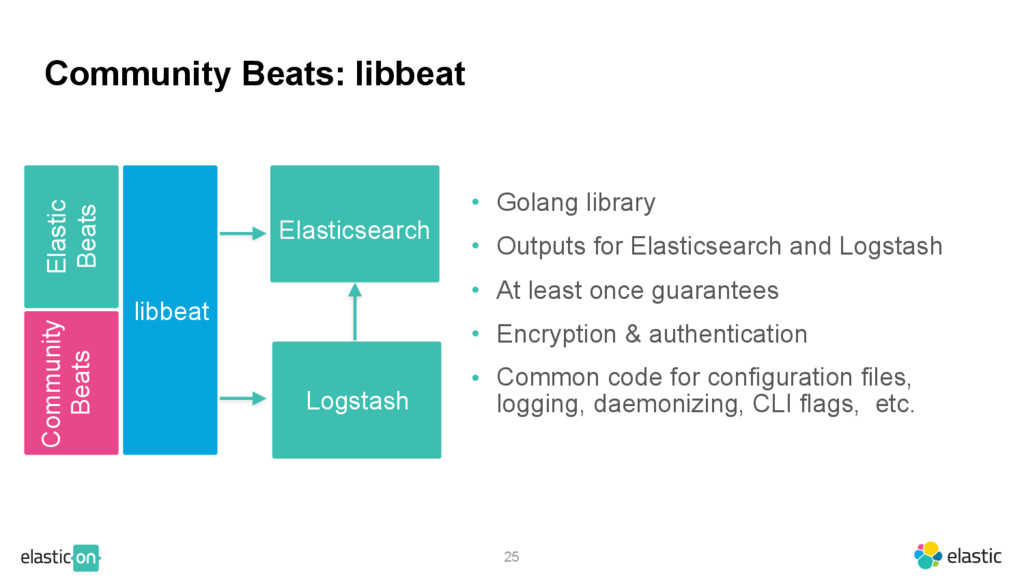
Golang library • Outputs for Elasticsearch and Logstash • At least once guarantees • Encryption & authentication • Common code for configuration files, logging, daemonizing, CLI flags, etc. Elasticsearch Logstash
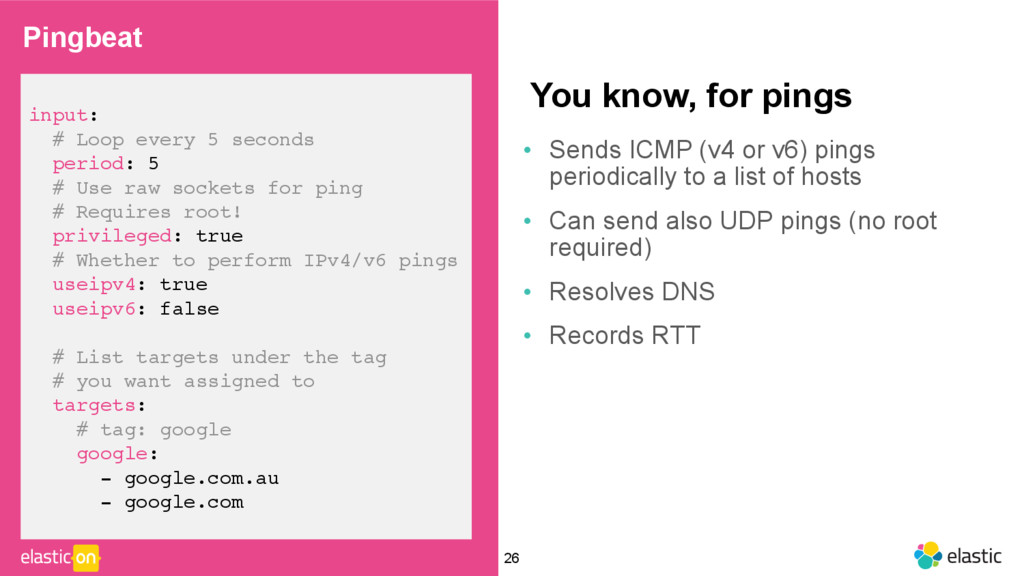
# Use raw sockets for ping # Requires root! privileged: true # Whether to perform IPv4/v6 pings useipv4: true useipv6: false # List targets under the tag # you want assigned to targets: # tag: google google: - google.com.au - google.com You know, for pings • Sends ICMP (v4 or v6) pings periodically to a list of hosts • Can send also UDP pings (no root required) • Resolves DNS • Records RTT Pingbeat
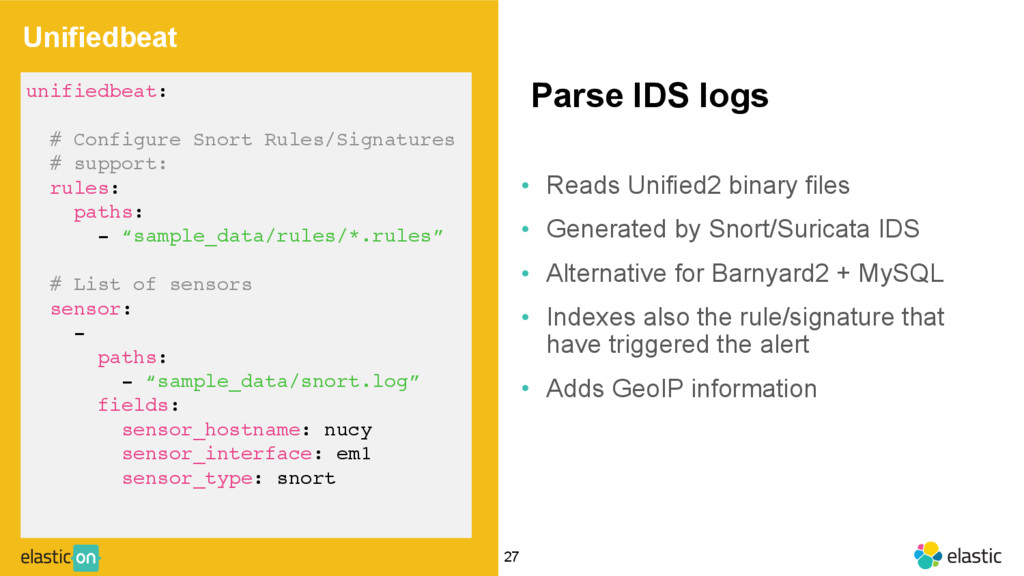
files • Generated by Snort/Suricata IDS • Alternative for Barnyard2 + MySQL • Indexes also the rule/signature that have triggered the alert • Adds GeoIP information unifiedbeat: # Configure Snort Rules/Signatures # support: rules: paths: - “sample_data/rules/*.rules” # List of sensors sensor: - paths: - “sample_data/snort.log” fields: sensor_hostname: nucy sensor_interface: em1 sensor_type: snort
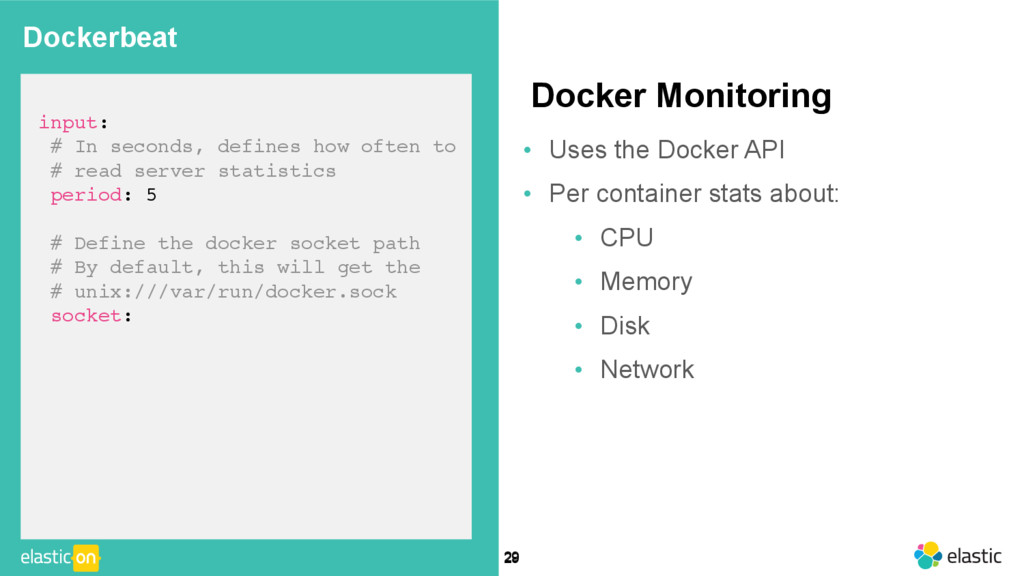
Per container stats about: • CPU • Memory • Disk • Network Dockerbeat input: # In seconds, defines how often to # read server statistics period: 5 # Define the docker socket path # By default, this will get the # unix:///var/run/docker.sock socket: 29
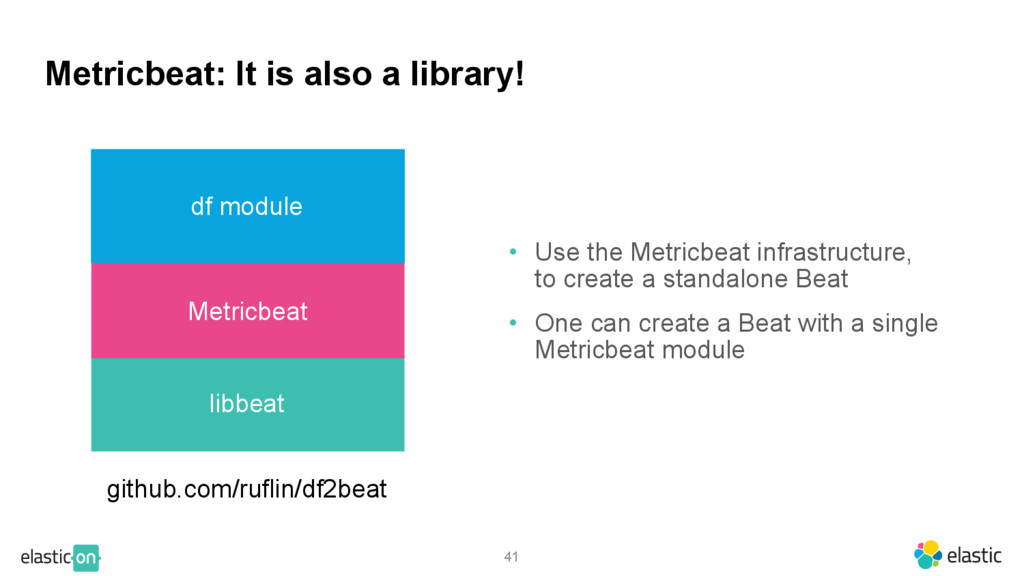
Metricbeat infrastructure, to create a standalone Beat • One can create a Beat with a single Metricbeat module libbeat Metricbeat df module github.com/ruflin/df2beat
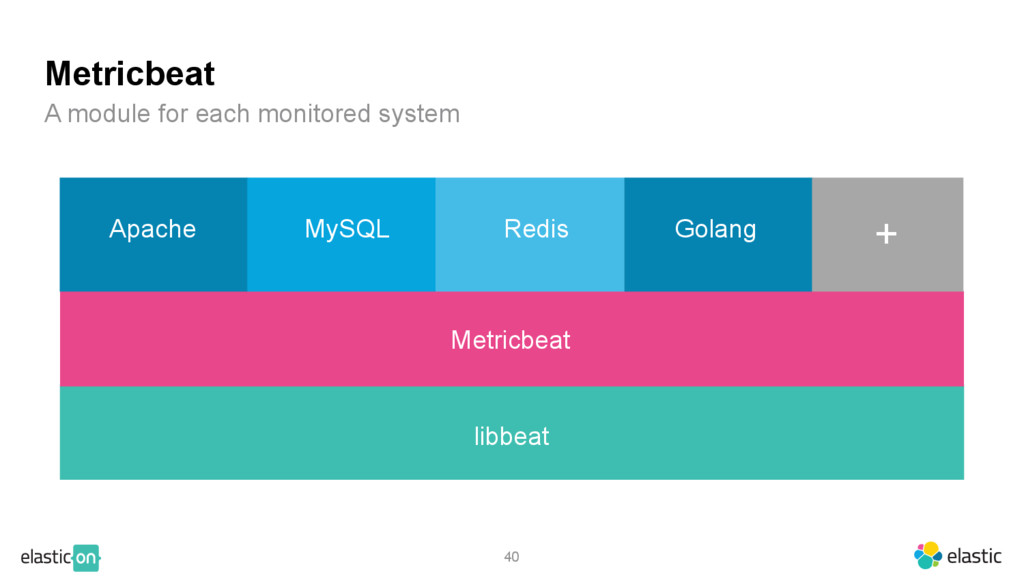
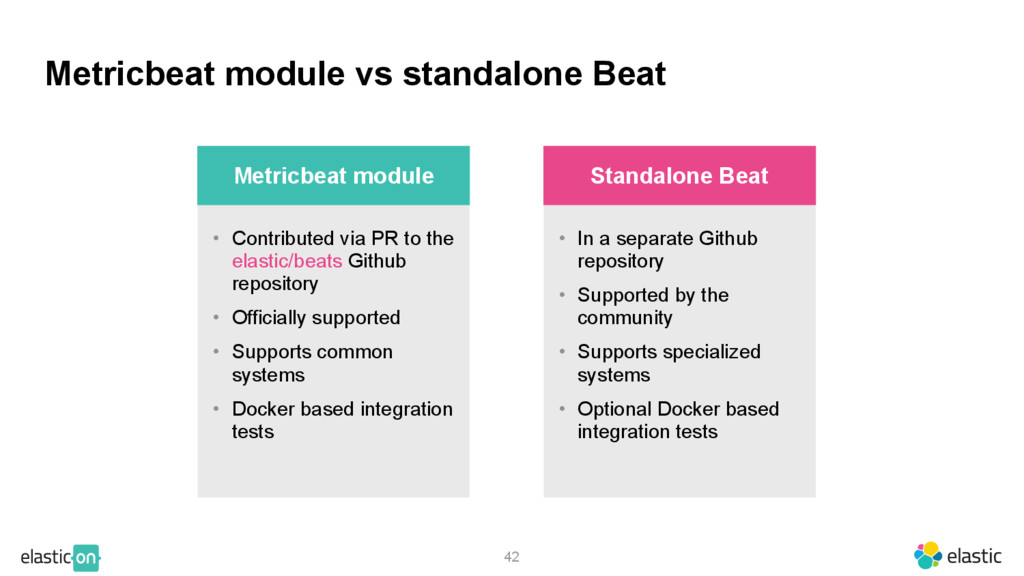
to the elastic/beats Github repository • Officially supported • Supports common systems • Docker based integration tests Metricbeat module • In a separate Github repository • Supported by the community • Supports specialized systems • Optional Docker based integration tests Standalone Beat
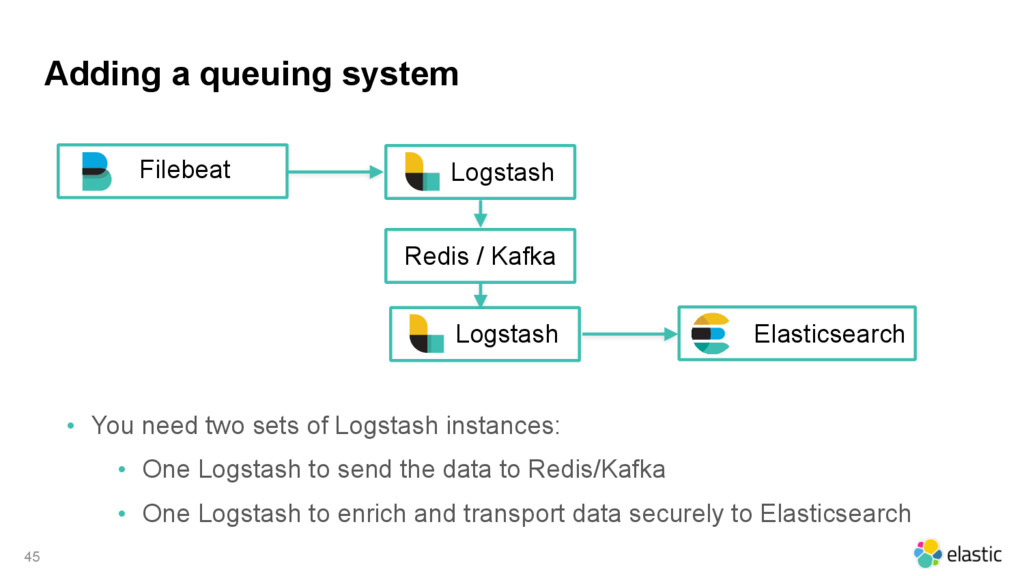
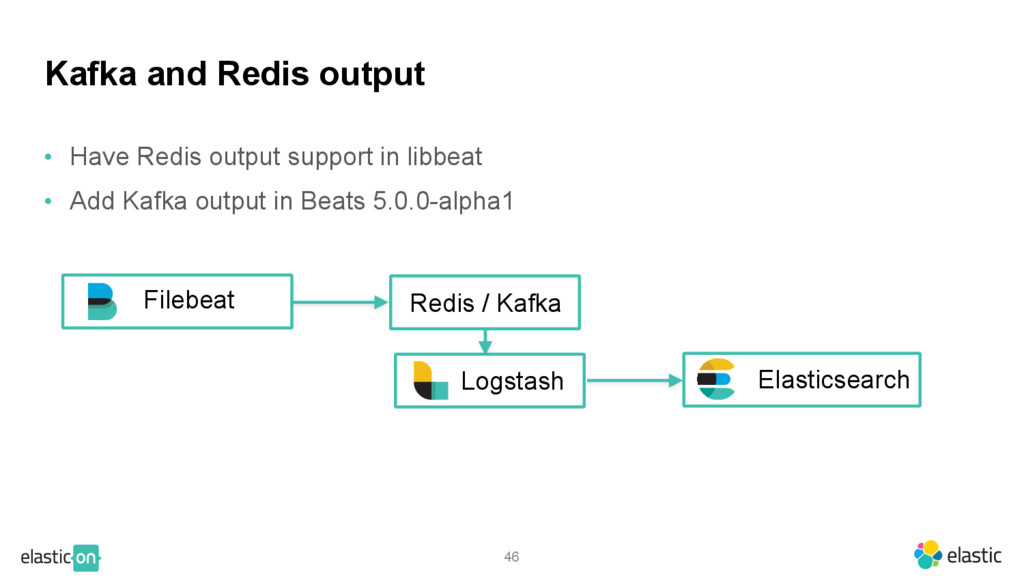
/ Kafka • You need two sets of Logstash instances: • One Logstash to send the data to Redis/Kafka • One Logstash to enrich and transport data securely to Elasticsearch
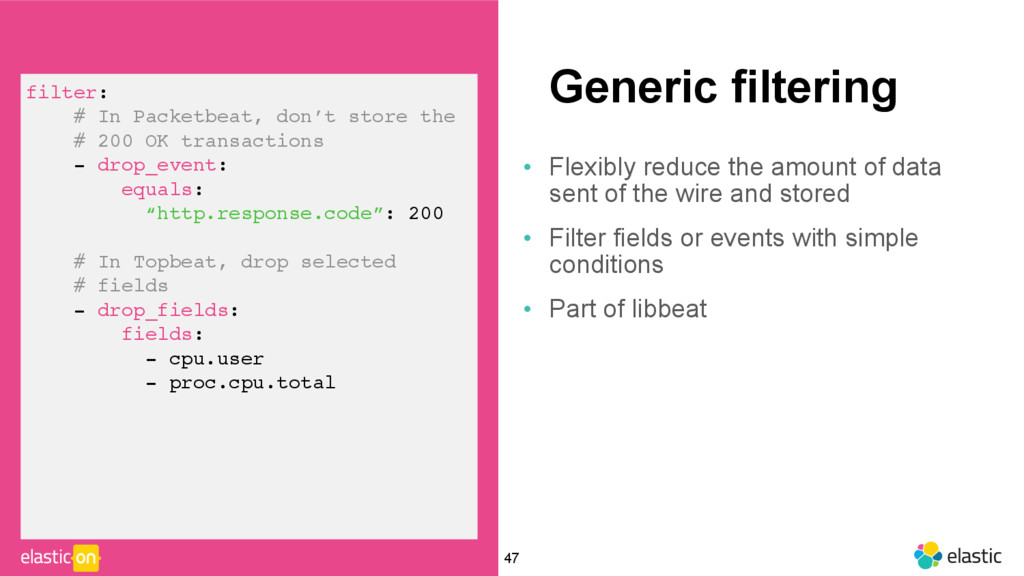
the # 200 OK transactions - drop_event: equals: “http.response.code”: 200 # In Topbeat, drop selected # fields - drop_fields: fields: - cpu.user - proc.cpu.total • Flexibly reduce the amount of data sent of the wire and stored • Filter fields or events with simple conditions • Part of libbeat
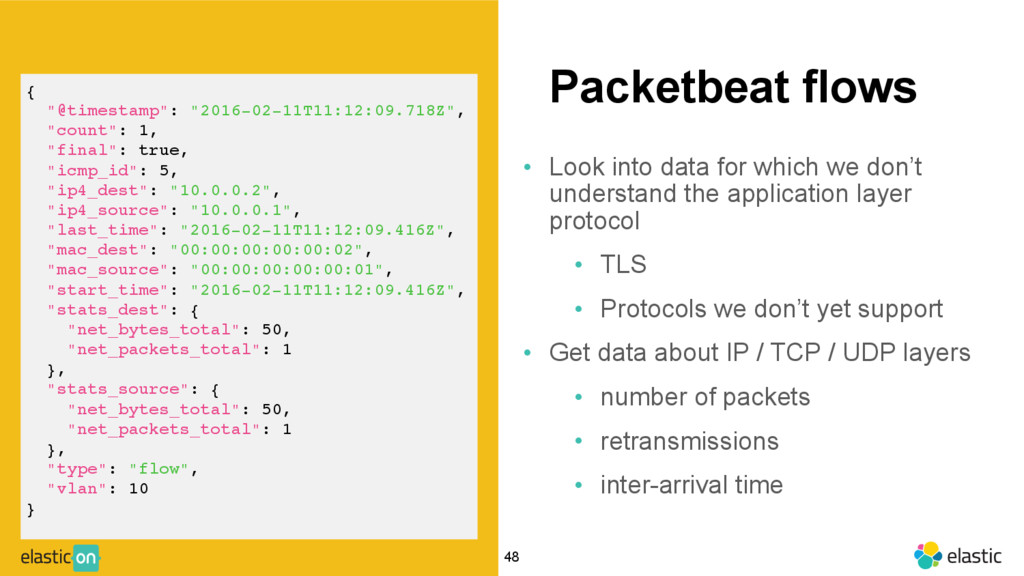
true, "icmp_id": 5, "ip4_dest": "10.0.0.2", "ip4_source": "10.0.0.1", "last_time": "2016-02-11T11:12:09.416Z", "mac_dest": "00:00:00:00:00:02", "mac_source": "00:00:00:00:00:01", "start_time": "2016-02-11T11:12:09.416Z", "stats_dest": { "net_bytes_total": 50, "net_packets_total": 1 }, "stats_source": { "net_bytes_total": 50, "net_packets_total": 1 }, "type": "flow", "vlan": 10 } • Look into data for which we don’t understand the application layer protocol • TLS • Protocols we don’t yet support • Get data about IP / TCP / UDP layers • number of packets • retransmissions • inter-arrival time
where otherwise noted, this work is licensed under http://creativecommons.org/licenses/by-nd/4.0/ Creative Commons and the double C in a circle are registered trademarks of Creative Commons in the United States and other countries. Third party marks and brands are the property of their respective holders. 50