Upgrade to Pro — share decks privately, control downloads, hide ads and more …

What's Brewing in Beats?

Elastic Co
March 07, 2017

What's Brewing in Beats?

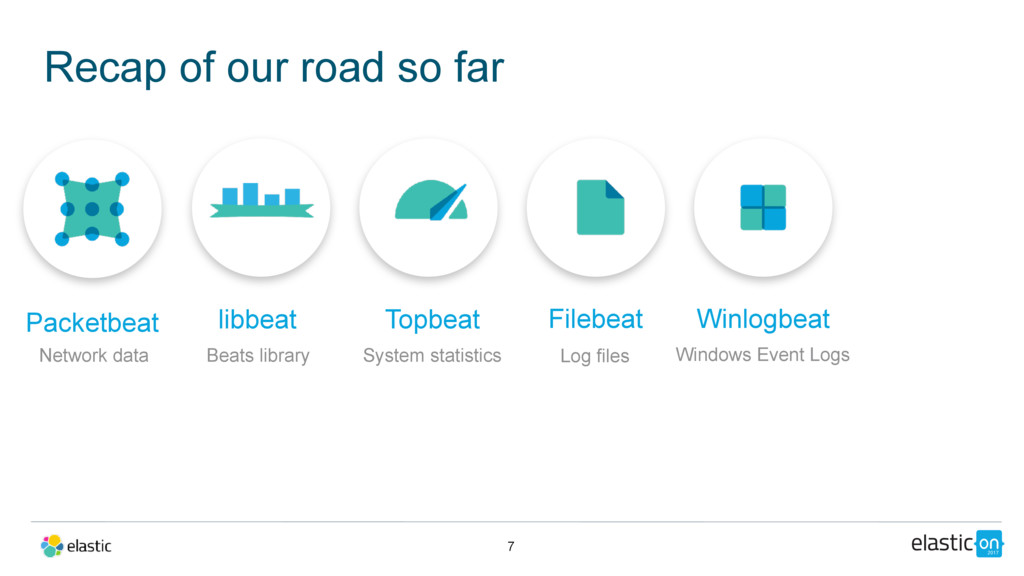
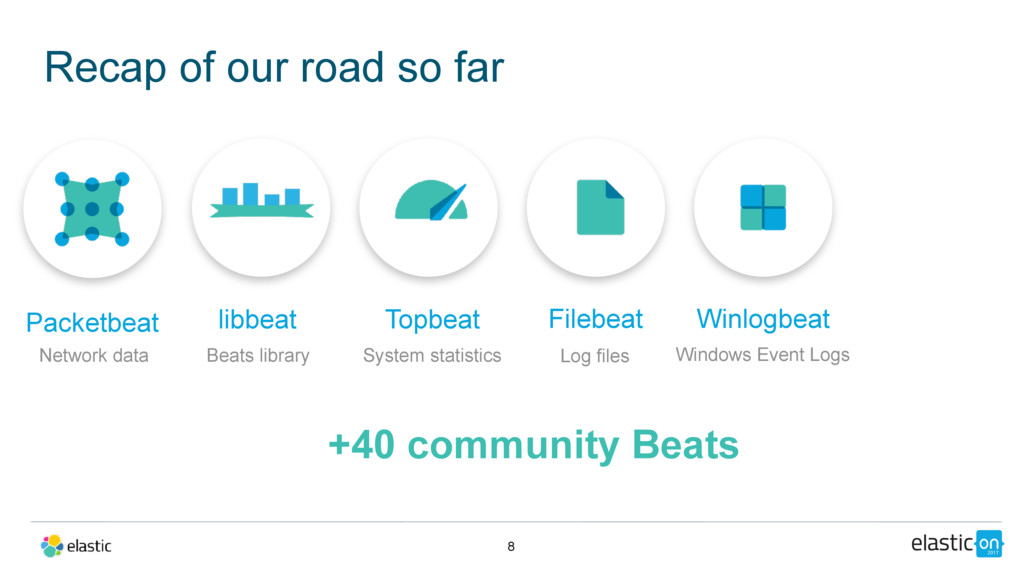
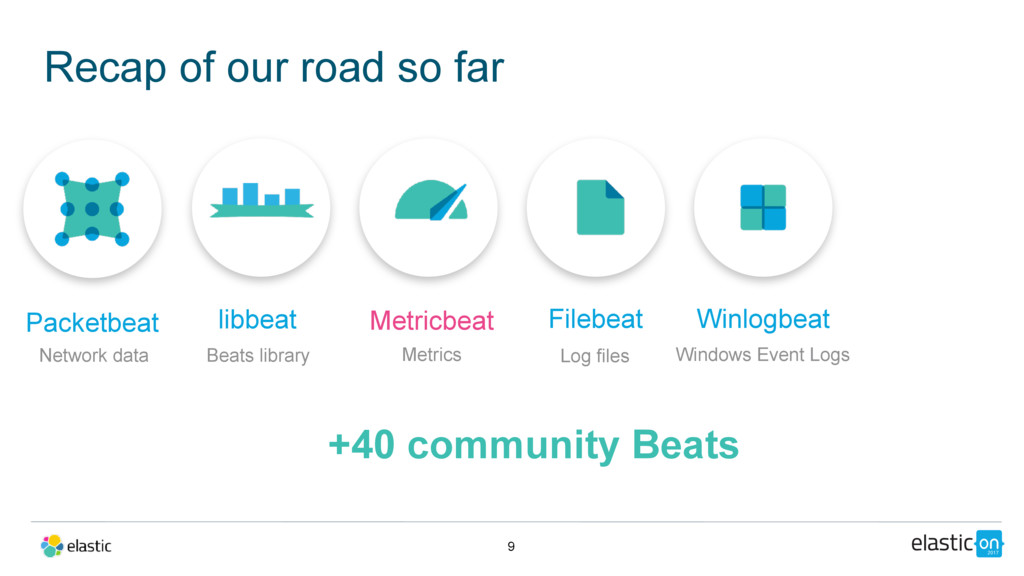
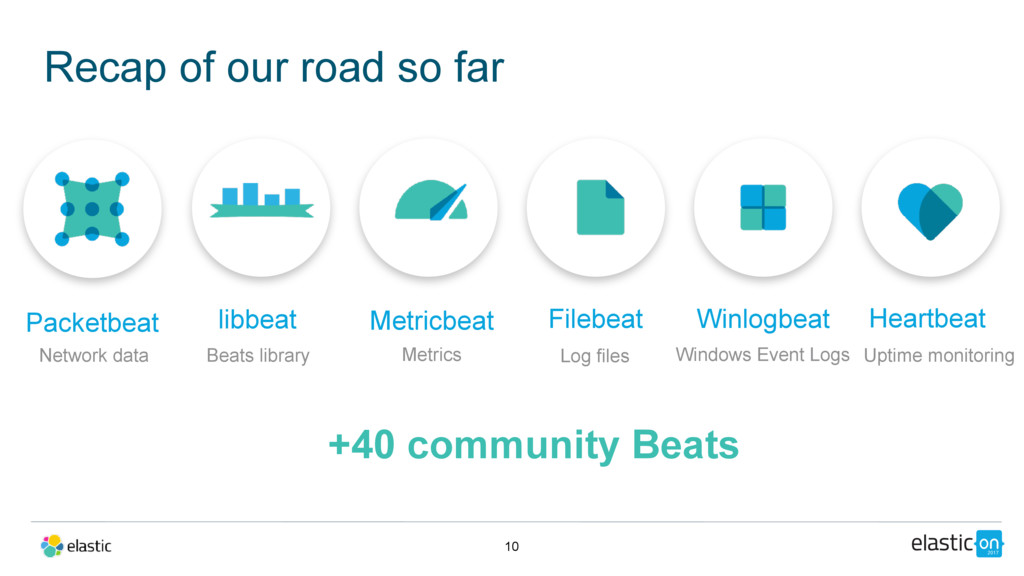
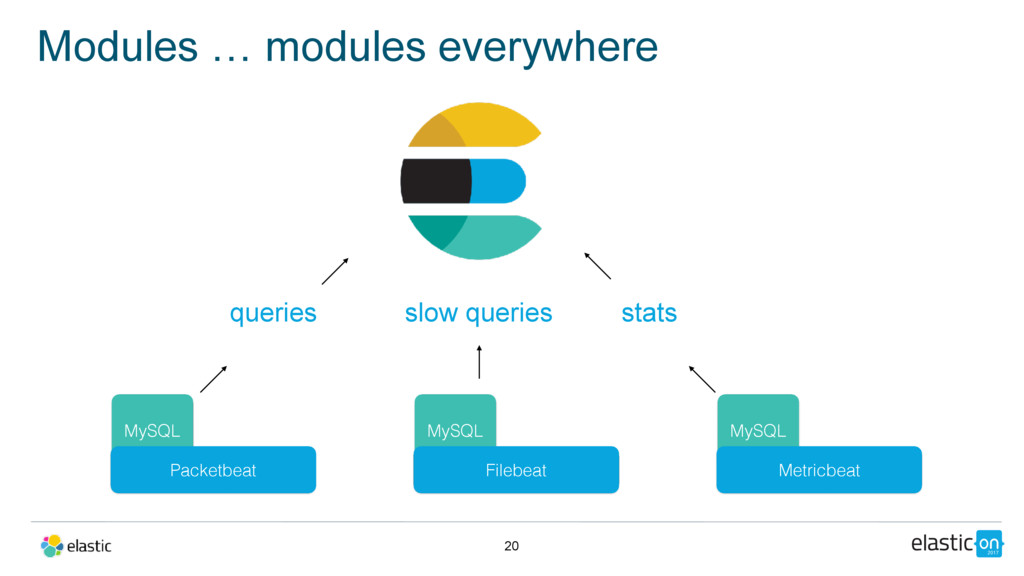
Beats are a family of lightweight shippers that send data from edge machines to Elasticsearch. They started with a single Beat – Packetbeat – for network data, and have since expanded to four additional Elastic Beats for log files, metrics, windows event logs, and availability monitoring, and more than 30 community-created Beats for all kinds of operational data.

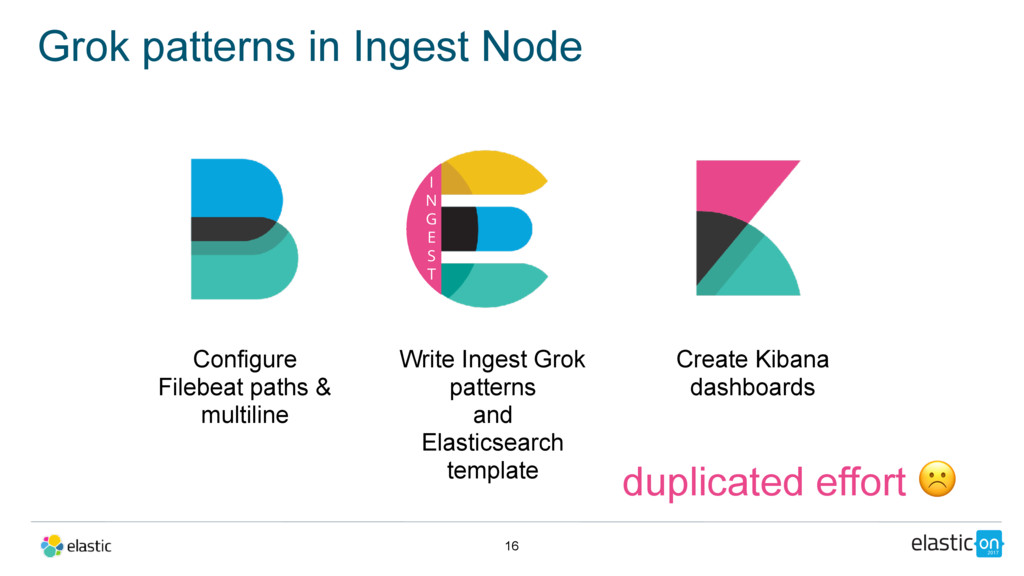
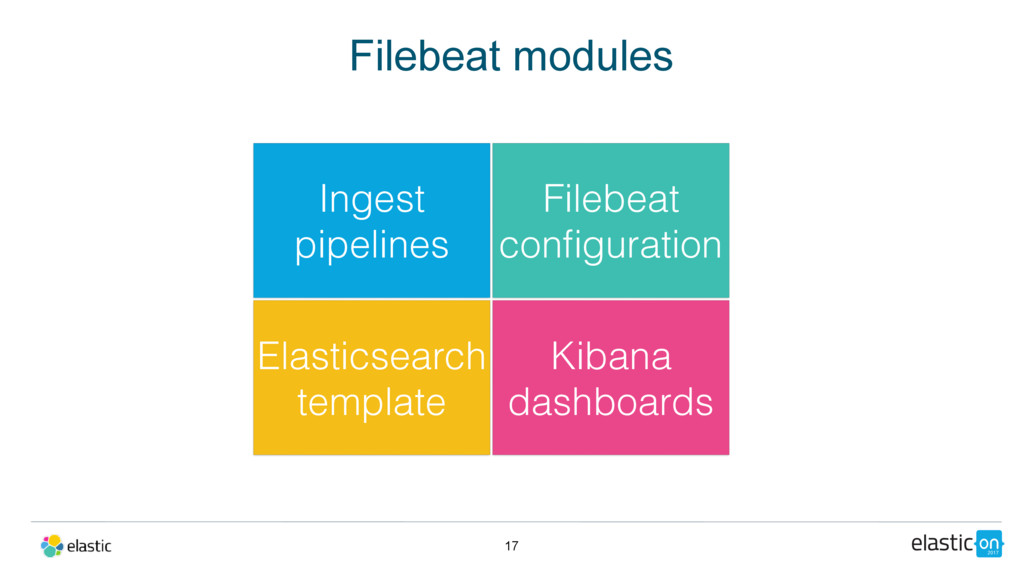
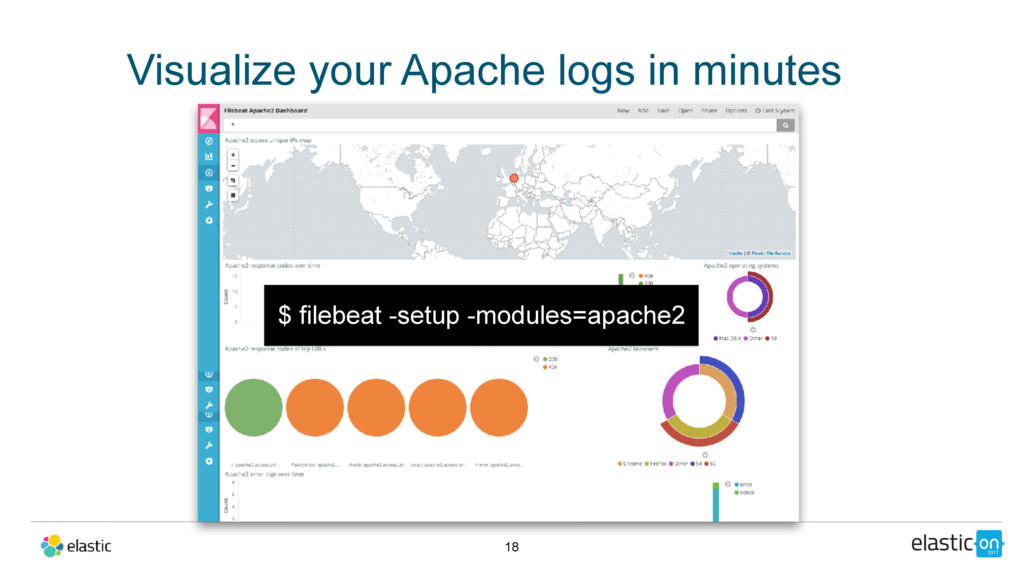
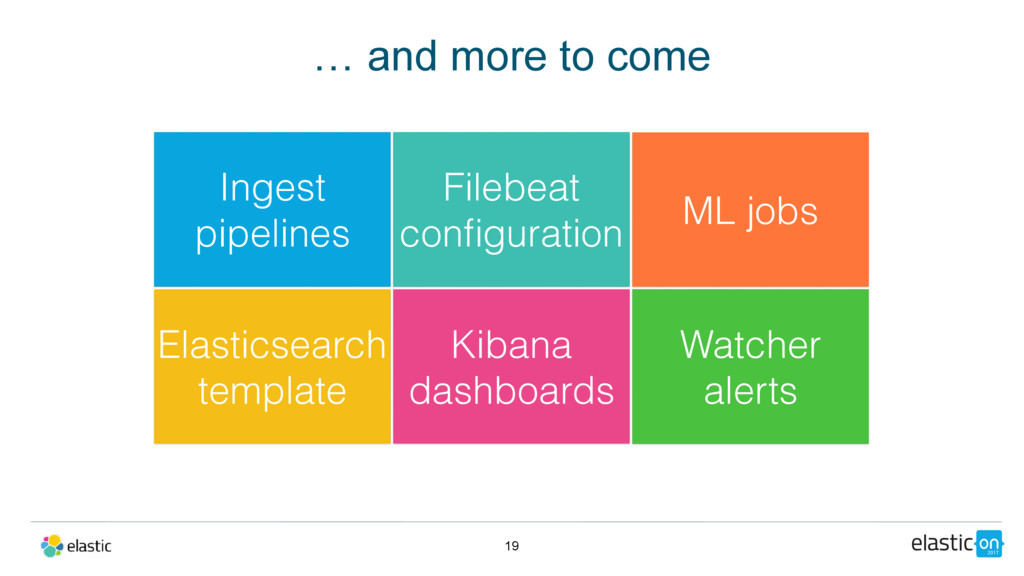
In this session, Monica and Tudor will walk you through the latest Beats and their features. You will learn about the new Filebeat modules, which simplify the collection and parsing of common log files down to a single command. You will also see Heartbeat in action, our newest Beat responsible for uptime monitoring.

Tudor Golubenco l Beats Creator & Tech Lead l Elastic
Monica Sarbu l Beats Creator & Team Lead l Elastic

Elastic Co

March 07, 2017
Tweet

More Decks by Elastic Co

Other Decks in Technology

Transcript

  1. Recap of our road so far 5 Packetbeat Network data

    libbeat Beats library Topbeat System statistics
  2. Recap of our road so far 6 Packetbeat Network data

    libbeat Beats library Filebeat Log files Topbeat System statistics
  3. Recap of our road so far 7 Packetbeat Network data

    libbeat Beats library Filebeat Log files Winlogbeat Windows Event Logs Topbeat System statistics
  4. Recap of our road so far 8 Packetbeat Network data

    libbeat Beats library Filebeat Log files Winlogbeat Windows Event Logs Topbeat System statistics +40 community Beats
  5. Recap of our road so far 9 Packetbeat Network data

    libbeat Beats library Filebeat Log files Winlogbeat Windows Event Logs +40 community Beats Metricbeat Metrics
  6. Recap of our road so far 10 Packetbeat Network data

    libbeat Beats library Filebeat Log files Winlogbeat Windows Event Logs Heartbeat Uptime monitoring +40 community Beats Metricbeat Metrics
  7. What about logs? 13 Configure Filebeat paths & multiline Tune

    the Elasticsearch template Write Logstash Grok patterns Create Kibana dashboards
  8. What about logs? 14 Configure Filebeat paths & multiline Tune

    the Elasticsearch template Write Logstash Grok patterns Create Kibana dashboards very powerful, but complex ☹
  9. Grok patterns in Ingest Node 15 Create Kibana dashboards Write

    Ingest Grok patterns and Elasticsearch template I N G E S T Configure Filebeat paths & multiline
  10. Grok patterns in Ingest Node 16 Create Kibana dashboards Write

    Ingest Grok patterns and Elasticsearch template I N G E S T Configure Filebeat paths & multiline duplicated effort ☹
  11. … and more to come 19 Filebeat configuration Ingest pipelines

    Elasticsearch template Kibana dashboards ML jobs Watcher alerts
  12. Metricbeat modules 23 MySQL Memcache PHP-FPM CEPH Zoo keeper Golang

    Docker Apache Kafka HAProxy System Redis Couchbase NGINX Postgres Prometheus Jolokia
  13. Heartbeat - Ping all the things 36 host Your app

    OS TCP/TLS connect ICMP ping HTTP/S request
  14. • Round Trip Times: • resolve • icmp • tcp_connect

    • socks5_connect • tls_handshake • http Heartbeat metrics 37
  15. Because the Beats also need a bit of monitoring love

    Central monitoring for Beats 41 production monitoring forwards monitoring data Specialized monitoring UI
  16. 51 Andrew Monitoring Docker with Metricbeat Wednesday, 4:40 pm Spotlight

    Theater Be there to learn how to monitor your containers with Beats
  17. 52 Nicolas & Steffen Ship Your Own Data: Tailoring Beats

    to Your Use Case Thursday, 11am Stage B Be there to learn how to extend Beats
  18. 53 Chris BoF: Kibana Visualizations Wednesday, 1:15 pm Spotlight Theater

    Demo Time series visualization builder in the Birds of a Feather session