Upgrade to Pro
— share decks privately, control downloads, hide ads and more …
Speaker Deck
Features
Speaker Deck
PRO
Sign in
Sign up for free
Search
Search
Profiling for JVM (beta)
Search
Kengo TODA
October 06, 2012
Technology
99
1
Share
Embed
Copy iframe code
Copy JS code
Copy link
Start on current slide
Profiling for JVM (beta)
What is profiling? Why we need it? This slide tells you the reason.
Kengo TODA
October 06, 2012
More Decks by Kengo TODA
See All by Kengo TODA
Kotlin 開発のツラミを爆破した話! / Explode the difficulty of Kotlin dev!
eller86
0
160
生成AI 業務応用向けガイドライン 斜め読み / Overview of Generative AI Business Application Guidelines
eller86
0
200
KotlinユーザのためのJSpecify入門 / JSpecify 101 for Kotlin Devs
eller86
0
2k
JavaとGroovyで書かれたGradleプラグインをKotlinで書き直した話 / Converted a Gradle plugin from Groovy&Java to Kotlin
eller86
0
1.9k
ヒューマンスキル / The Humanskills
eller86
0
770
医療機関向けシステムの信頼性 / Reliability of systems for medical institutions
eller86
0
530
Server-side Kotlinを使うスタートアップでどんなDetektルールが育ったか / Detekt rules made in start-up working with Server-side Kotlin
eller86
0
1.7k
Java開発者向けのKotlin Gradleビルドスクリプト入門 / Gradle Build Script in Kotlin 101
eller86
1
2.2k
Goodbye JSR305, Hello JSpecify!
eller86
2
5.6k
Other Decks in Technology
See All in Technology
Text-to-SQLをAgentCoreで実現し、生成されるSQLの精度を定量的に評価する
yakumo
2
780
Zoom2Youtube.Claude
kawaguti
PRO
3
490
ローカルLLMとLINE Botの組み合わせ その3 / LINE DC Generative AI Meetup #8
you
PRO
0
130
AWS Blocks を触ってみた/first-tach-aws-blocks
fossamagna
2
150
知らん間に、回ってる
ming_ayami
0
390
SRE依存からの脱却 運用を開 発チームへ移す、 フルサイ クル開 発体制の実践
joooee0000
0
2.5k
小さいから、全部わかる。— 常駐AI "xangi" のすすめ
sugupoko
0
290
環境凍結という Toil を倒す -セルフサービス型 Ephemeral テスト環境の 設計と実践
shirouz
1
2.1k
なぜ人は自分のプロジェクトを 「なんちゃってアジャイル」と 自嘲するのか
kozotaira
0
280
AIに「使われる」時代のSaaS戦略 〜既存WebAPIのMCPサーバー化における開発ノウハウ〜
ekispert_api
0
310
AI駆動開発におけるQAエンジニアの役割事例 〜AI駆動開発の現場から〜
kobayashiyorimitsu
0
470
プロンプト_きのこカンファレンス2026_LT
yurufuwahealer
0
150
Featured
See All Featured
Being A Developer After 40
akosma
91
590k
Groundhog Day: Seeking Process in Gaming for Health
codingconduct
0
240
Breaking role norms: Why Content Design is so much more than writing copy - Taylor Woolridge
uxyall
0
340
Conquering PDFs: document understanding beyond plain text
inesmontani
PRO
4
2.9k
Building Applications with DynamoDB
mza
96
7.1k
GraphQLの誤解/rethinking-graphql
sonatard
75
12k
Automating Front-end Workflow
addyosmani
1370
210k
How to Talk to Developers About Accessibility
jct
2
300
Side Projects
sachag
455
43k
A brief & incomplete history of UX Design for the World Wide Web: 1989–2019
jct
2
420
Building a A Zero-Code AI SEO Workflow
portentint
PRO
0
630
職位にかかわらず全員がリーダーシップを発揮するチーム作り / Building a team where everyone can demonstrate leadership regardless of position
madoxten
63
55k
Transcript
PROFILING FOR JVM How to verify your hypothesis - @eller86
Agenda Process to detect the cause of performance problem What
is “profiling”? Tools to profile
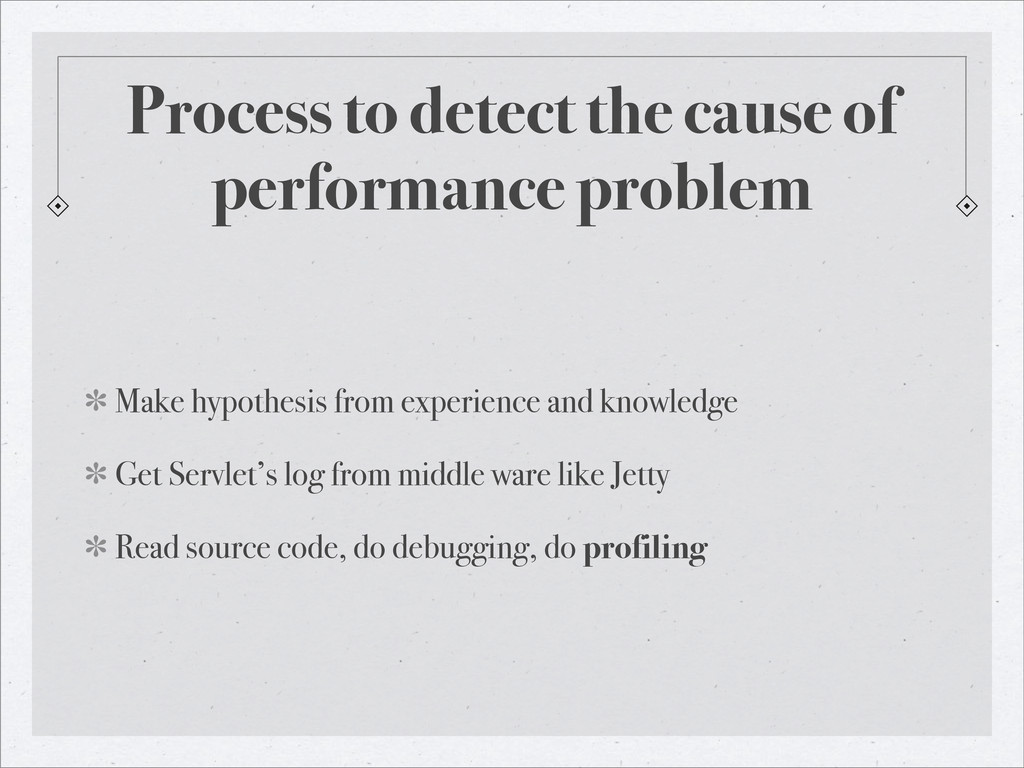
Process to detect the cause of performance problem Make hypothesis
from experience and knowledge Get Servlet’s log from middle ware like Jetty Read source code, do debugging, do profiling
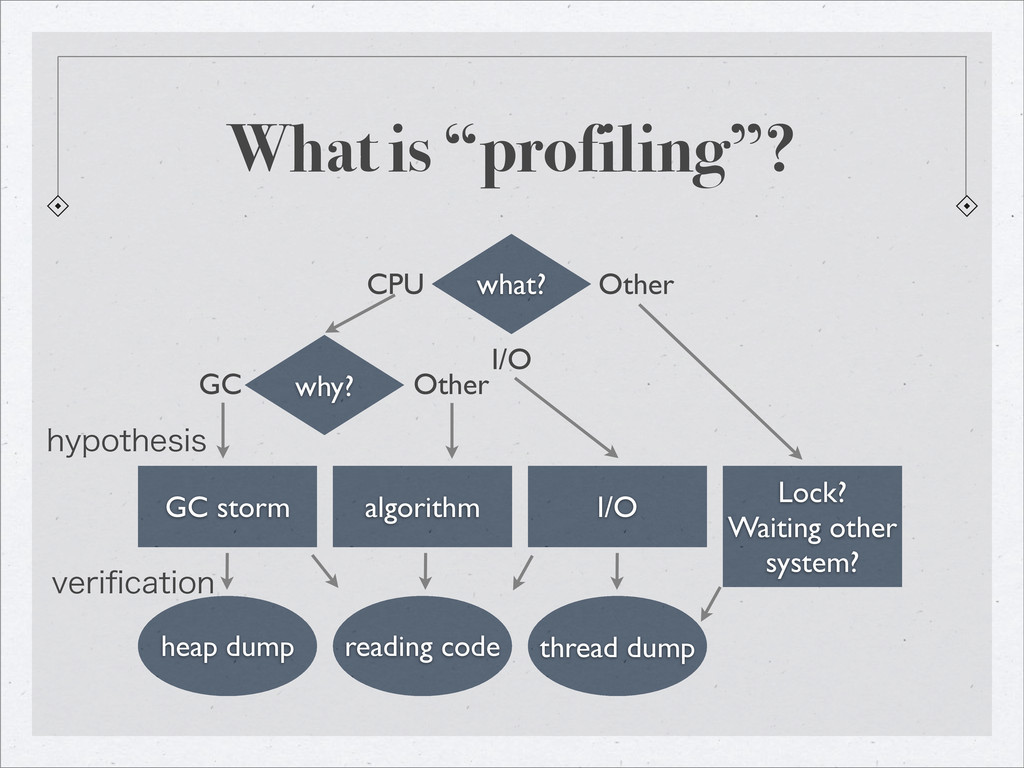
What is “profiling”? what? why? GC storm algorithm CPU Other
reading code heap dump I/O Lock? Waiting other system? I/O GC Other thread dump IZQPUIFTJT WFSJpDBUJPO
Tools to profile jmap jstack jstat VisualVM
Taking heap dump $ jmap -dump:format=b,file=dump.dat [PID]
Taking thread dump $ jstack -l [PID] > thread-dump.txt
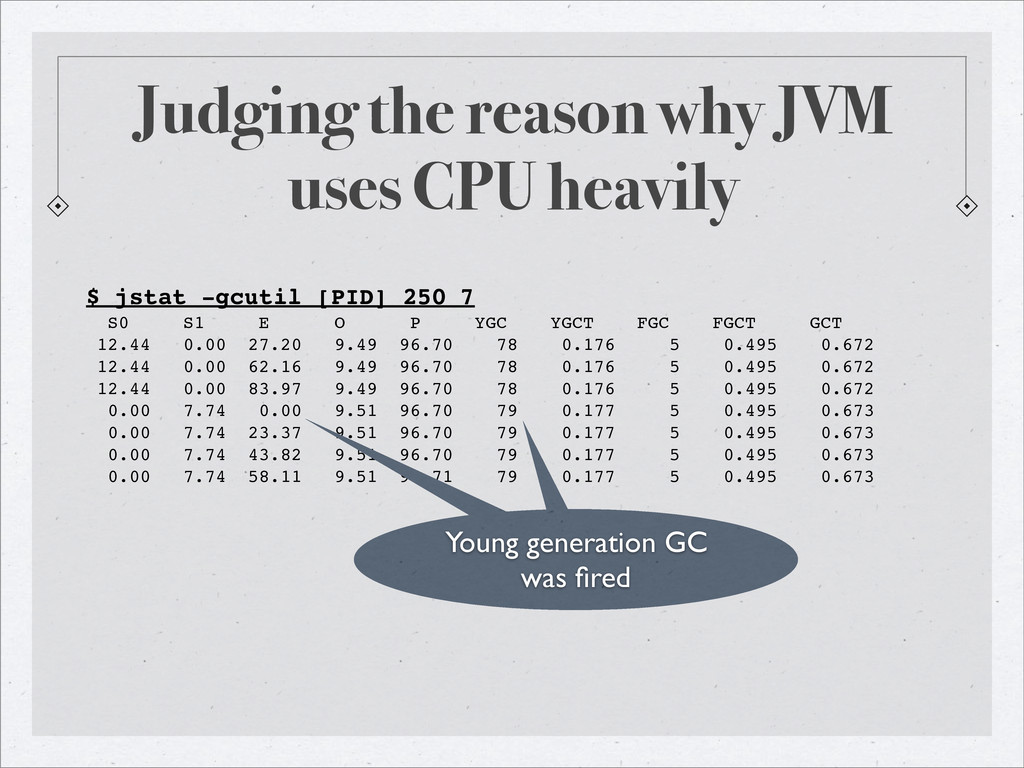
Judging the reason why JVM uses CPU heavily $ jstat
-gcutil [PID] 250 7 S0 S1 E O P YGC YGCT FGC FGCT GCT 12.44 0.00 27.20 9.49 96.70 78 0.176 5 0.495 0.672 12.44 0.00 62.16 9.49 96.70 78 0.176 5 0.495 0.672 12.44 0.00 83.97 9.49 96.70 78 0.176 5 0.495 0.672 0.00 7.74 0.00 9.51 96.70 79 0.177 5 0.495 0.673 0.00 7.74 23.37 9.51 96.70 79 0.177 5 0.495 0.673 0.00 7.74 43.82 9.51 96.70 79 0.177 5 0.495 0.673 0.00 7.74 58.11 9.51 96.71 79 0.177 5 0.495 0.673 GC was fired Young generation GC was fired
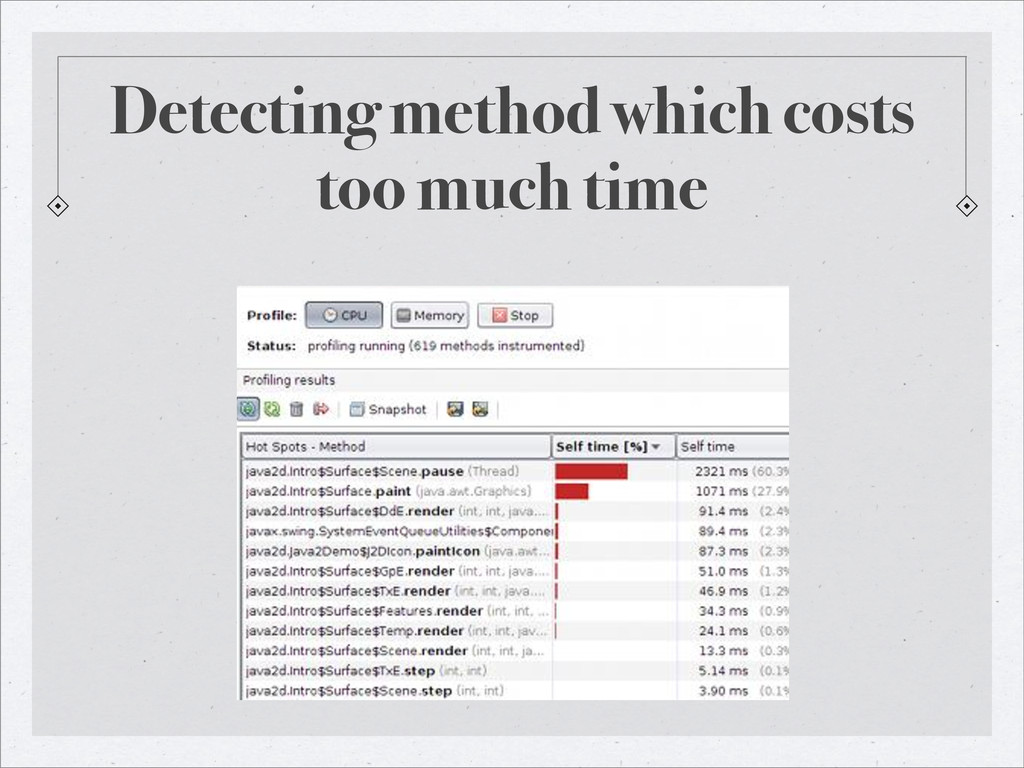
Detecting method which costs too much time
Key point Hypothesis needs verification Know “normal” performance to detect
“abnormal” one
Reference JDK tools and utilities Browsing heap dump VisualVM Diagnosis
documentation @ developerWorks My gist about JVM profiling
![Taking heap dump $ jmap -dump:format=b,file=dump.dat [PID]](https://files.speakerdeck.com/presentations/5070106cdbcbfb000207810d/slide_5.jpg)
![Taking thread dump $ jstack -l [PID] > thread-dump.txt](https://files.speakerdeck.com/presentations/5070106cdbcbfb000207810d/slide_6.jpg)