Upgrade to Pro — share decks privately, control downloads, hide ads and more …

Best Practices for Prototyping ML Models for He...

Best Practices for Prototyping ML Models for Healthcare

Medical institutions, universities and software giants like Google and Microsoft are dedicating increasing resources to machine learning for healthcare. This is a very exciting but relatively young field. However, best practices for methods and reporting of results are not yet fully established. I have 2.5 years of experience as data scientist at a national cancer center working on clinical data, evaluating external vendors and peer reviewing machine learning in healthcare papers. The talk gives an overview of best practices in prototyping machine learning models on data from the patient electronic health record (EHR). The topics addressed are: 1. Introduction to the EHR 2. Overview of machine learning applications to the EHR 3. Cohort definition for survival problems 4. Data cleaning 5. Performance metrics. Excerpts of papers from renowned institutions will be critically reviewed. The material is intended to be useful not only to machine learning for healthcare professionals, but to practitioners dealing with very unbalanced datasets in the temporal domain. For example, customer churn prediction can be modeled as survival problem.

Avatar for Lorenzo A. Rossi

Lorenzo A. Rossi

August 17, 2019

More Decks by Lorenzo A. Rossi

Other Decks in Technology

Transcript

  1. Lorenzo Rossi, PhD Data Scientist City of Hope National Medical

    Center DataCon LA, August 2019 Best Practices for Prototyping Machine Learning Models for Healthcare
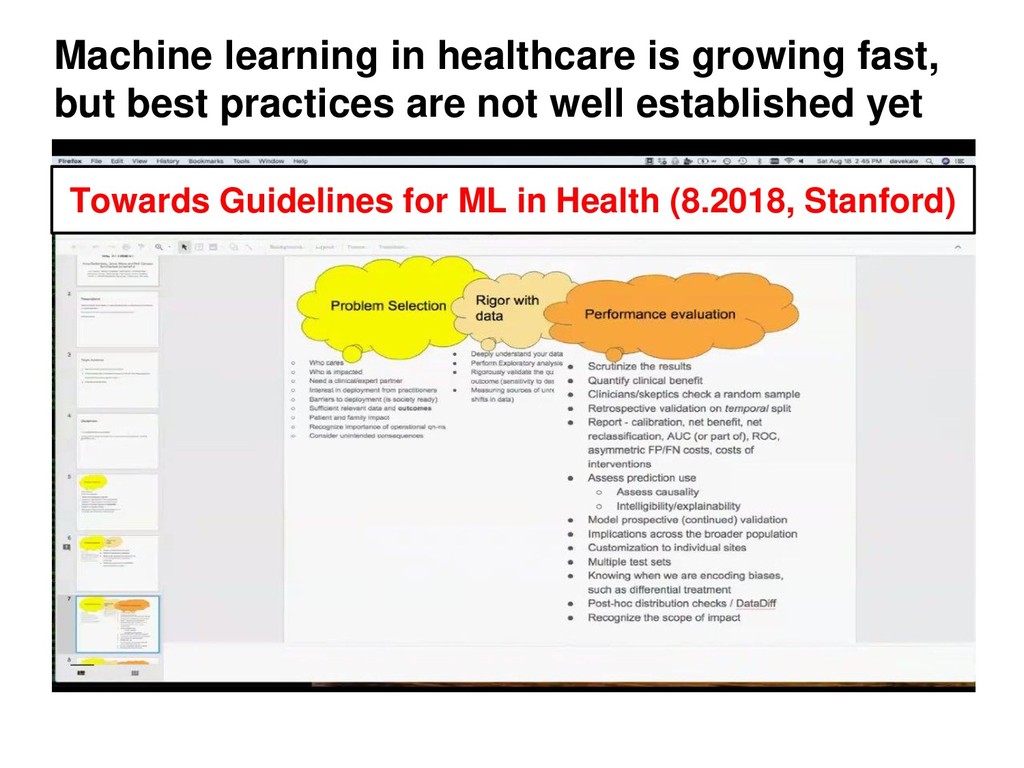
  2. Machine learning in healthcare is growing fast, but best practices

    are not well established yet Towards Guidelines for ML in Health (8.2018, Stanford)
  3. Motivations for ML in Healthcare 1. Lots of information about

    patients, but not enough time for clinicians to process it 2. Physicians spend too much time typing information about patients during encounters 3. Overwhelming amount of false alerts (e.g. in ICU)
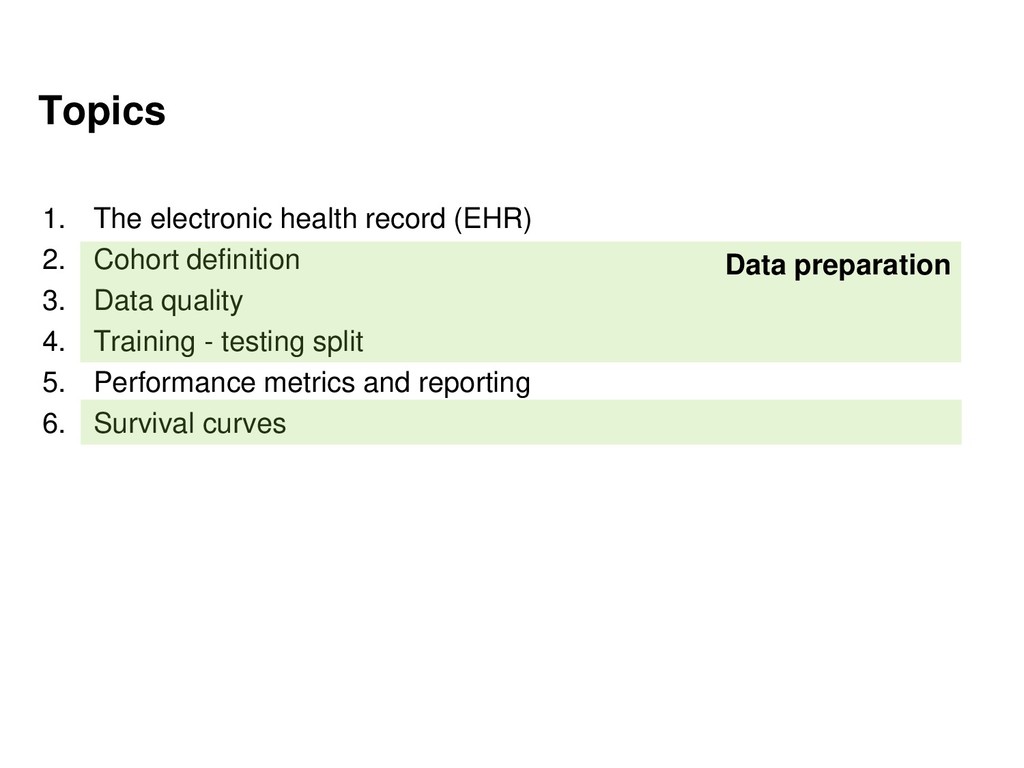
  4. Topics 1. The electronic health record (EHR) 2. Cohort definition

    3. Data quality 4. Training - testing split 5. Performance metrics and reporting 6. Survival analysis
  5. Topics 1. The electronic health record (EHR) 2. Cohort definition

    3. Data quality 4. Training - testing split 5. Performance metrics and reporting 6. Survival curves Data preparation
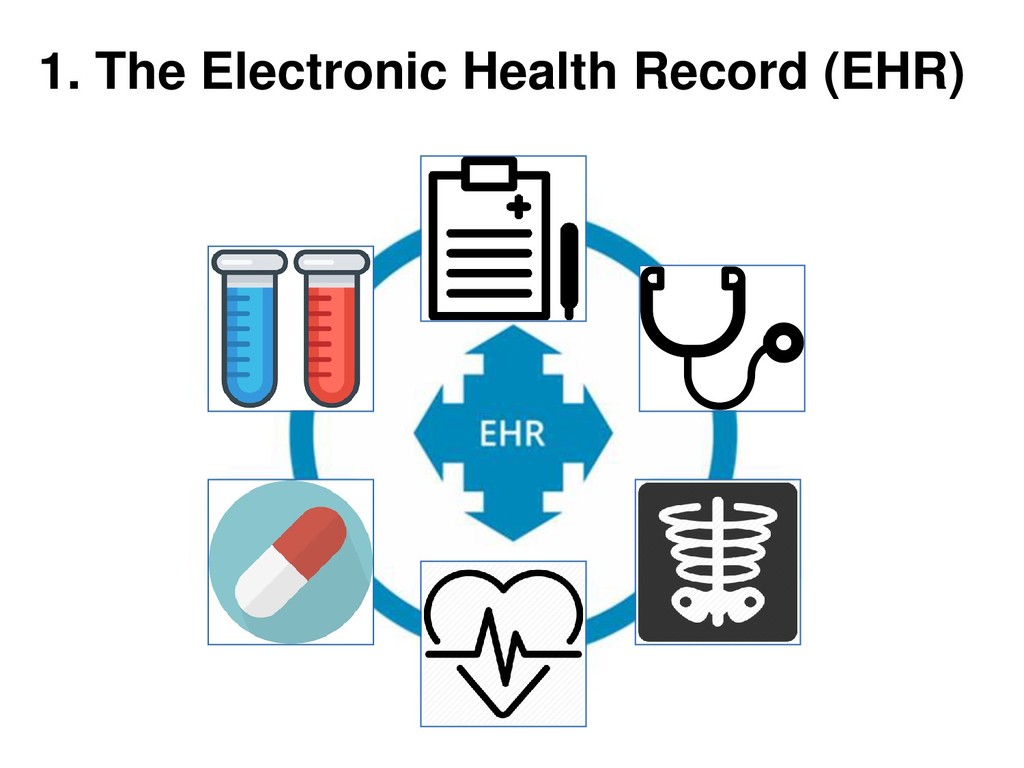
  6. • Laboratory tests • Vitals • Diagnoses • Medications •
    X-rays, CT scans, EKGs, … • Notes EHR data are very heterogeneous
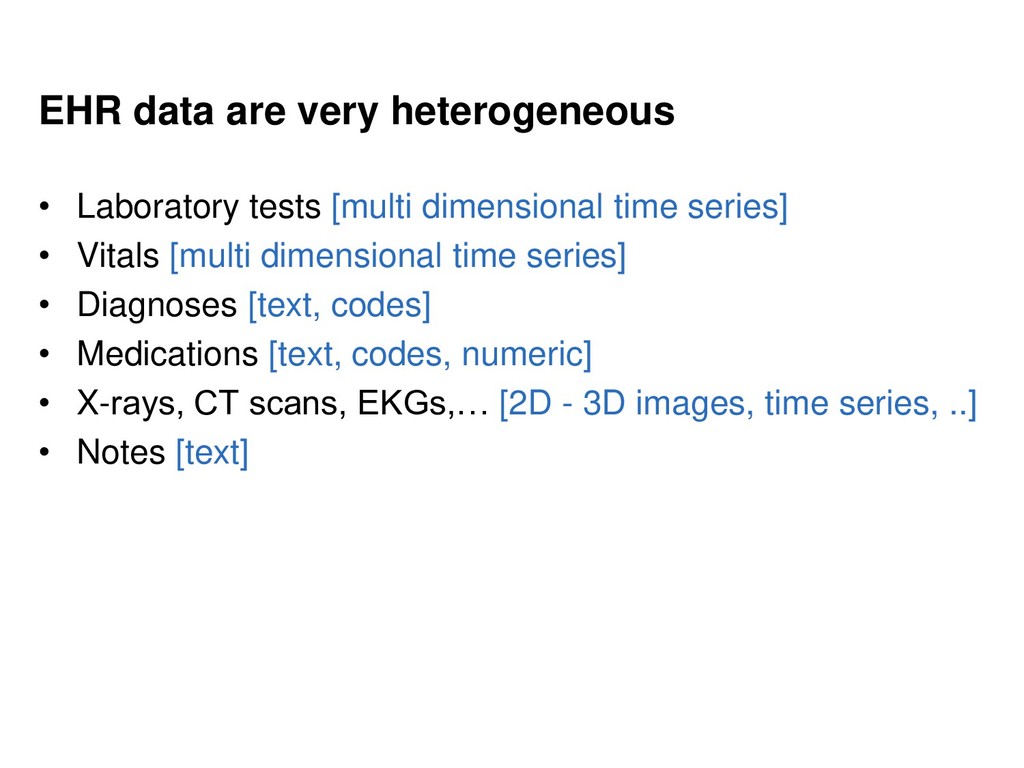
  7. • Laboratory tests [multi dimensional time series] • Vitals [multi

    dimensional time series] • Diagnoses [text, codes] • Medications [text, codes, numeric] • X-rays, CT scans, EKGs,… [2D - 3D images, time series, ..] • Notes [text] EHR data are very heterogeneous
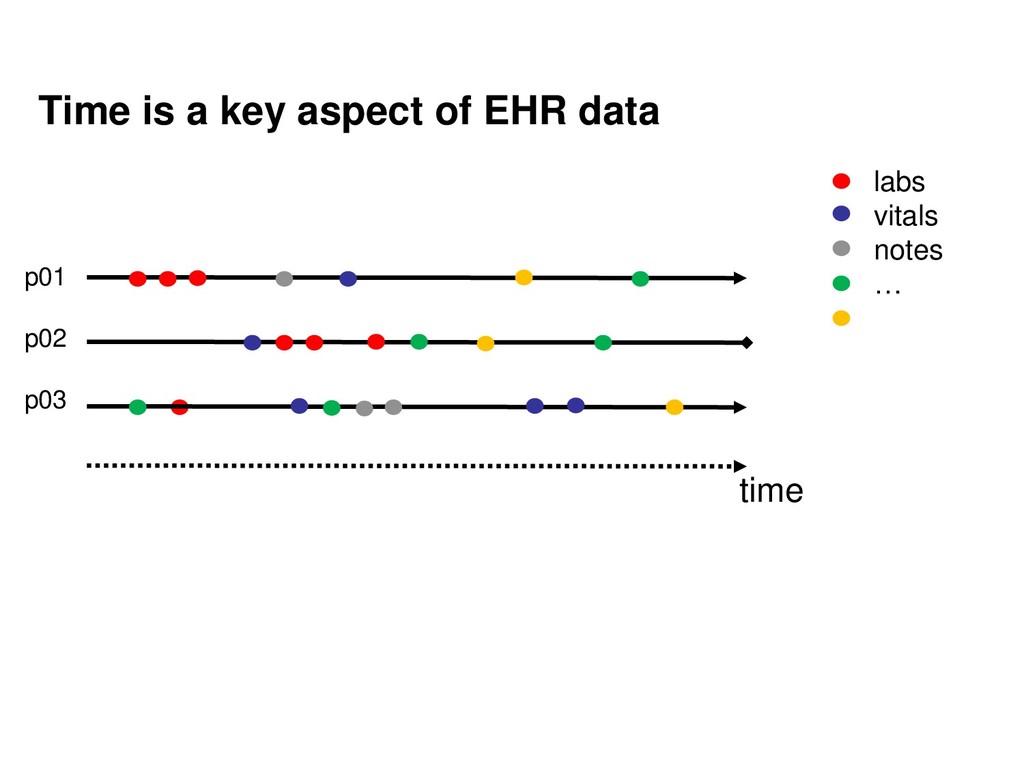
  8. • labs • vitals • notes • … Time is

    a key aspect of EHR data p01 p02 p03 time
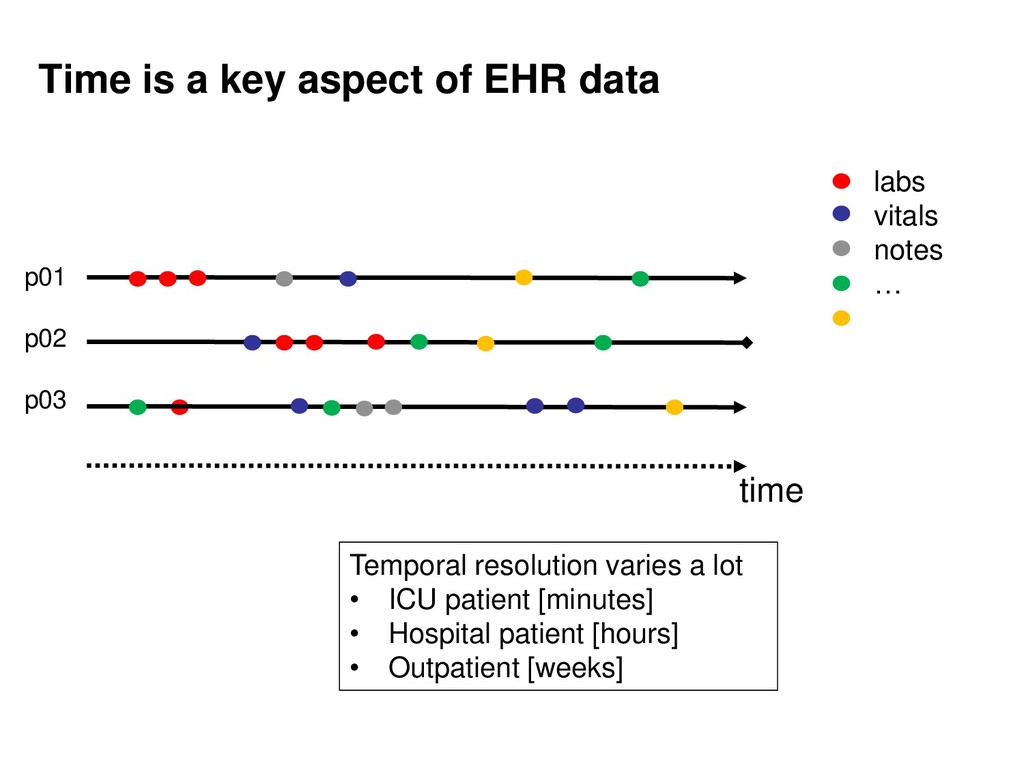
  9. • labs • vitals • notes • … Time is

    a key aspect of EHR data p01 p02 p03 Temporal resolution varies a lot • ICU patient [minutes] • Hospital patient [hours] • Outpatient [weeks] time
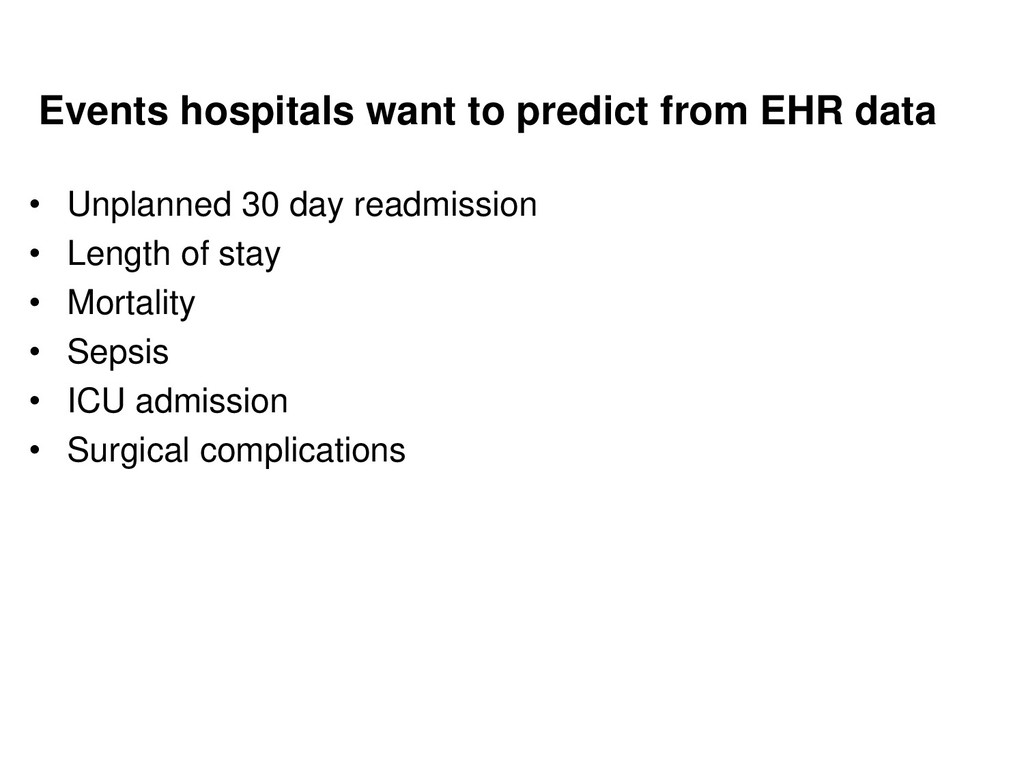
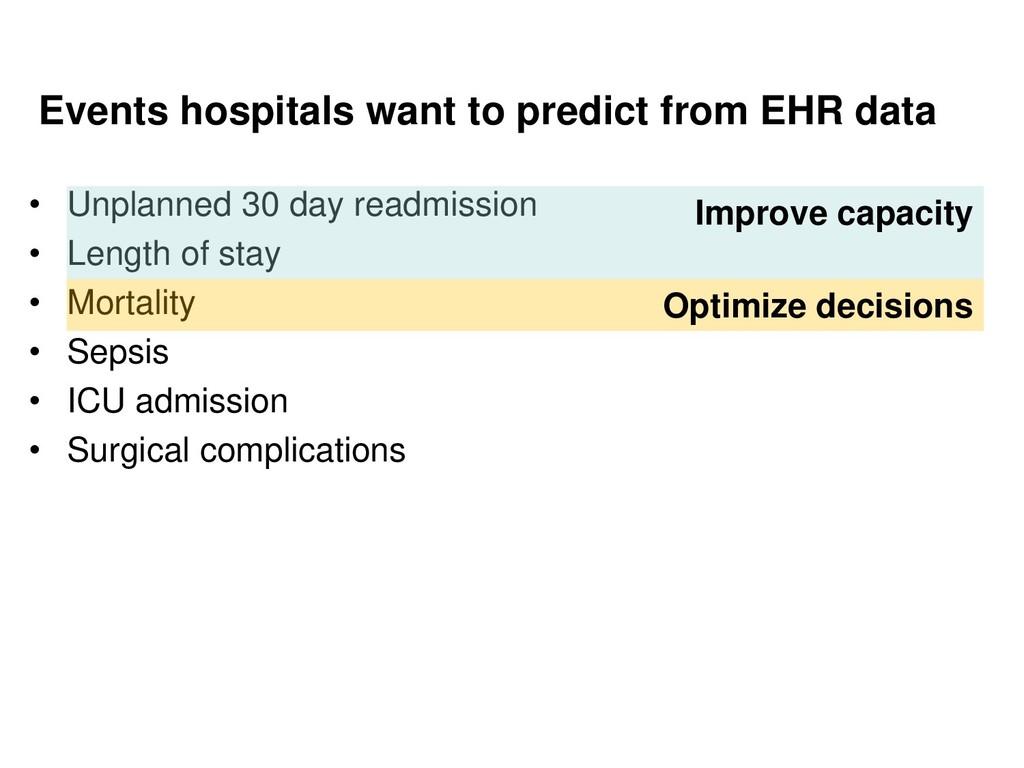
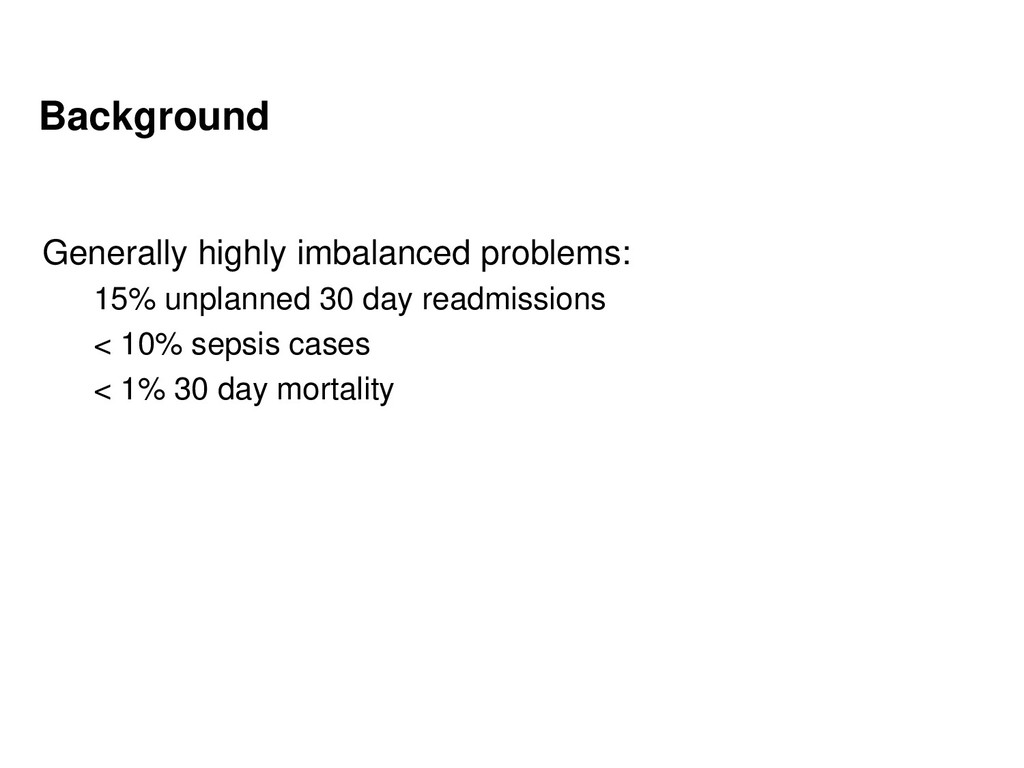
  10. • Unplanned 30 day readmission • Length of stay •

    Mortality • Sepsis • ICU admission • Surgical complications Events hospitals want to predict from EHR data
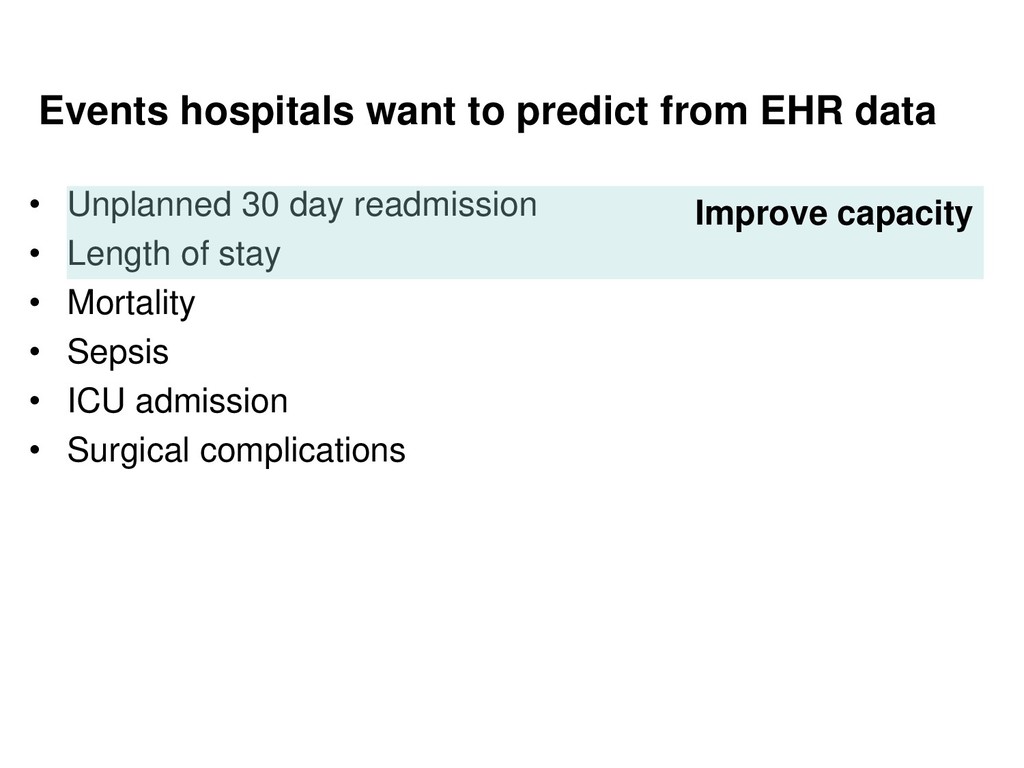
  11. • Unplanned 30 day readmission • Length of stay •

    Mortality • Sepsis • ICU admission • Surgical complications Events hospitals want to predict from EHR data Improve capacity
  12. • Unplanned 30 day readmission • Length of stay •

    Mortality • Sepsis • ICU admission • Surgical complications Events hospitals want to predict from EHR data Improve capacity Optimize decisions
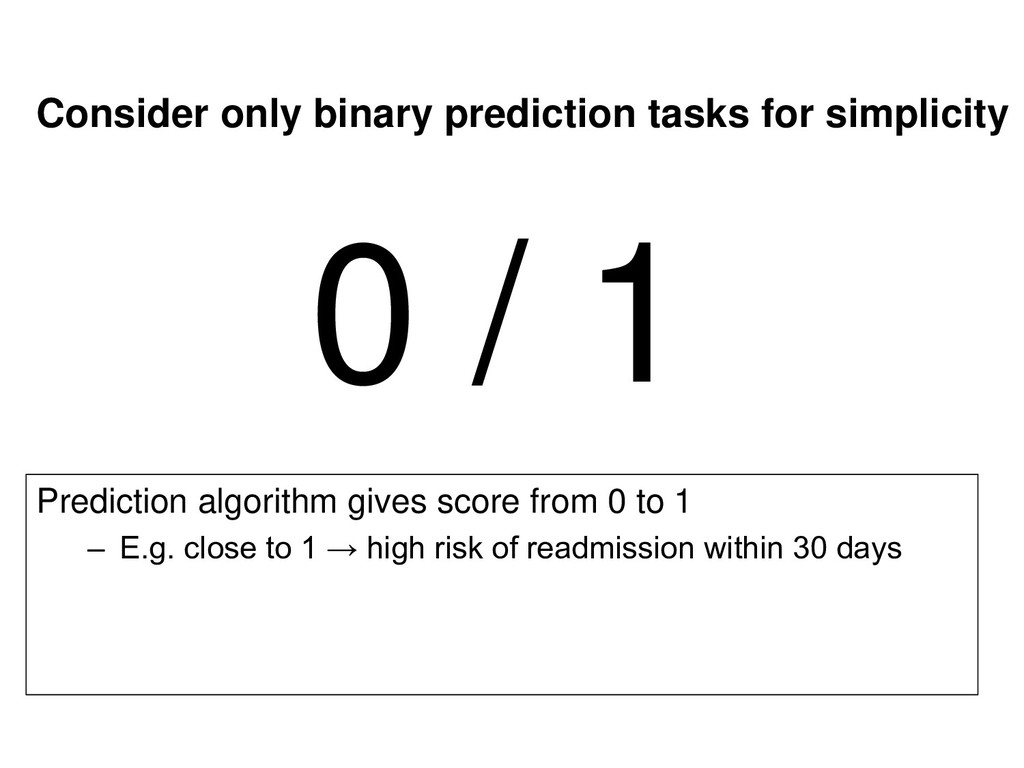
  13. Consider only binary prediction tasks for simplicity Prediction algorithm gives

    score from 0 to 1 – E.g. close to 1 → high risk of readmission within 30 days 0 / 1
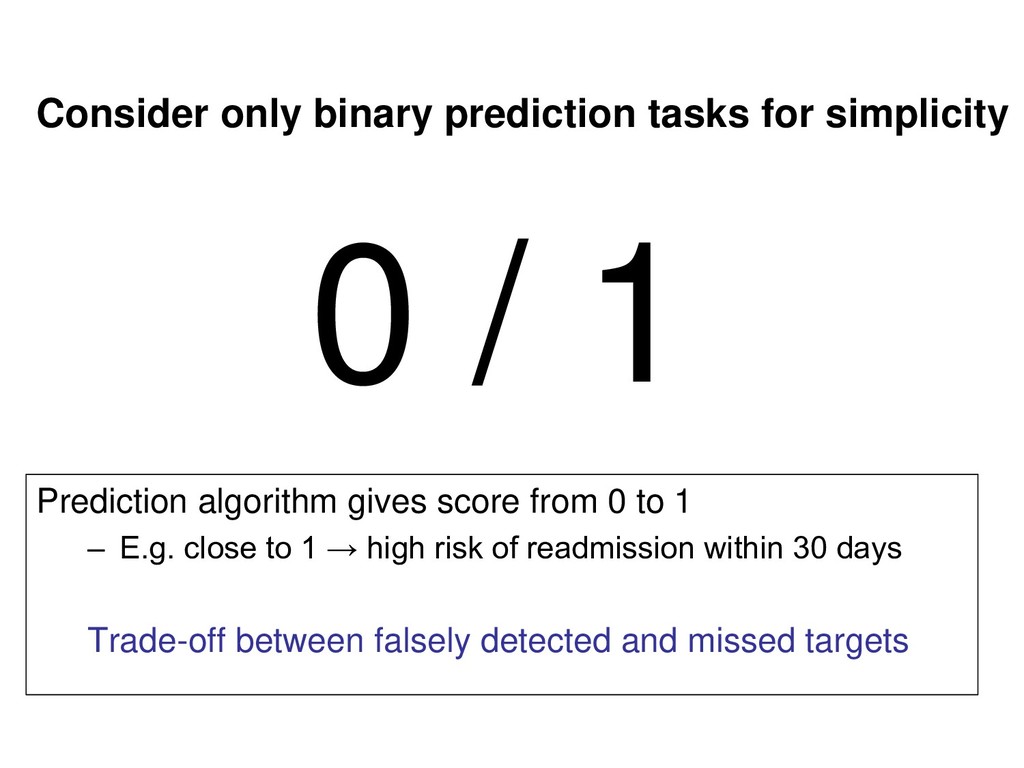
  14. Consider only binary prediction tasks for simplicity Prediction algorithm gives

    score from 0 to 1 – E.g. close to 1 → high risk of readmission within 30 days Trade-off between falsely detected and missed targets 0 / 1
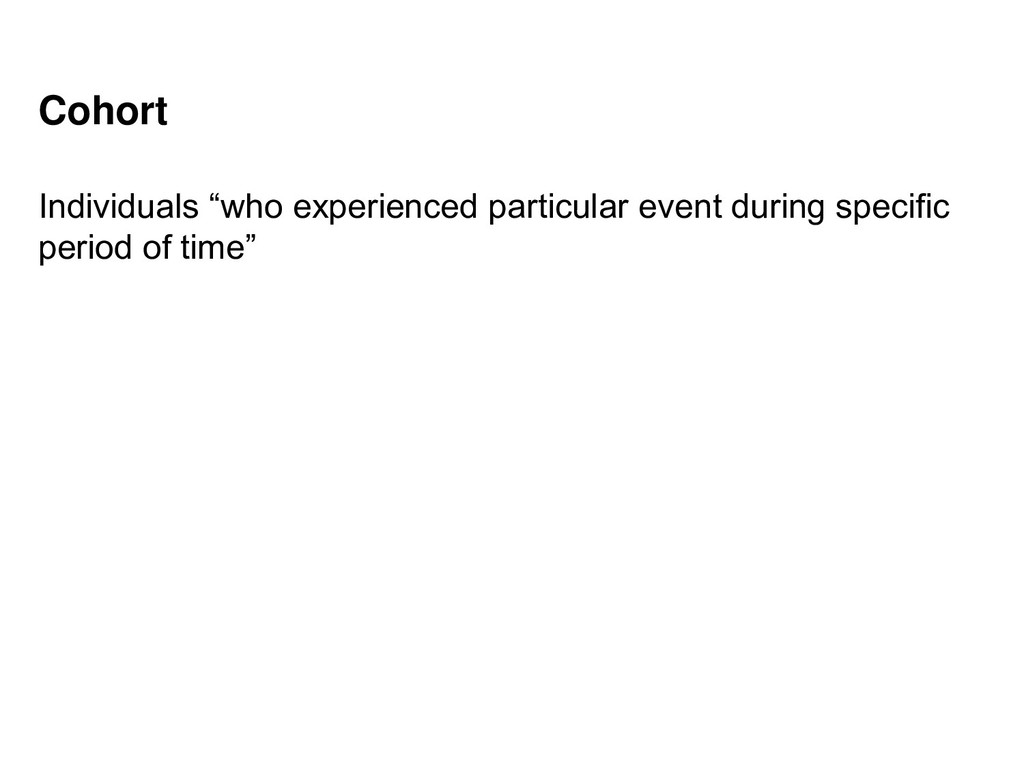
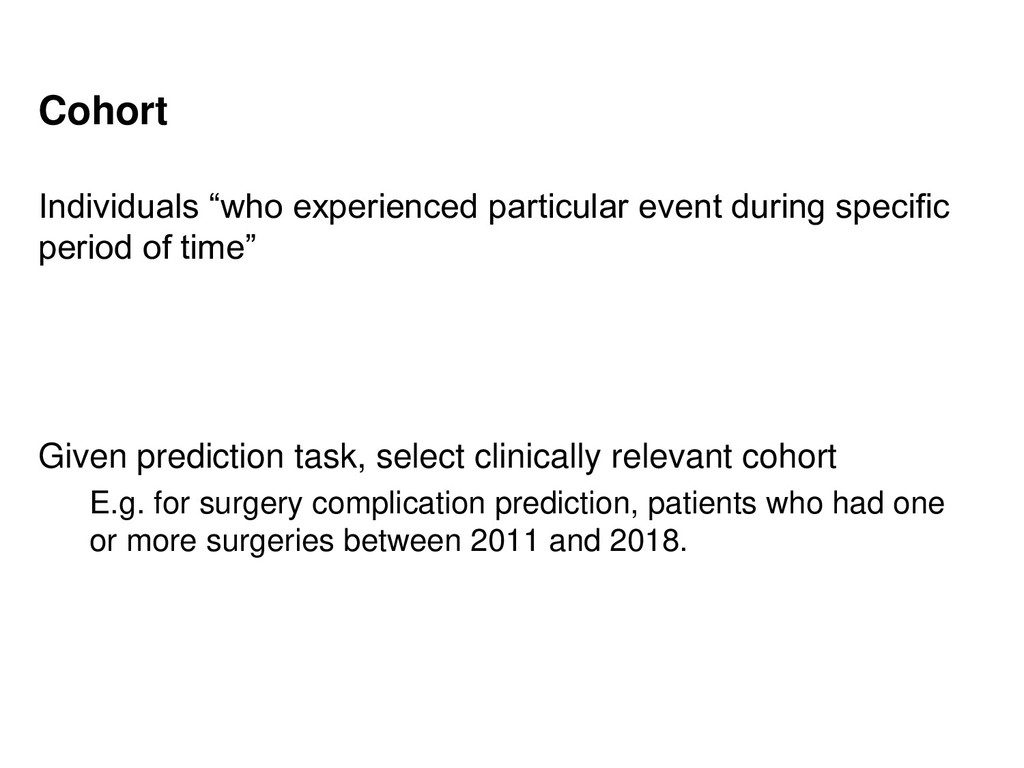
  15. Individuals “who experienced particular event during specific period of time”

    Given prediction task, select clinically relevant cohort E.g. for surgery complication prediction, patients who had one or more surgeries between 2011 and 2018. Cohort
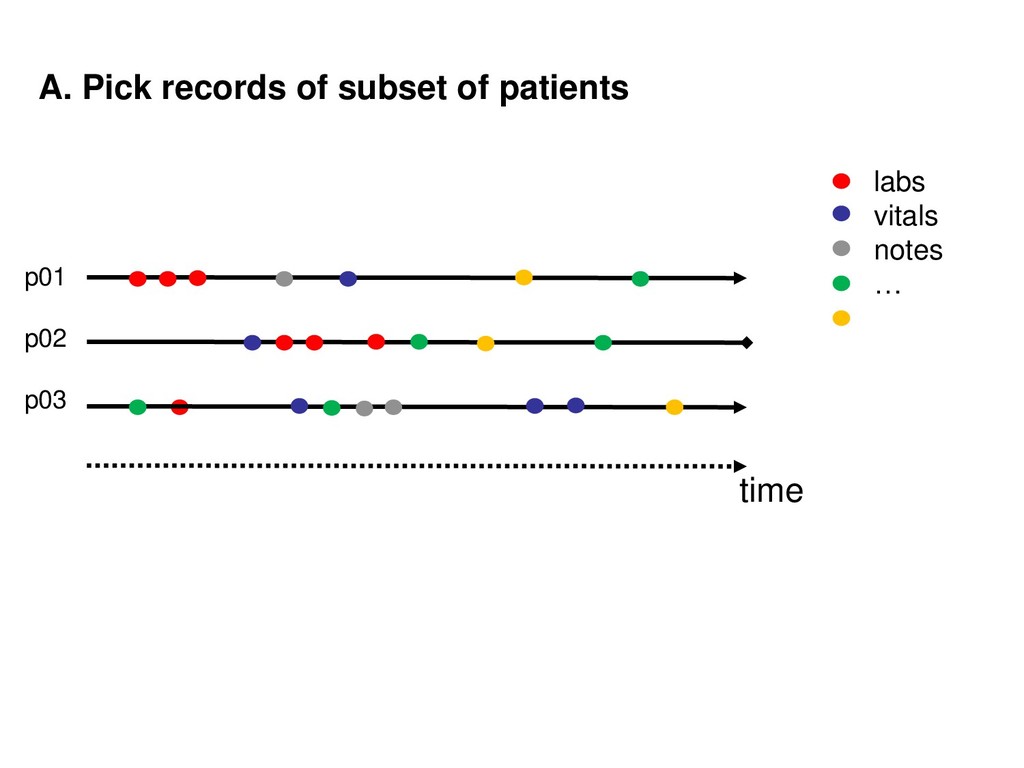
  16. A. Pick records of subset of patients • labs •

    vitals • notes • … p01 p02 p03 time
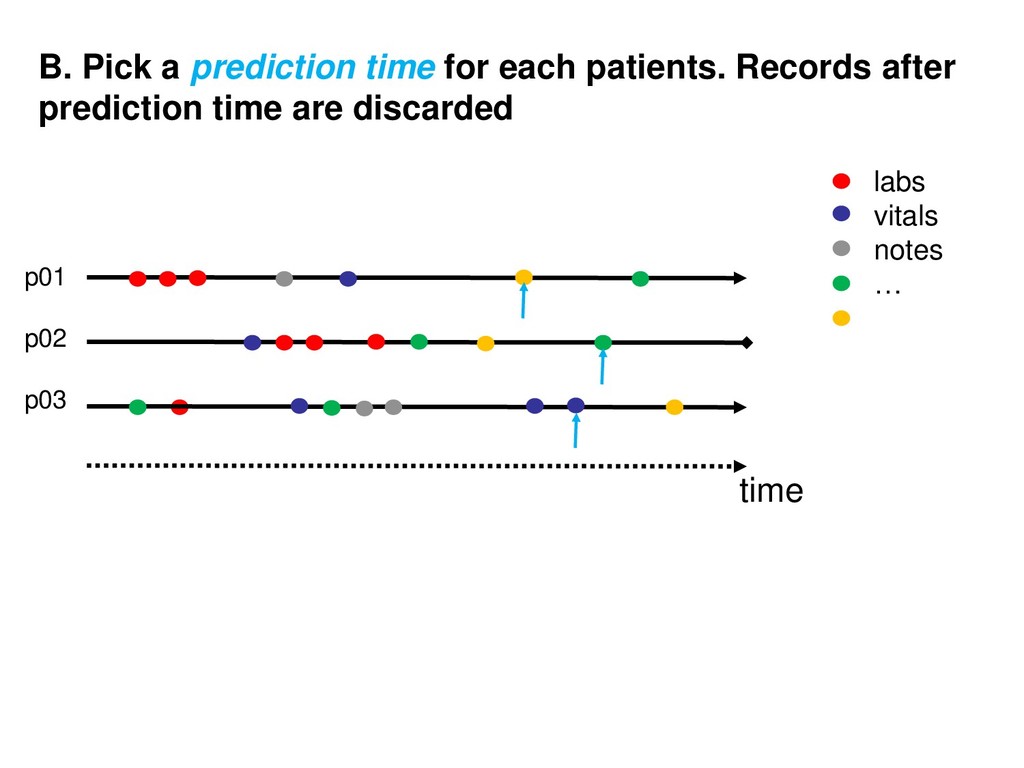
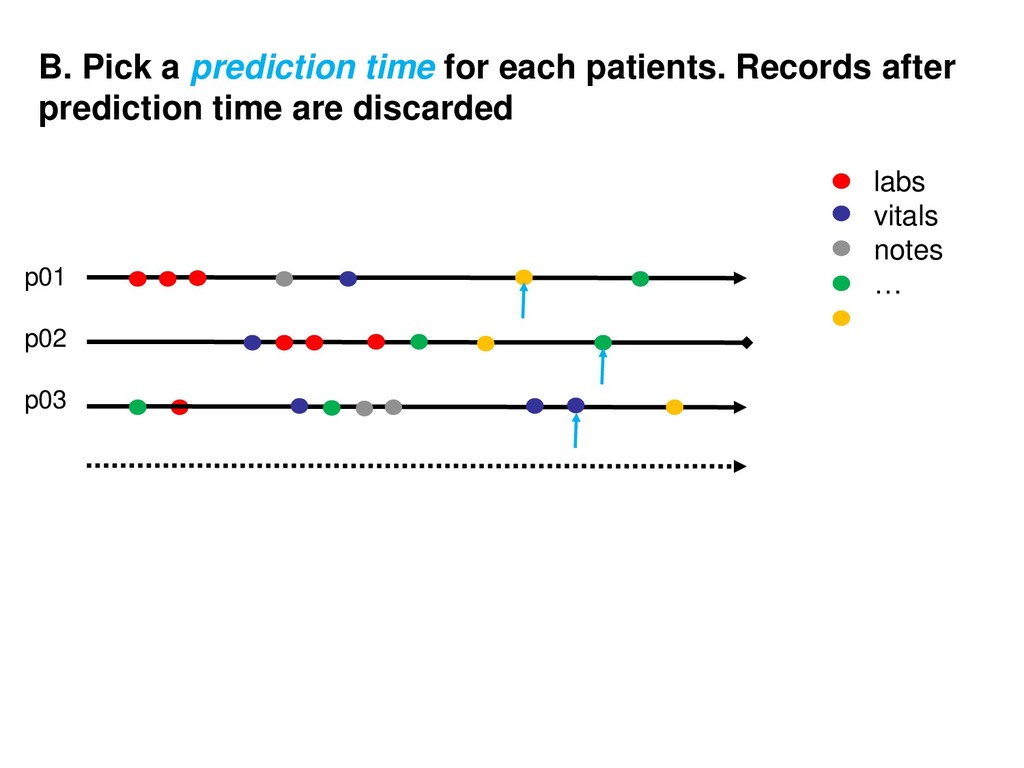
  17. B. Pick a prediction time for each patients. Records after

    prediction time are discarded • labs • vitals • notes • … p01 p02 p03 time
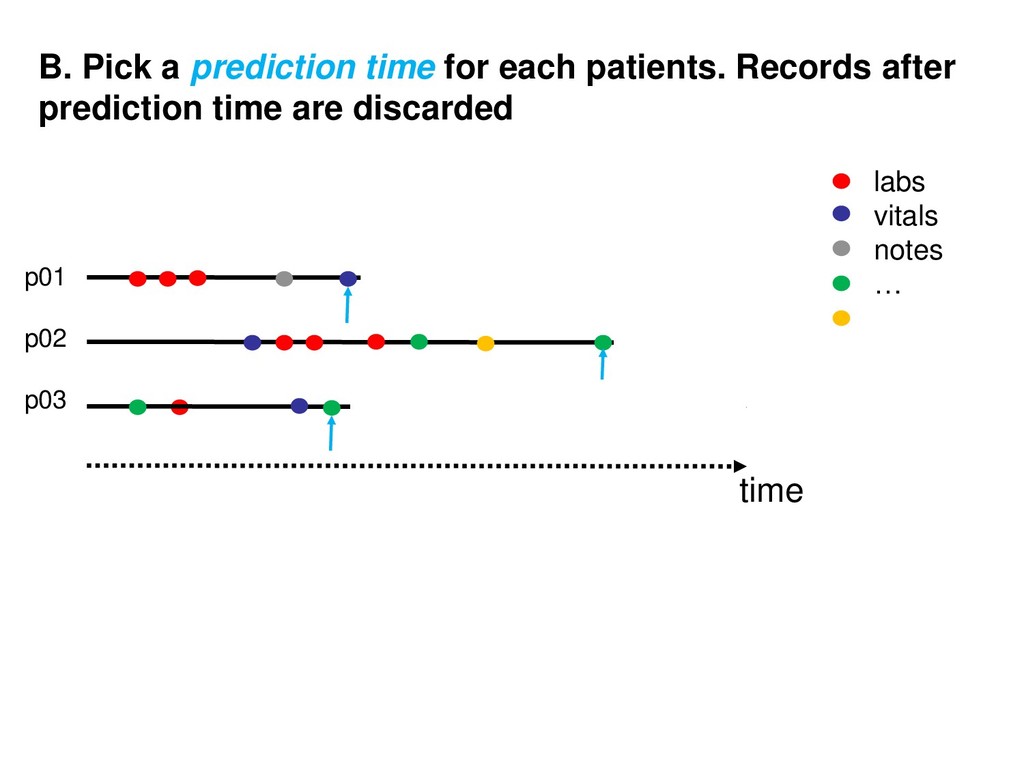
  18. B. Pick a prediction time for each patients. Records after

    prediction time are discarded • labs • vitals • notes • … p01 p02 p03 time
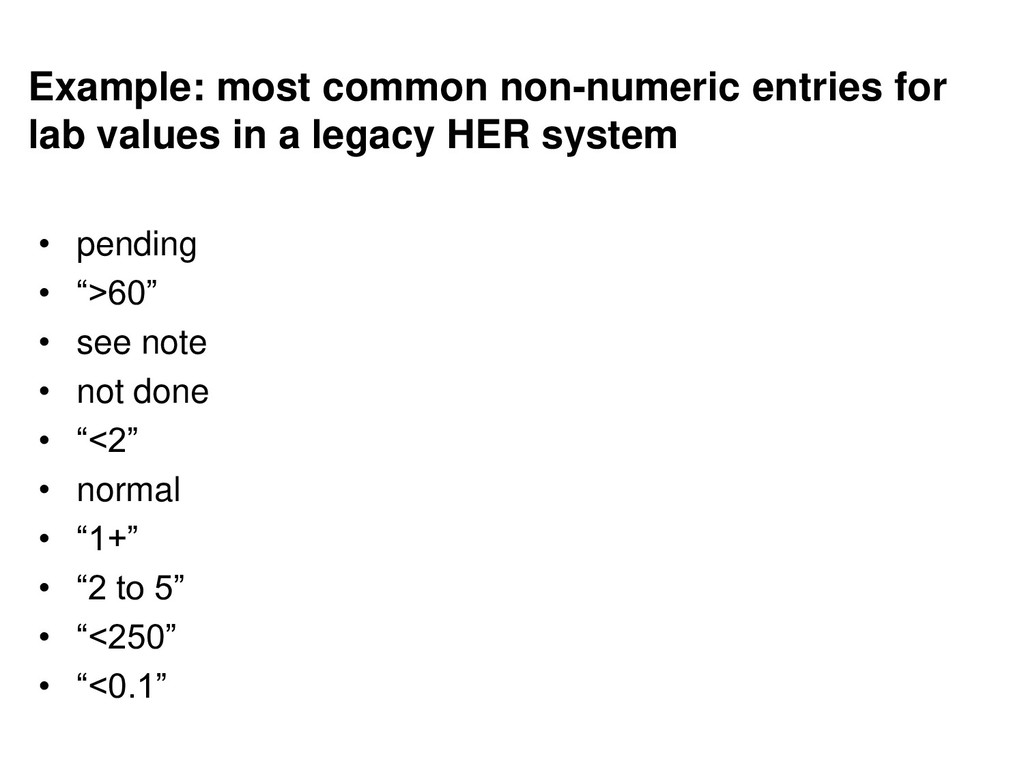
  19. Example: most common non-numeric entries for lab values in a

    legacy HER system • pending • “>60” • see note • not done • “<2” • normal • “1+” • “2 to 5” • “<250” • “<0.1”
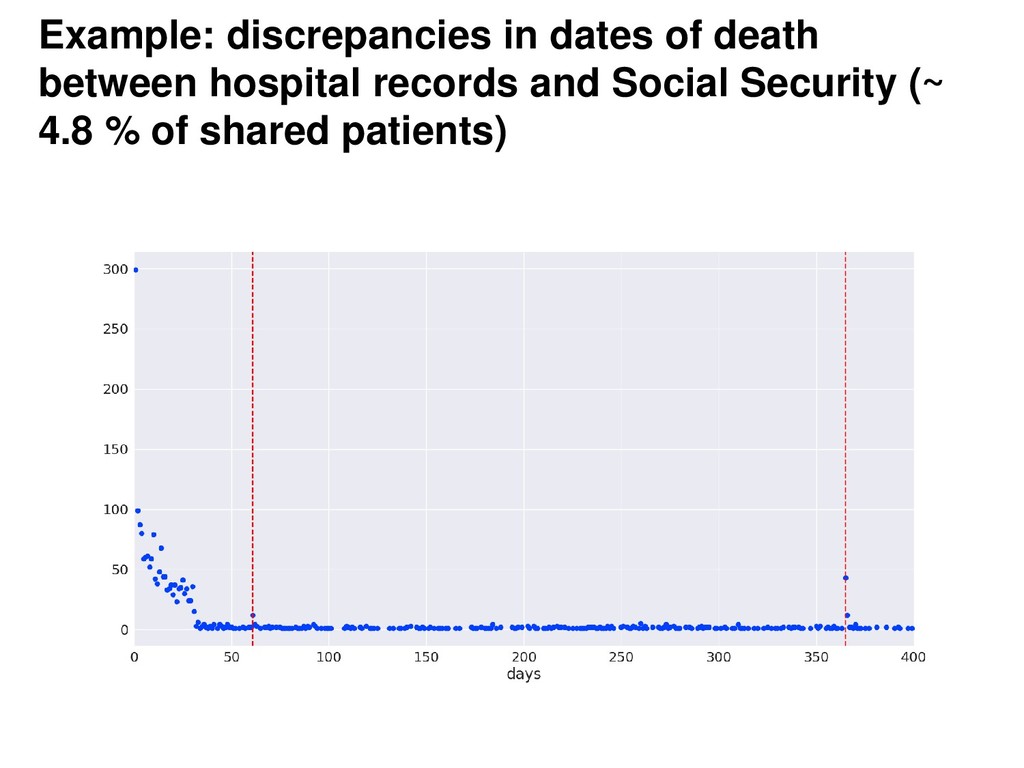
  20. Example: discrepancies in dates of death between hospital records and

    Social Security (~ 4.8 % of shared patients)
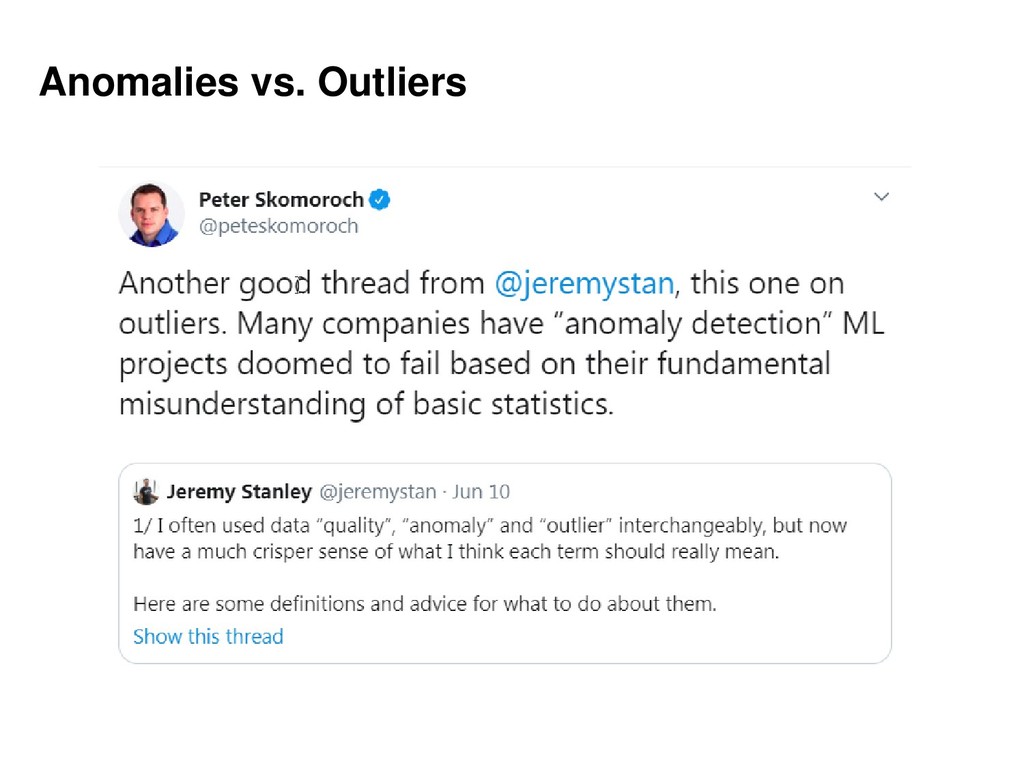
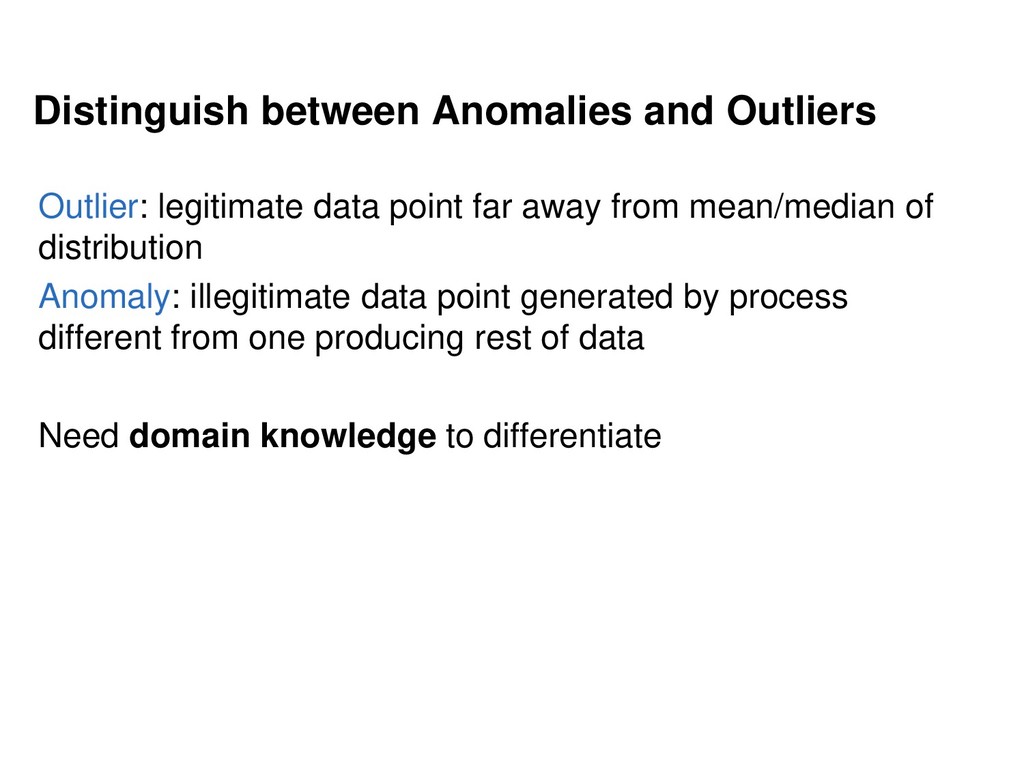
  21. Distinguish between Anomalies and Outliers Outlier: legitimate data point far

    away from mean/median of distribution Anomaly: illegitimate data point generated by process different from one producing rest of data Need domain knowledge to differentiate
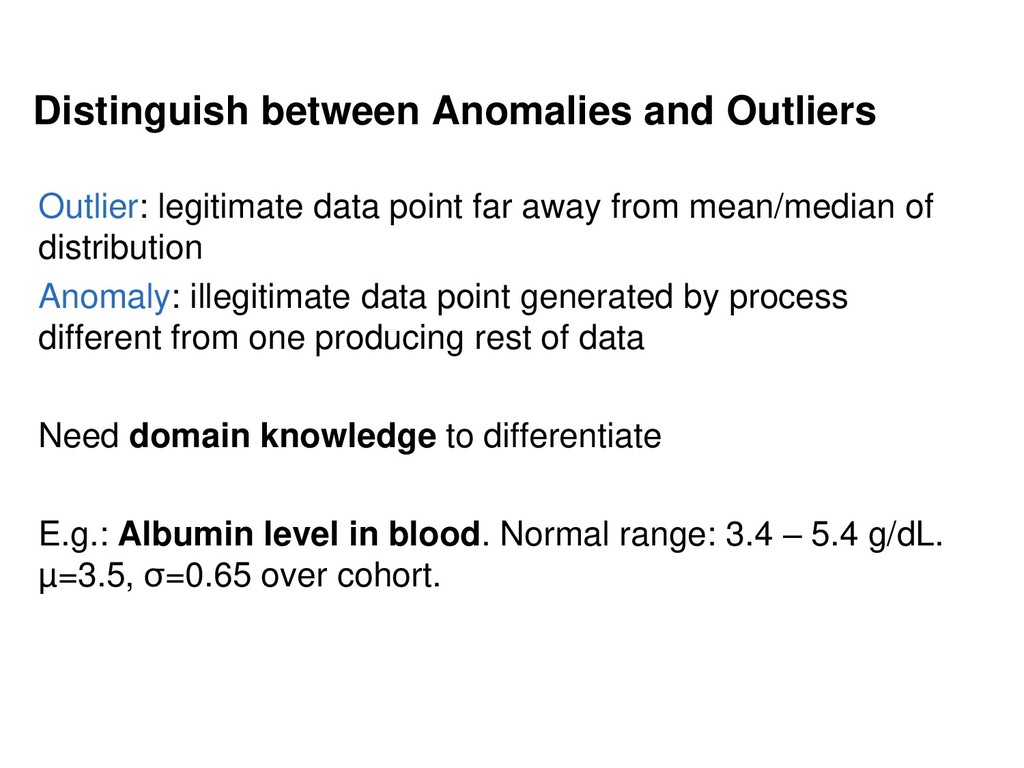
  22. Distinguish between Anomalies and Outliers Outlier: legitimate data point far

    away from mean/median of distribution Anomaly: illegitimate data point generated by process different from one producing rest of data Need domain knowledge to differentiate E.g.: Albumin level in blood. Normal range: 3.4 – 5.4 g/dL. µ=3.5, σ=0.65 over cohort.
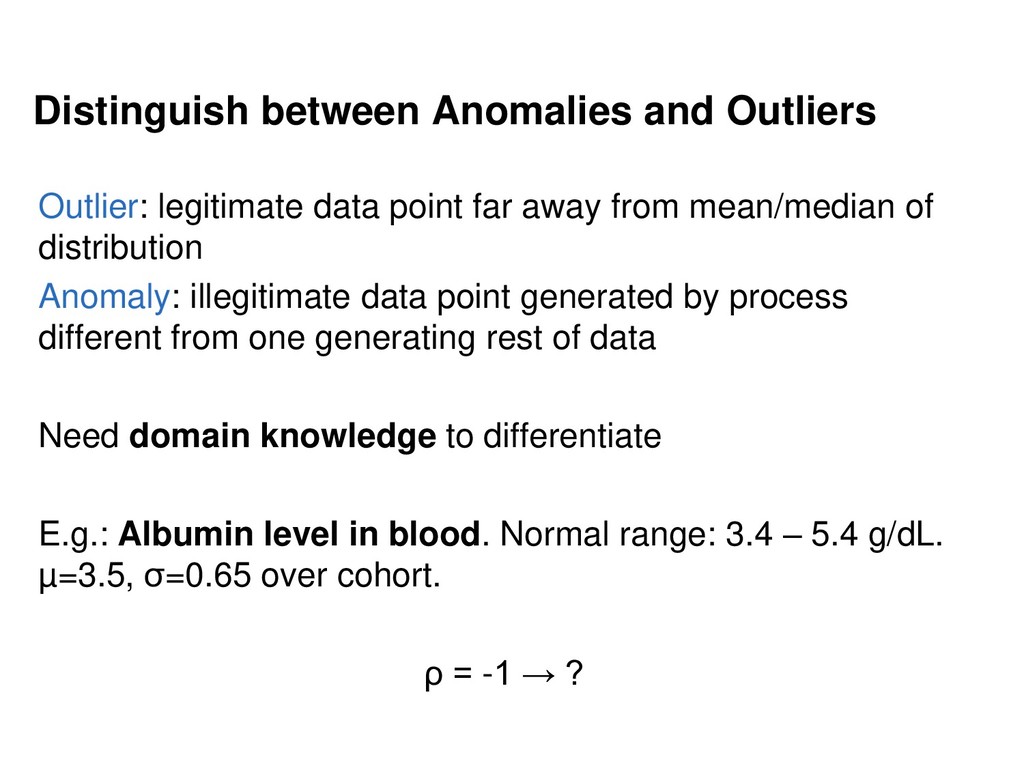
  23. Distinguish between Anomalies and Outliers Outlier: legitimate data point far

    away from mean/median of distribution Anomaly: illegitimate data point generated by process different from one generating rest of data Need domain knowledge to differentiate E.g.: Albumin level in blood. Normal range: 3.4 – 5.4 g/dL. µ=3.5, σ=0.65 over cohort. ρ = -1 → ?
  24. Distinguish between Anomalies and Outliers Outlier: legitimate data point far

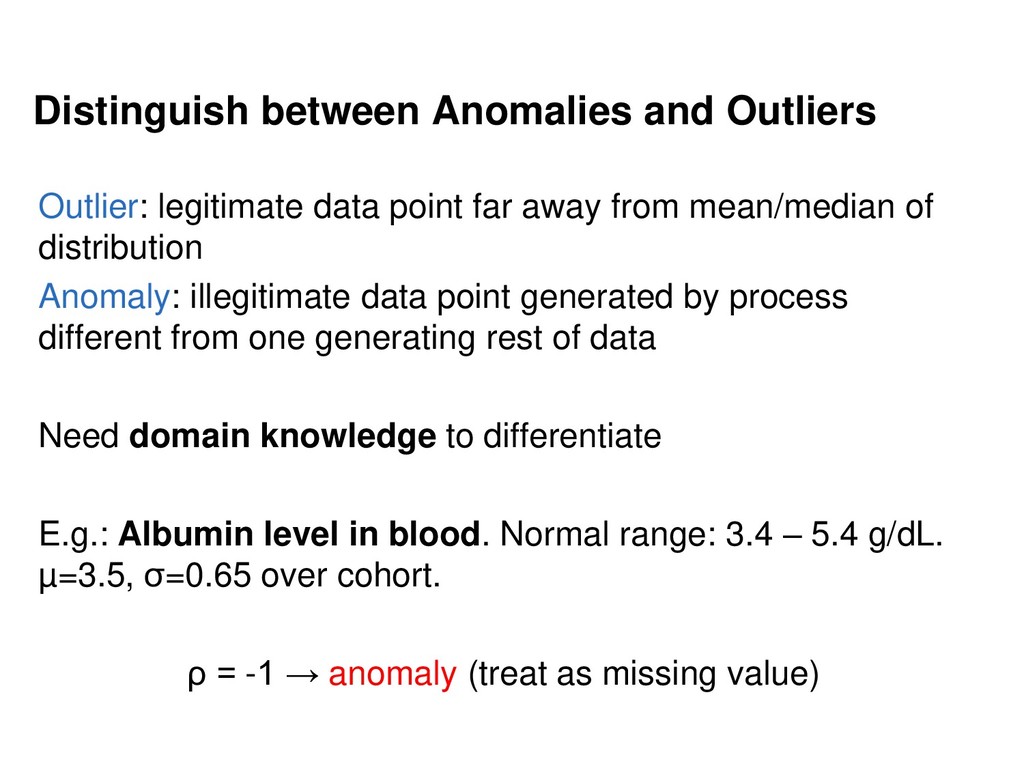
    away from mean/median of distribution Anomaly: illegitimate data point generated by process different from one generating rest of data Need domain knowledge to differentiate E.g.: Albumin level in blood. Normal range: 3.4 – 5.4 g/dL. µ=3.5, σ=0.65 over cohort. ρ = -1 → anomaly (treat as missing value)
  25. Distinguish between Anomalies and Outliers Outlier: legitimate data point far

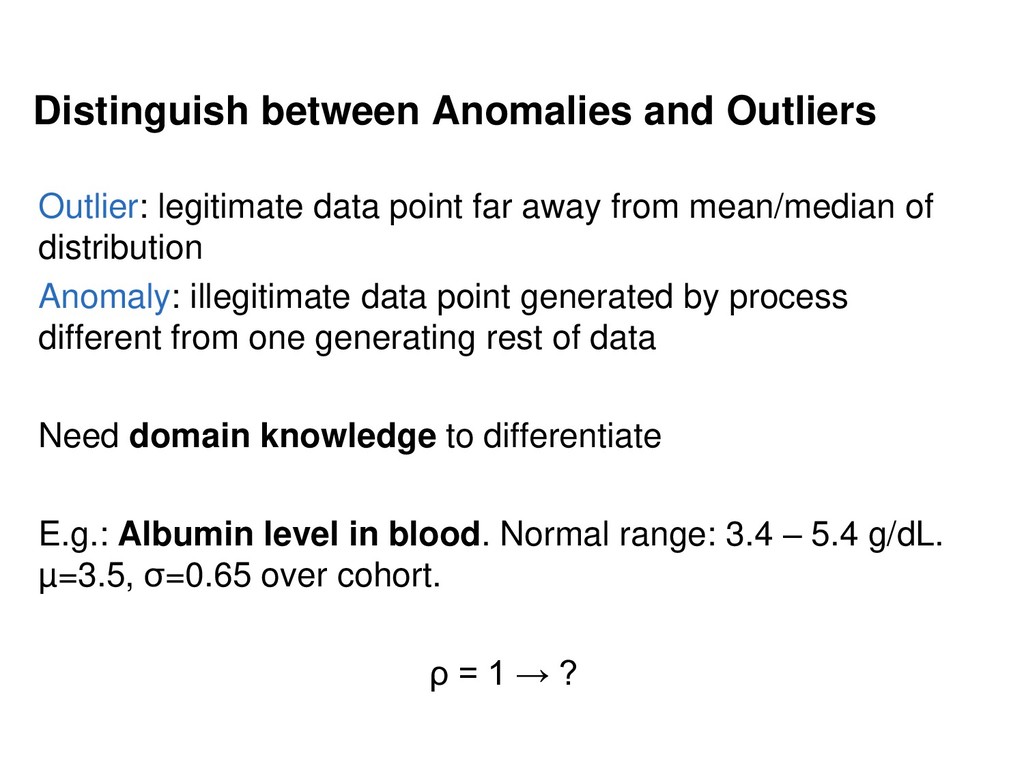
    away from mean/median of distribution Anomaly: illegitimate data point generated by process different from one generating rest of data Need domain knowledge to differentiate E.g.: Albumin level in blood. Normal range: 3.4 – 5.4 g/dL. µ=3.5, σ=0.65 over cohort. ρ = 1 → ?
  26. Distinguish between Anomalies and Outliers Outlier: legitimate data point far

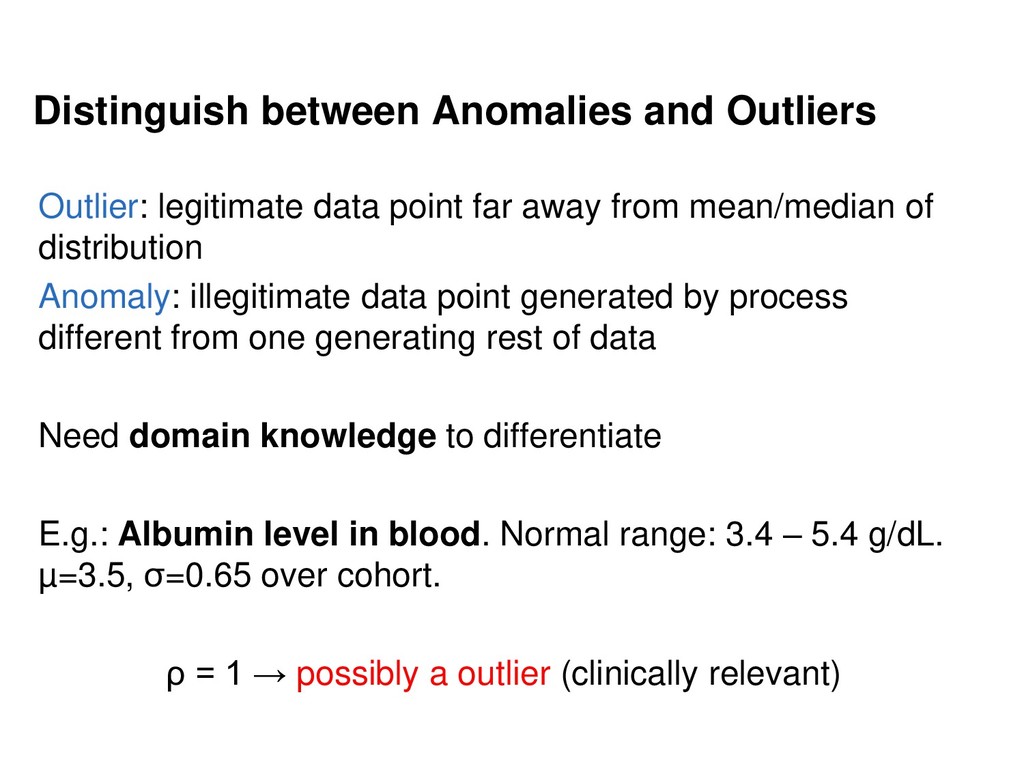
    away from mean/median of distribution Anomaly: illegitimate data point generated by process different from one generating rest of data Need domain knowledge to differentiate E.g.: Albumin level in blood. Normal range: 3.4 – 5.4 g/dL. µ=3.5, σ=0.65 over cohort. ρ = 1 → possibly a outlier (clinically relevant)
  27. • Machine learning models evaluated on ability to make prediction

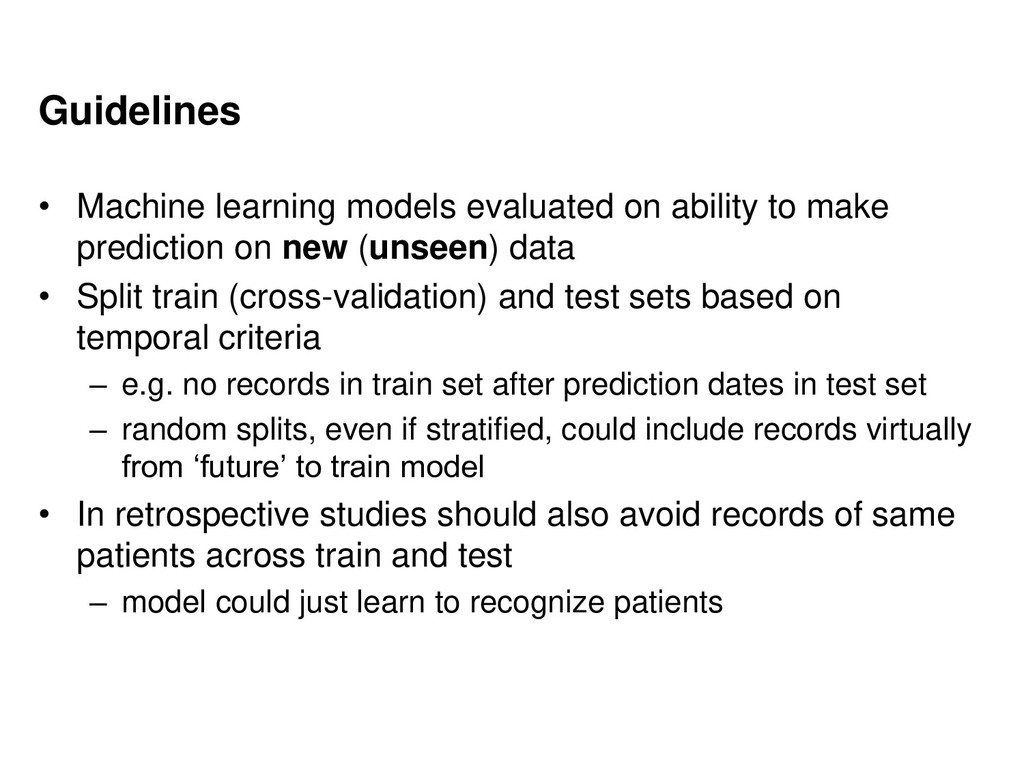
    on new (unseen) data • Split train (cross-validation) and test sets based on temporal criteria – e.g. no records in train set after prediction dates in test set – random splits, even if stratified, could include records virtually from ‘future’ to train model • In retrospective studies should also avoid records of same patients across train and test – model could just learn to recognize patients Guidelines
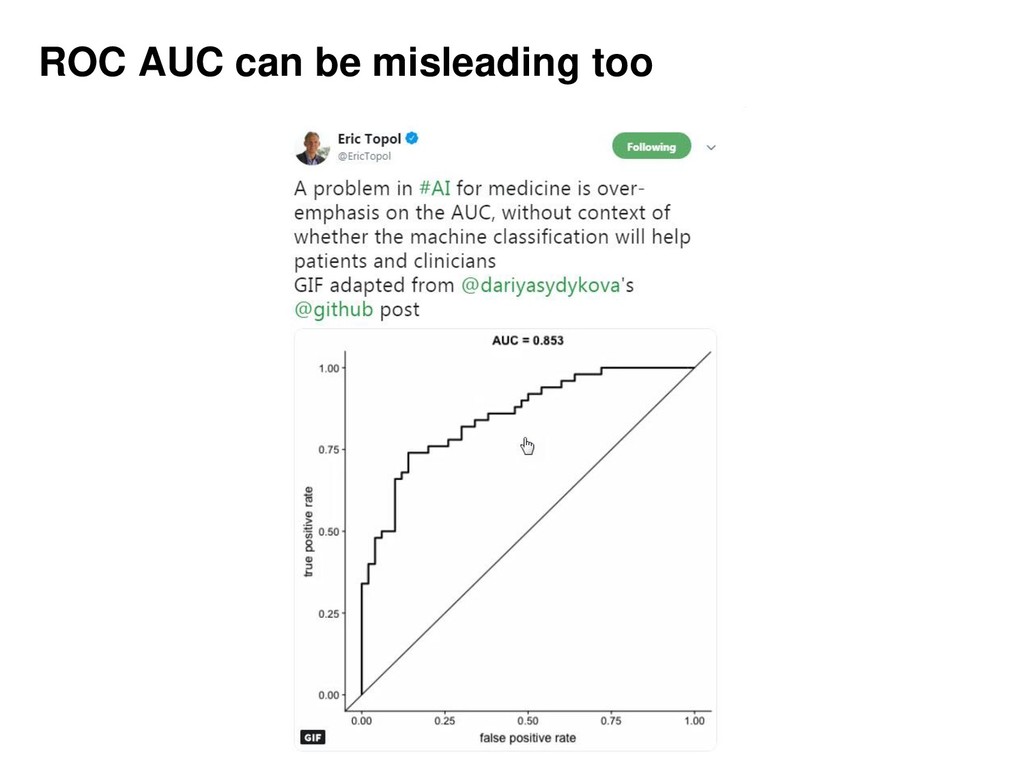
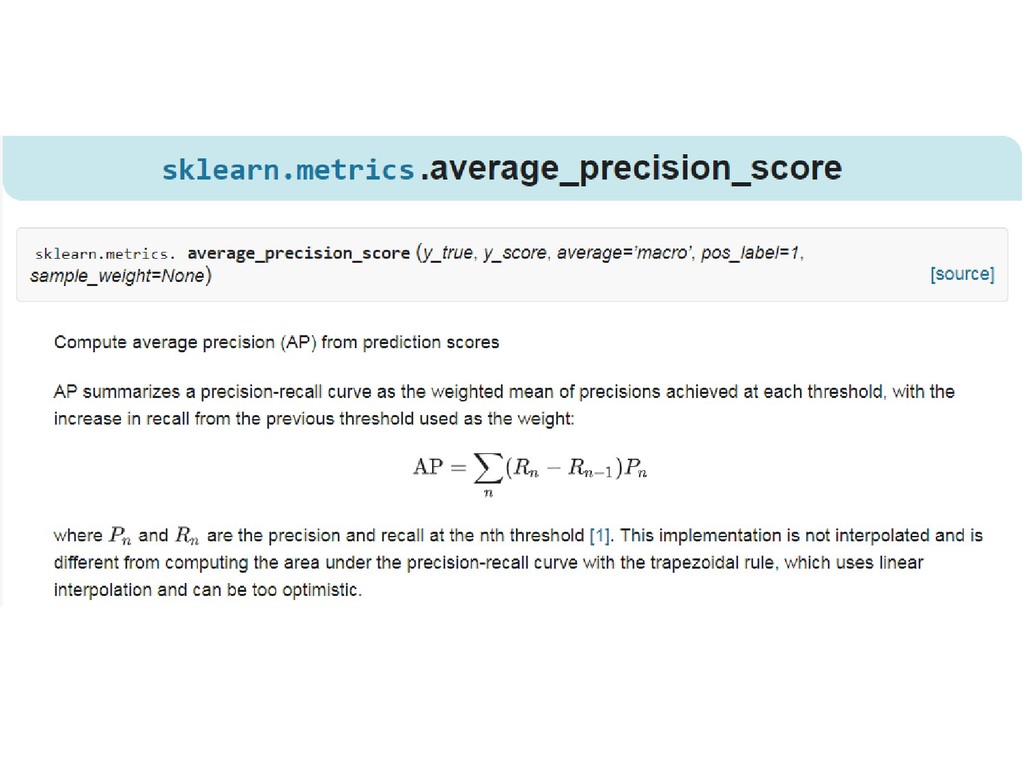
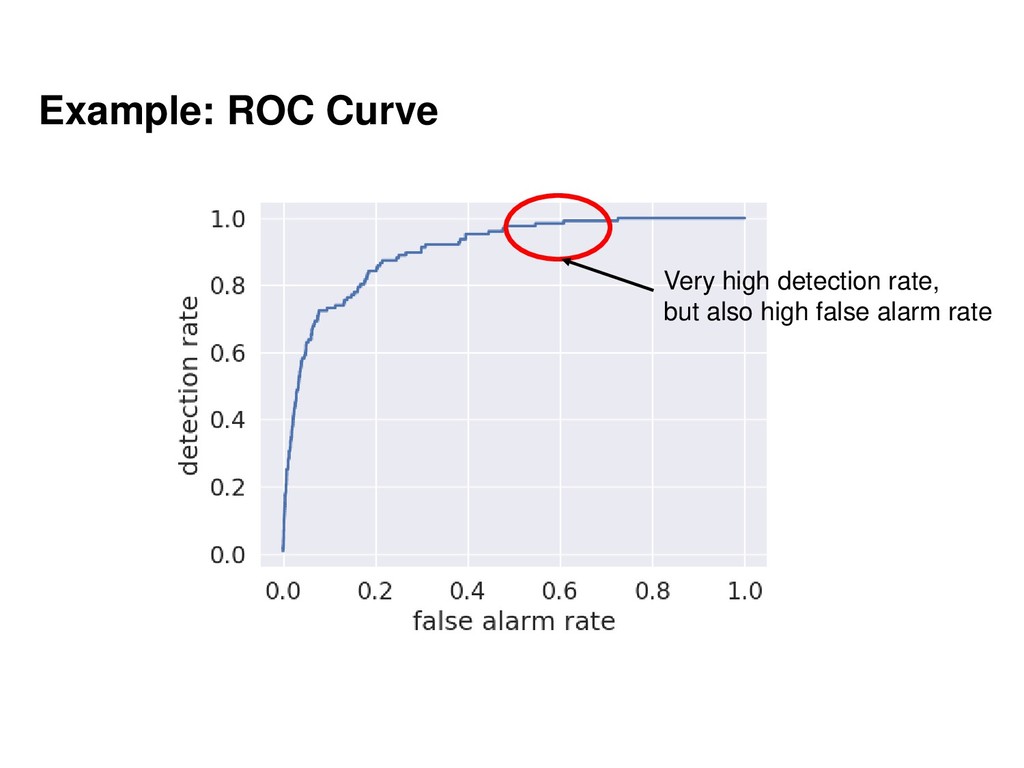
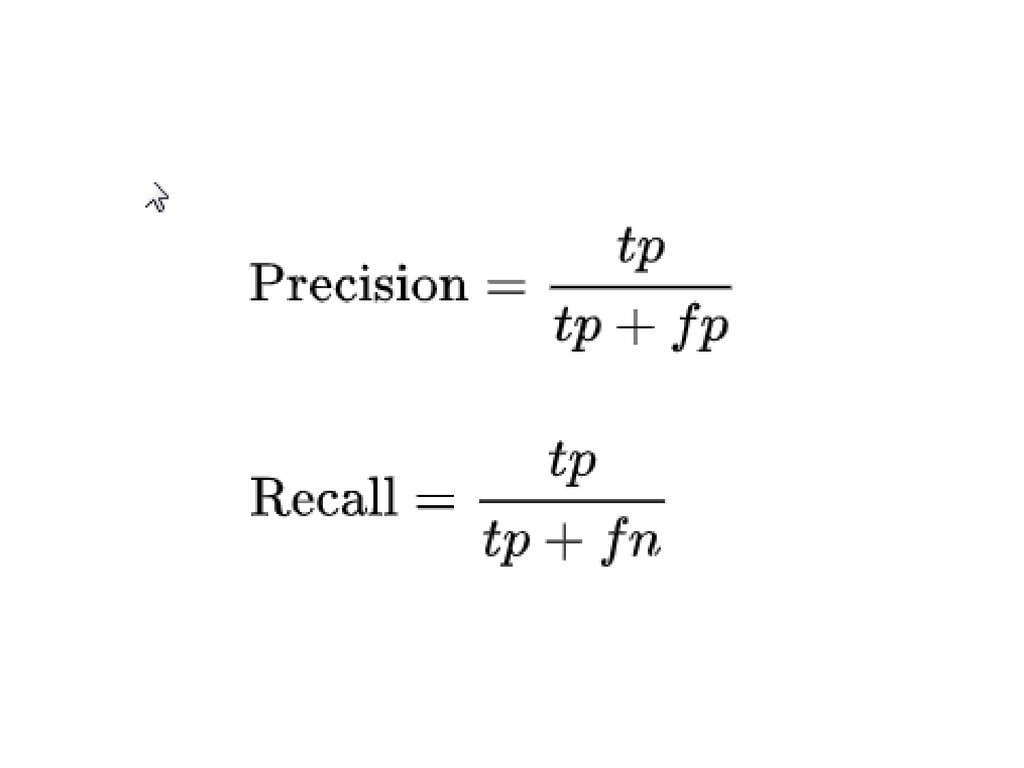
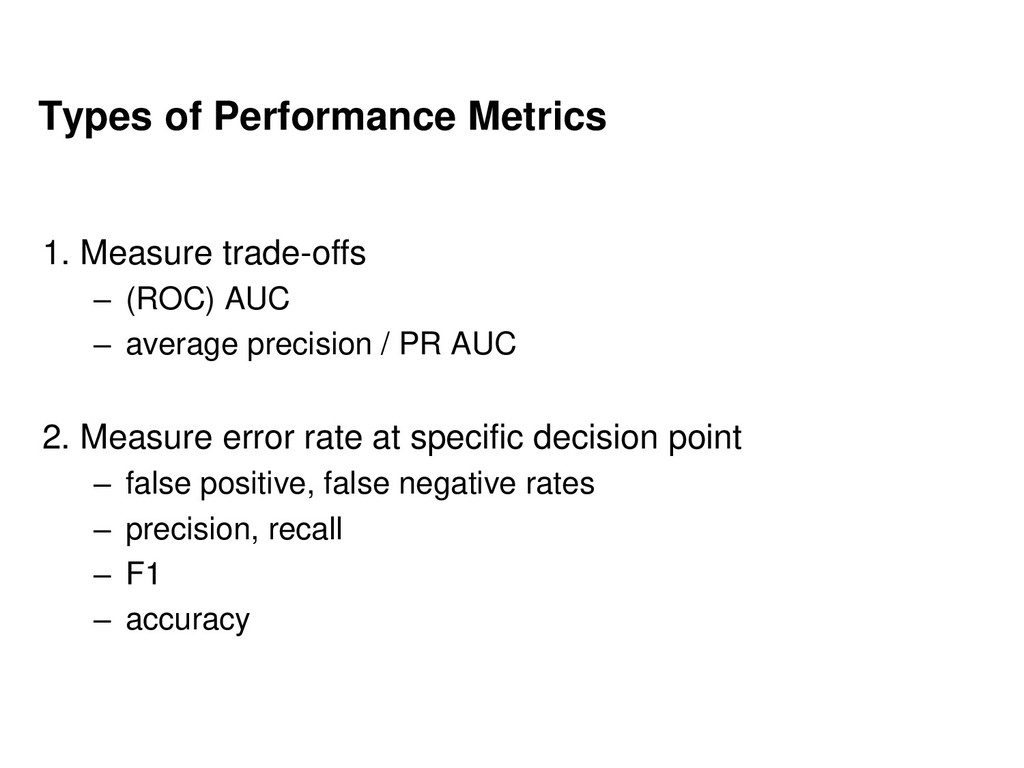
  28. Types of Performance Metrics 1. Measure trade-offs – (ROC) AUC

    – average precision / PR AUC 2. Measure error rate at specific decision point – false positive, false negative rates – precision, recall – F1 – accuracy
  29. Types of Performance Metrics (II) 1. Measure trade-offs – AUC,

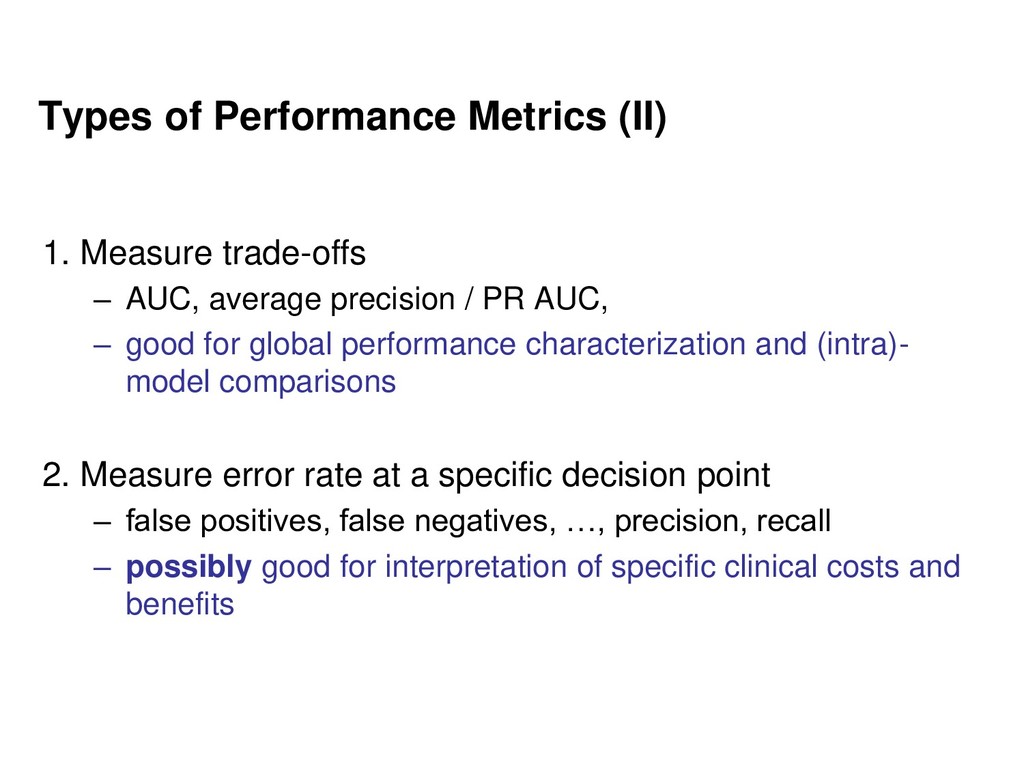
    average precision / PR AUC, – good for global performance characterization and (intra)- model comparisons 2. Measure error rate at a specific decision point – false positives, false negatives, …, precision, recall – possibly good for interpretation of specific clinical costs and benefits
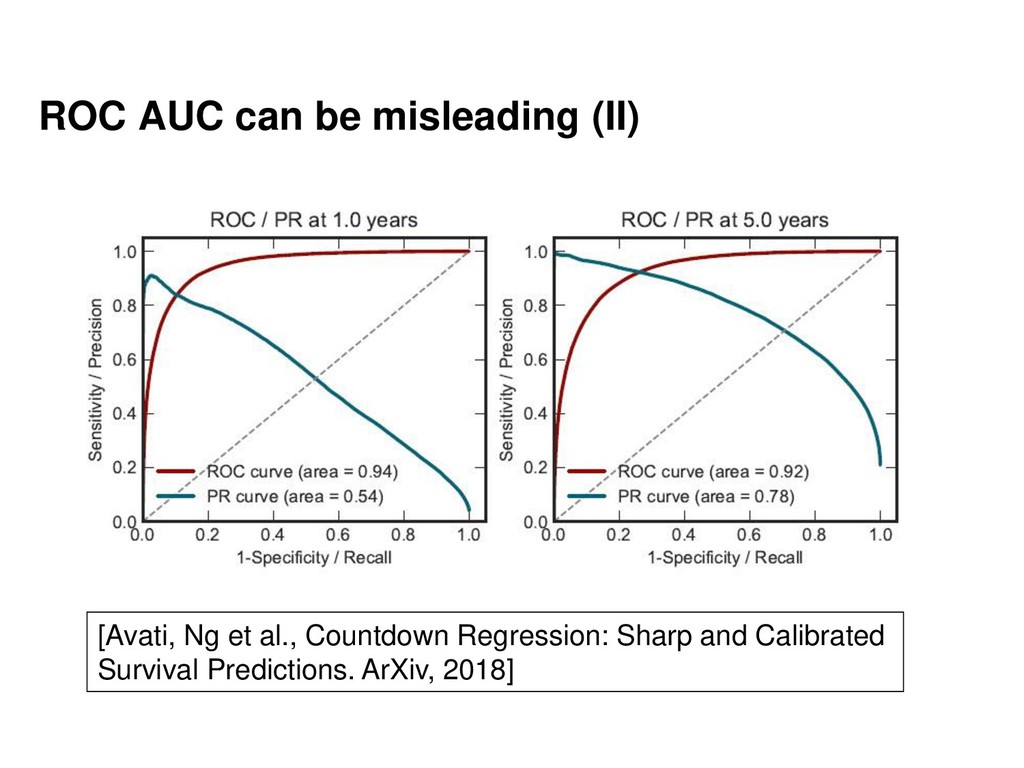
  30. ROC AUC can be misleading (II) [Avati, Ng et al.,

    Countdown Regression: Sharp and Calibrated Survival Predictions. ArXiv, 2018]
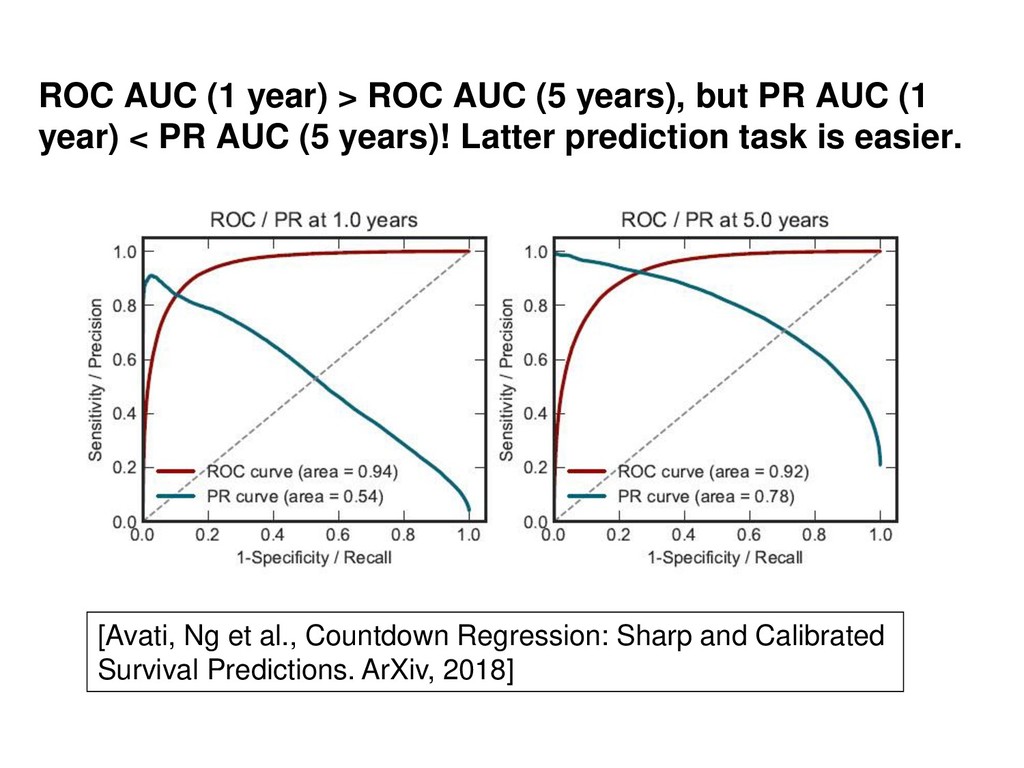
  31. ROC AUC (1 year) > ROC AUC (5 years), but

    PR AUC (1 year) < PR AUC (5 years)! Latter prediction task is easier. [Avati, Ng et al., Countdown Regression: Sharp and Calibrated Survival Predictions. ArXiv, 2018]
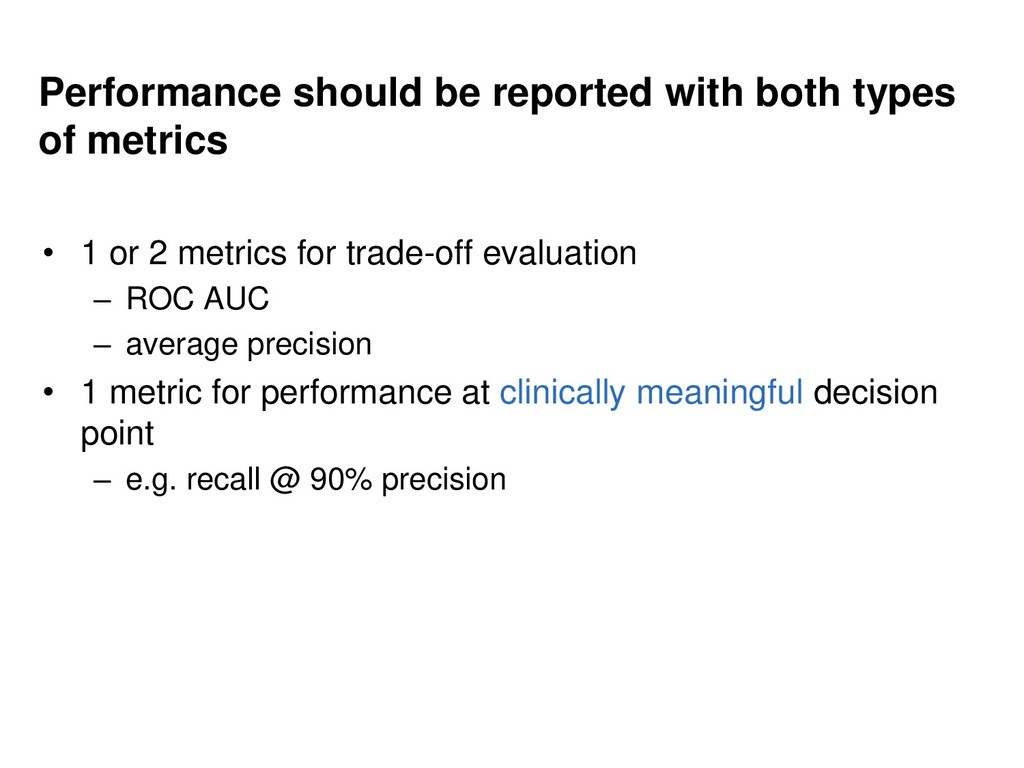
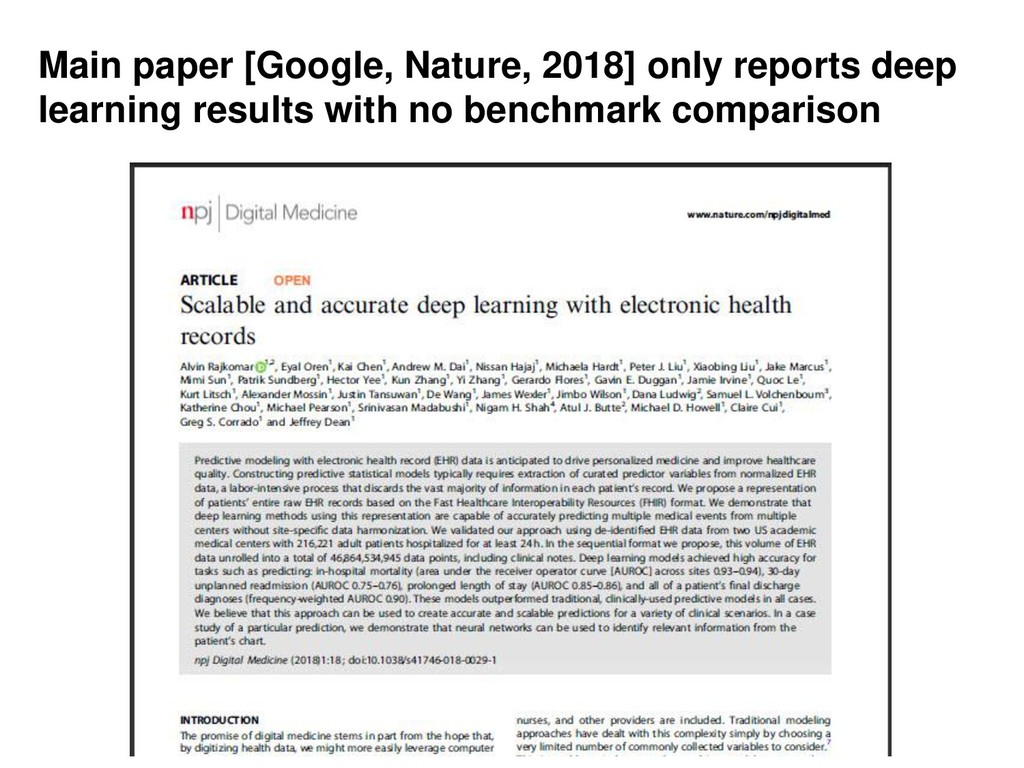
  32. Performance should be reported with both types of metrics •

    1 or 2 metrics for trade-off evaluation – ROC AUC – average precision • 1 metric for performance at clinically meaningful decision point – e.g. recall @ 90% precision
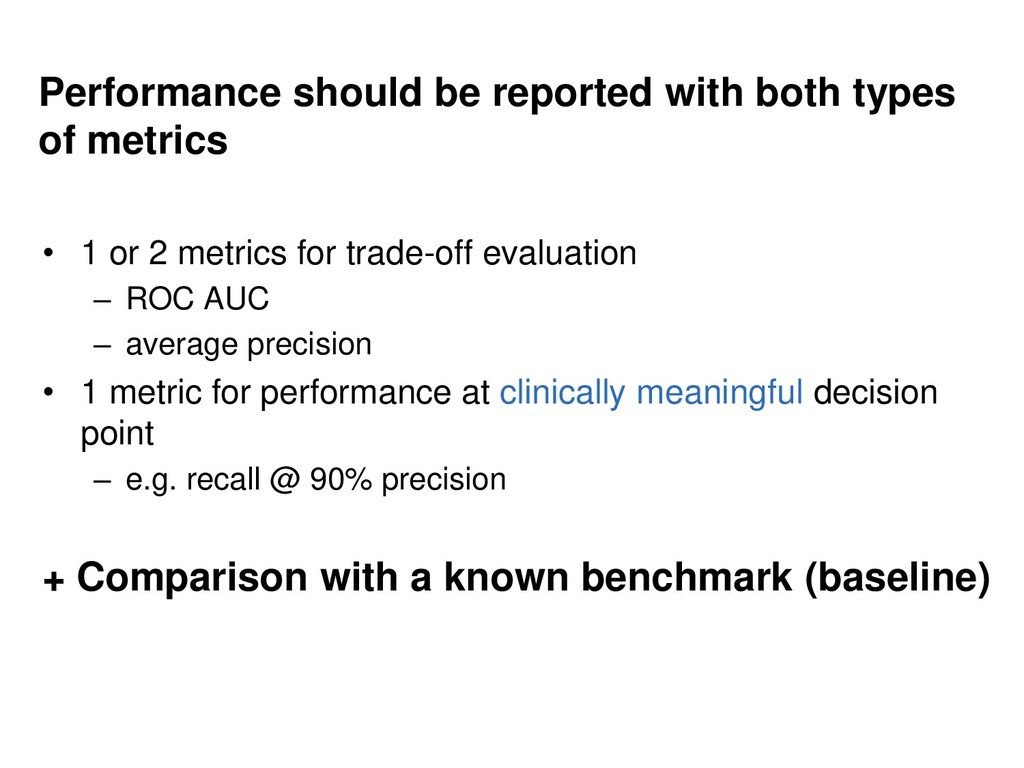
  33. Performance should be reported with both types of metrics •

    1 or 2 metrics for trade-off evaluation – ROC AUC – average precision • 1 metric for performance at clinically meaningful decision point – e.g. recall @ 90% precision + Comparison with a known benchmark (baseline)
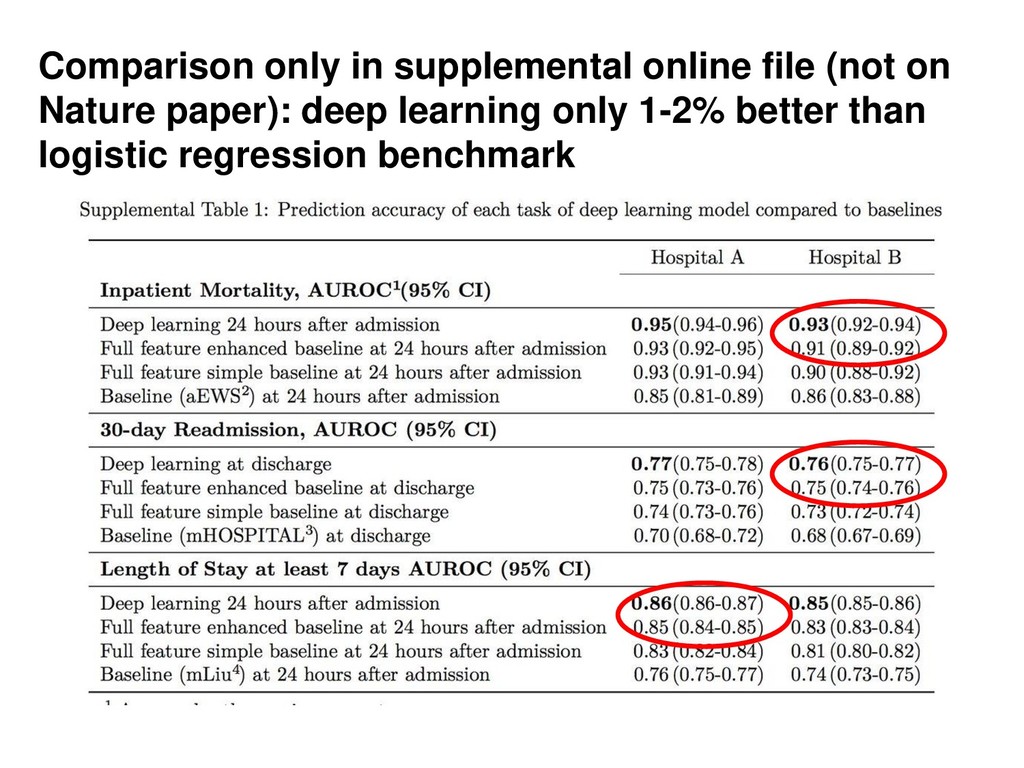
  34. Comparison only in supplemental online file (not on Nature paper):

    deep learning only 1-2% better than logistic regression benchmark
  35. B. Pick a prediction time for each patients. Records after

    prediction time are discarded • labs • vitals • notes • … p01 p02 p03
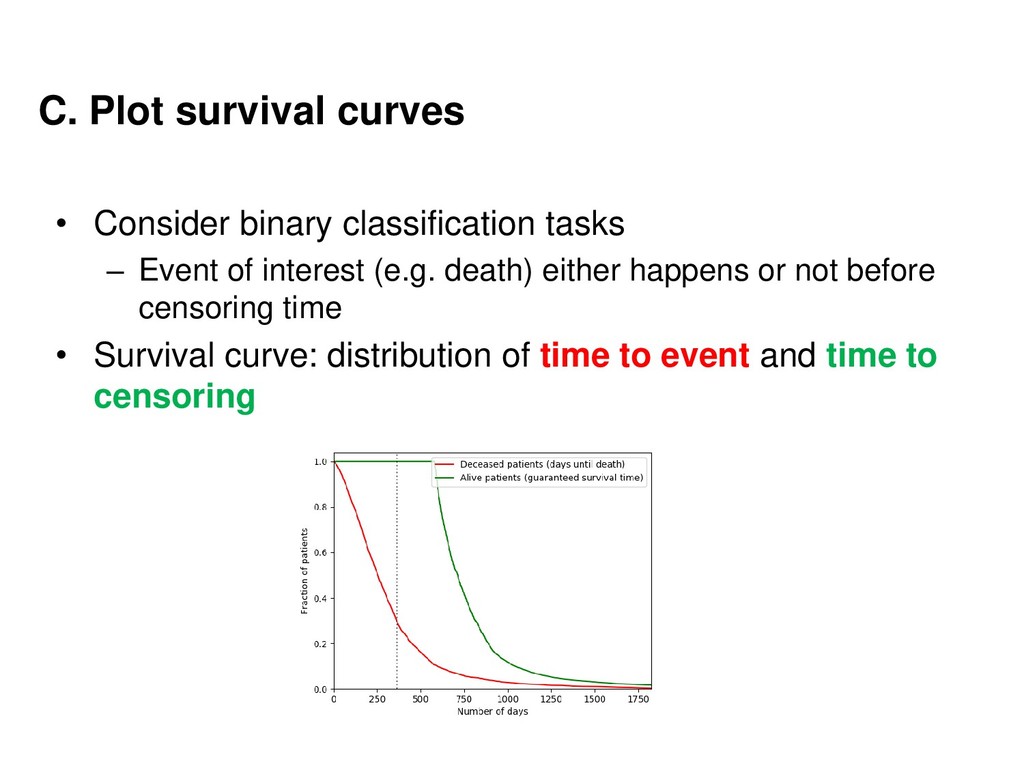
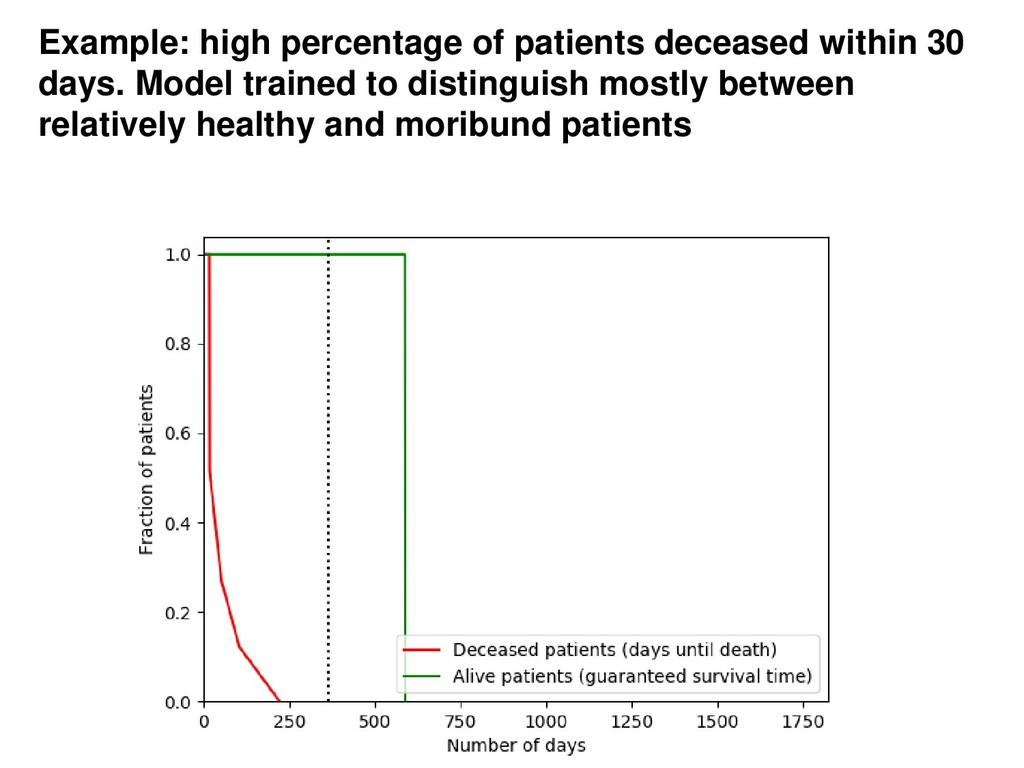
  36. C. Plot survival curves • Consider binary classification tasks –

    Event of interest (e.g. death) either happens or not before censoring time • Survival curve: distribution of time to event and time to censoring
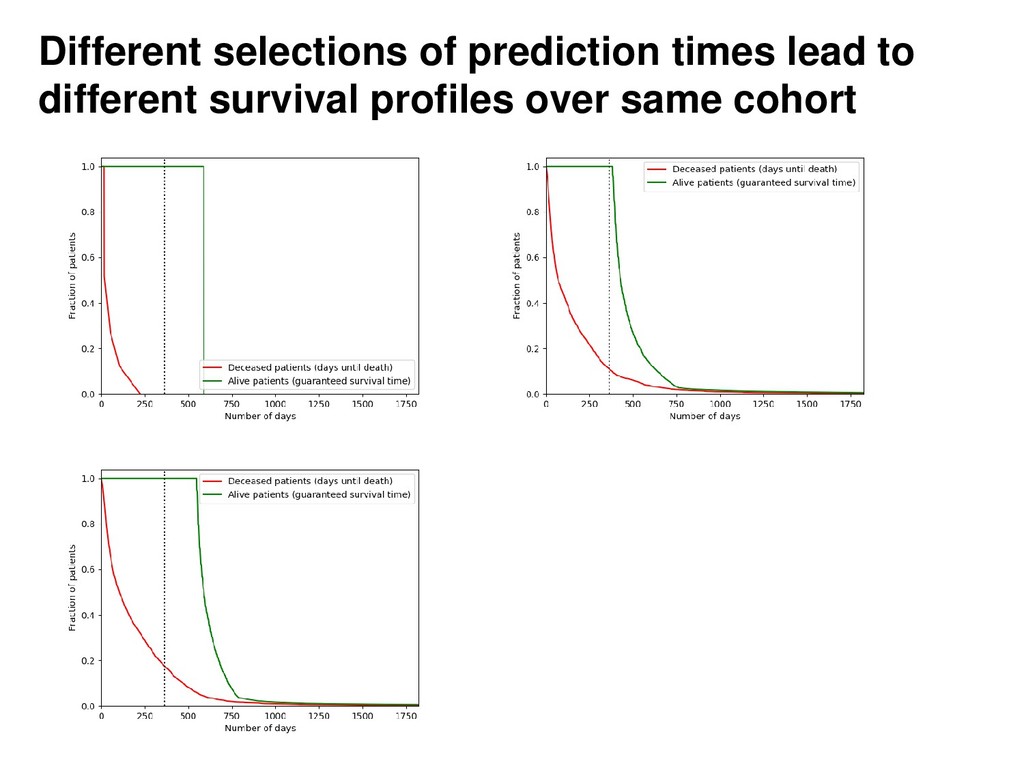
  37. Example: high percentage of patients deceased within 30 days. Model

    trained to distinguish mostly between relatively healthy and moribund patients
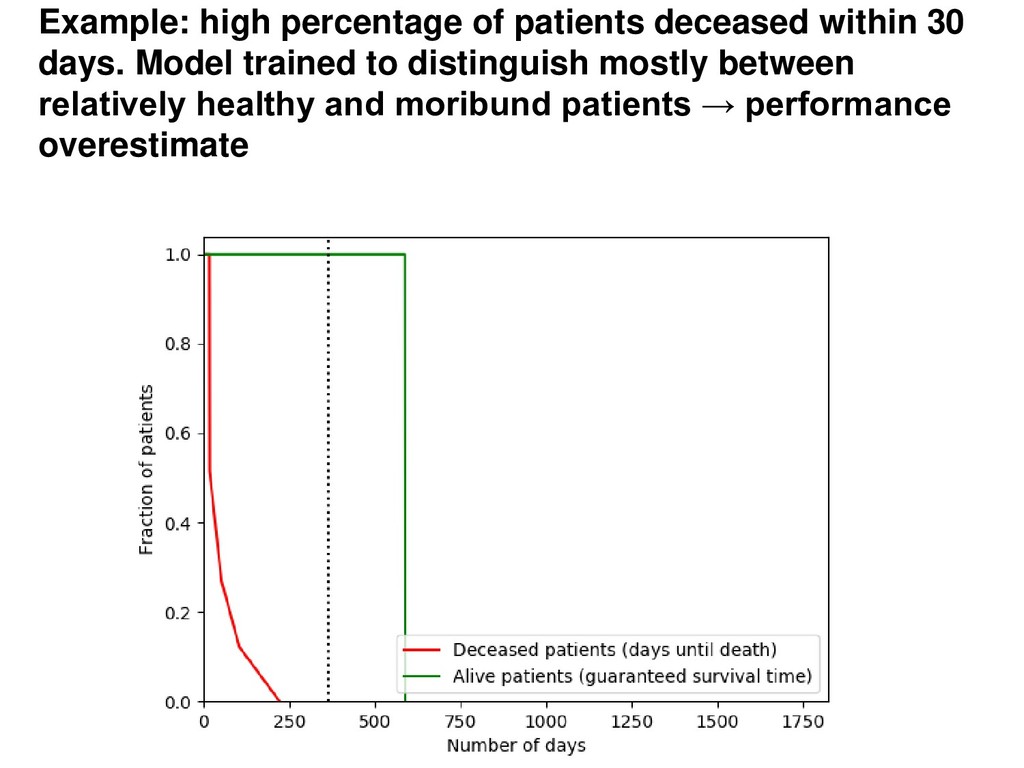
  38. Example: high percentage of patients deceased within 30 days. Model

    trained to distinguish mostly between relatively healthy and moribund patients → performance overestimate
  39. Final Remarks • Outliers should not to be treated like

    anomalies • Split train (CV) and test sets temporally • Metrics: – ROC AUC alone could be misleading – Precision-Recall curve often more useful than ROC – Compare with meaningful benchmarks • Performance possibly overestimated for cohorts with unrealistic survival curves