Upgrade to Pro — share decks privately, control downloads, hide ads and more …

Hulamin Audited results for the year ended 31 December 2014

Hulamin Audited results for the year ended 31 December 2014

Emptyhead Productions

February 23, 2015
Tweet

Other Decks in Business

Transcript

  1. 3 KEY POINTS – YEAR TO 31 DECEMBER 2014 •

    Record normalised earnings of R355m, an increase of 76% • Improved contributions from key product streams • Rand/USD exchange rate 12% weaker on average (2013: 17%) • Headline earnings per share increase by 96% over 2013 • Resumption of dividend payments with 25cps to be paid in March • Excellent safety performance – only 2 LTIs • 3% growth in Rolled Products sales volumes to 196 000 tons • Commercial production of can body stock successfully launched • Strong operating cash flow of R518m • Substantial increase in capex and reduction in borrowings • Acquisition of Bayside casthouse by Hulamin / Bingelela consortium • Aluminium recycling plant set to ramp up Q3 2015 • New B-BBEE transaction and ESOP announced
  2. 4 STRATEGIC OBJECTIVES REFOCUSED PREVIOUS OBJECTIVES CURRENT EMPHASIS & FOCUS

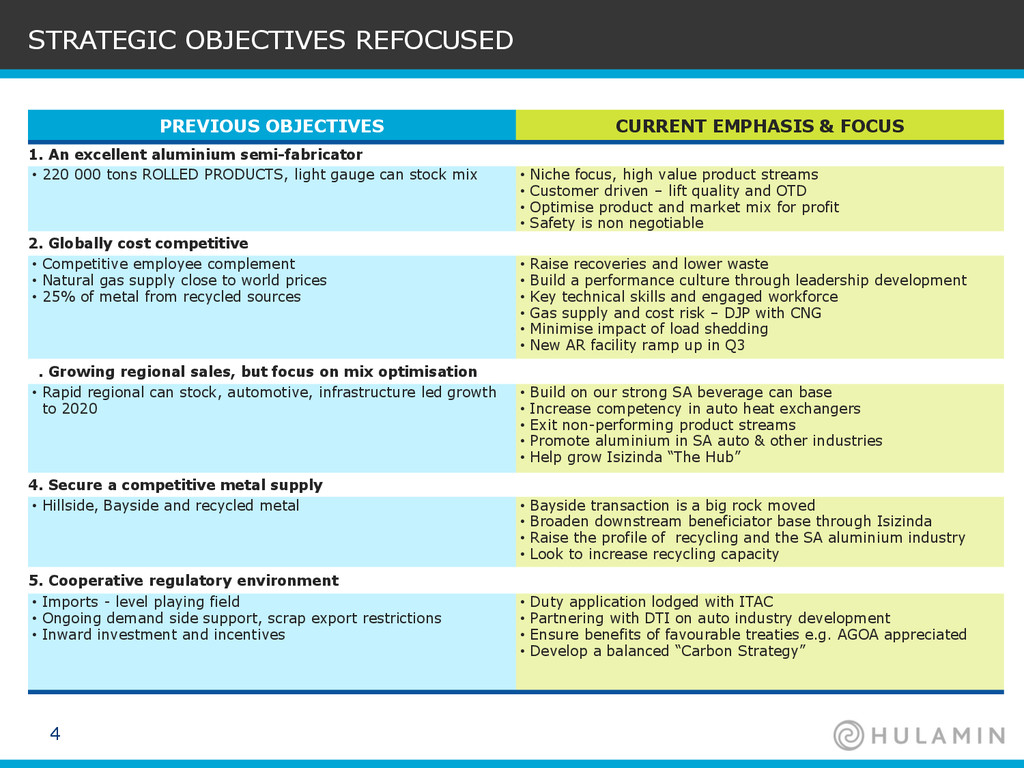
    1. An excellent aluminium semi-fabricator • 220 000 tons ROLLED PRODUCTS, light gauge can stock mix • Niche focus, high value product streams • Customer driven – lift quality and OTD • Optimise product and market mix for profit • Safety is non negotiable 2. Globally cost competitive • Competitive employee complement • Natural gas supply close to world prices • 25% of metal from recycled sources • Raise recoveries and lower waste • Build a performance culture through leadership development • Key technical skills and engaged workforce • Gas supply and cost risk – DJP with CNG • Minimise impact of load shedding • New AR facility ramp up in Q3 3. Growing regional sales, but focus on mix optimisation • Rapid regional can stock, automotive, infrastructure led growth to 2020 • Build on our strong SA beverage can base • Increase competency in auto heat exchangers • Exit non-performing product streams • Promote aluminium in SA auto & other industries • Help grow Isizinda “The Hub” 4. Secure a competitive metal supply • Hillside, Bayside and recycled metal • Bayside transaction is a big rock moved • Broaden downstream beneficiator base through Isizinda • Raise the profile of recycling and the SA aluminium industry • Look to increase recycling capacity 5. Cooperative regulatory environment • Imports - level playing field • Ongoing demand side support, scrap export restrictions • Inward investment and incentives • Duty application lodged with ITAC • Partnering with DTI on auto industry development • Ensure benefits of favourable treaties e.g. AGOA appreciated • Develop a balanced “Carbon Strategy”
  3. 6 SALIENT FEATURES & KEY DRIVERS 2014 2013 Key parameters

    and activities Average LME $ 1 866 1 844 Geographic premiums $ 376 247 Average exchange rate R / $ 10.85 9.66 Group sales volume tons 214 370 210 978 Rolled Products sales volume tons 196 248 190 253 Group turnover Rm 8 039 7 560 Average rolling margins (Rolled Products) $ 1 419 1 395 Profitability and asset management Group EBIT Rm 585 (1 805) Rolled Products EBIT Rm 521 (1 864) Group EBITDA (excluding impairment) Rm 660 527 EBITDA / turnover % 8.2 7.0 ROE % 9.9 4.5 HEPS cps 112 57 Normalised EPS cps 111 63
  4. 7 SALIENT FEATURES & KEY DRIVERS | CONTINUED 2014 2013

    Financial, cash flow and borrowings Capital expenditure Rm 335 148 Cash flow before financing activities Rm 183 135 Net borrowings Rm 437 612 Debt equity ratio % 11 18 NAV per share cps 1 200 1 066 Share price cps 810 515
  5. 8 CONDENSED INCOME STATEMENT 2014 Rm 2013 Rm Revenue 8

    039 7 560 Cost of sales (7 120) (6 915) Gross profit 919 645 Selling, marketing, distribution and administrative expenses (492) (461) Impairment reversal / (charge) 43 (2 122) Other gains and losses 115 133 Operating profit/(loss) 585 (1 805) Net interest expense (46) (63) Profit/(loss) before tax 539 (1 868) Taxation (154) 523 Net profit/(loss) for the year 385 (1 345) EBITDA (excluding impairment) 660 527 EBITDA/Sales (%) 8.2 7.0
  6. 9 OPERATING PROFIT 2014 Rm 2013 Rm Change Rm Operating

    profit / (loss) 585 (1 805) 2 390 Impairment (reversal) / charge (43) 2 122 Loss on disposal of fixed assets 6 - "Headline EBIT" 548 317 231 Severance costs - 26 Transaction costs 10 - PRMA past service cost adjustment (16) - "Normalised EBIT" 542 343 199 Timing mismatches - (10) Metal price lag (53) 58 "Comparable EBIT" 489 391 98 Estimated impact of Rand weakening 12% on average (17% 2013) 198 246
  7. 10 NORMALISED EARNINGS 2014 Rm 2013 Rm Earnings 385 (1

    345) (Profit)/loss on disposal and impairment of assets (27) 1 528 Headline earnings 358 183 Abnormal items included in headline earnings Transaction costs 8 - PRMA past service cost adjustment (11) - Severance costs - 18 Normalised earnings 355 201 Net cost of hot mill failure: - (7) Loss of profit and material damage - 17 Insurance claim accrued - (24) Normalised earnings adjusted for timing mismatches 355 194
  8. 11 NORMALISED EARNINGS VS. RATE OF EXCHANGE 0 2 4

    6 8 10 12 14 0 50 100 150 200 250 300 350 400 2007 2008 2009 2010 2011 2012 2013 2014 R million Rand / Dollar Exchange Rate Average Rand / Dollar Exchange Rate
  9. 12 HEADLINE EARNINGS PER SHARE VS. SALES VOLUMES 0 20

    40 60 80 100 120 0 50 100 150 200 250 2007 2008 2009 2010 2011 2012 2013 2014 Sales volume („000 tons) RP Local Sales RP Export Sales HEPS HEPS (cents) HEPS (cents)
  10. 13 BALANCE SHEET Dec 2014 Rm Dec 2013 Rm Capital

    employed Equity 3 834 3 403 Net borrowings 437 612 4 271 4 015 Employment of capital Property, plant and equipment and intangibles (incl. asset held for sale) 2 812 2 553 Retirement benefit asset 139 161 Net working capital (including derivatives) 2 009 1 903 Net deferred tax liability (453) (377) Retirement benefit obligations (236) (225) 4 271 4 015
  11. 14 NET BORROWINGS 0 500 1 000 1 500 2

    000 2007 2008 2009 2010 2011 2012 2013 2014 R million Net Borrowings Available Facilities
  12. 15 WORKING CAPITAL Dec 2014 Rm Dec 2013 Rm Change

    Rm % Inventories 1 959 1 807 152 8% Trade and other receivables 1 038 972 66 - Trade receivables 931 827 104 13% - Other receivables 107 145 (38) Trade and other payables (965) (826) (139) - Trade payables (780) (642) (138) 21% - Other payables (185) (184) (1) 2 032 1 953 79 4% Net derivatives/other (23) (50) 27 Net working capital 2 009 1 903 106
  13. 16 CASH FLOW STATEMENT 2014 Rm 2013 Rm Cash flows

    from operating activities Operating profit /(loss) 585 (1 805) Net interest paid (51) (64) Impairment (reversal) / charge (43) 2 122 Depreciation and other non-cash items 191 269 Income tax payment (85) (28) Changes in working capital (79) (211) 518 283 Cash flows from investing activities Additions to property, plant and equipment and intangibles (335) (148) (335) (148) CASH FLOWS BEFORE FINANCING ACTIVITIES 183 135 Cash flows - equity transactions & other (8) (5) NET BORROWINGS – BEGINNING OF PERIOD (612) (742) NET BORROWINGS – END OF PERIOD (437) (612)
  14. 18 TRADING ENVIRONMENT 2014 Rolled Products market competition and pricing

    • Major capacity expansion in Asia continues –affects pricing • Conversion prices lag metal premium escalations in commodity products (margin pressure) Economic indicators • LME price remained relatively weak <US$2 000/ton for most of 2014 • Geographic premiums increased further during 2014 • Rand weakened against US$ by 12% in 2014 over 2013 Key market developments • Global focus on automotive capacity – body sheet • USA, Asian, Middle East markets show good growth, European market flat • Local markets see continued growth of beverage cans • Increased levels of imported extrusions and rolled products
  15. 19 MARKET ENVIRONMENT & HULAMIN PERFORMANCE 2014 Ref: CRU and

    Hulamin own views Overall market North America • Significant focus on Auto growth • Strong demand in HT Plate • Major increase in Chinese commodity imports • Hulamin shows strong performance growth • Achieved significant margin improvement in HT plate • Wins Tesla supply contract 2014 25% 2013 23% Hulamin Europe • Stable demand • Strong competition amongst European mills • Retained key beverage & auto contracts • Exit „unprofitable‟ business 2014 20% 2013 20% Asia • Major capacity expansion • Significant pricing pressure • Drop in prices achieved • Phase withdrawal from low priced contracts • Replace with Australian & local volumes 2014 8% 2013 11% South Africa • Demand growth, particularly beverage cans • Increased pressure from imports (esp. China) • Strong growth in local beverage categories 2014 37% 2013 35% Rest of the world 2014 10% 2013 11%
  16. 20 ROLLED PRODUCTS – KEY FEATURES 0 50 100 150

    200 250 2007 2008 2009 2010 2011 2012 2013 2014 Tons (000's) Sales Volume Local Sales Export Sales 120 125 130 135 140 145 2007 2008 2009 2010 2011 2012 2013 2014 US$ Margin Index 90 100 110 120 130 2007 2008 2009 2010 2011 2012 2013 2014 Unit Cost Index in 2007 Rands 50 55 60 65 2007 2008 2009 2010 2011 2012 2013 2014 % High Value Products
  17. 21 RELATIVE PROFIT CONTRIBUTION* BY PRODUCT STREAM 2014 % 2013

    % Can End Stock 37 38 Can Body Stock 2 - Heat-Treated Plate 22 22 Other Plate 6 6 Automotive 14 13 Foil 3 4 Other 16 17 Total 100 100 * Rolling margin less direct costs
  18. 22 ROLLED PRODUCTS OPERATING MARGIN IN RANDS 80 90 100

    110 120 130 140 150 160 170 180 2007 2008 2009 2010 2011 2012 2013 2014 Indexed Unit Cost in Rand / ton Margin in Rand / ton
  19. 23 MANUFACTURING – “IN SEARCH OF EXCELLENCE” Why move up

    the value chain? • Products sell at a price determined by complexity and scarcity • Logistics costs are driven by volume not value • Purchasers of high value products demand higher standards and service levels • Formal qualification of products provides additional barriers to entry • Critical applications demand alternate suppliers 6 Key capabilities required to move up 1. High technical competency – equipment and skills 2. Reliable, stable and consistent manufacturing output and therefore inputs 3. Ability to always meet customer delivery requirements i.e. OTD 4. Back office that performs to the same standards 5. Ability to provide 180-day terms 6. Clear focus on the customer
  20. 24 MANUFACTURING – “IN SEARCH OF EXCELLENCE” | CONTINUED Improving

    our processes • Reduce product variants and changeovers – simplify • Utilise linkages to providers of technology and benchmark frequently • Improve planning and sequencing functions • Manage our key product streams holistically from order to consumption Improving our equipment • Increased spend on maintenance • Investment in strategic spares • Upgrade process control and early detection quality systems Increasing our productivity • Safety is a non-negotiable • Building a culture of accountability • Developing leadership • Engaging our employees
  21. 25 ROLLED PRODUCTS OPERATIONAL PERFORMANCE TARGETS Progress on targets Revised

    assumptions 2014 Sales volume 220 000 tons 196 247 tons Yield >67% 65% Total unit cost (excl distribution) US$1 175 per ton US$1 130 per ton Rolling margin US$1 400 per ton US$1 419 per ton Stock and debtors cash cycle 120 days 136 days
  22. 26 CAPITAL EXPENDITURE 0 100 200 300 400 500 600

    700 800 2007 2008 2009 2010 2011 2012 2013 2014 R million Normal capital expenditure * Project capital expenditure * Depreciation * Excludes capitalised borrowing costs
  23. 27 SAFETY PERFORMANCE AND STRATEGY Record safety performance • 2

    lost time injuries, no fatalities - LTIFR 0,09 - TRCFR 0,66 • Ongoing risk mitigation through world class, fully integrated systems • Strategy roll out 2014 – 2016 • Spend of R16m on shopfloor safety systems in 2014 (R18m p.a. planned for next 2 years) • Focused risk management program
  24. 28 SAFETY – FREQUENCY RATES 0.00 0.50 1.00 1.50 2.00

    2007 2008 2009 2010 2011 2012 2013 2014 TRCFR LTIFR *The Total Recordable Case Frequency Rate (TRCFR) and the Lost Time Injuries Frequency Rate (LTIFR) is the number of recordable injuries divided by the number of hours worked, multiplied by 200 000
  25. 29 GROUP EXPENSES BY NATURE 2014 Rm 2013 Rm Aluminium

    and other material costs 5 381 5 326 Utilities and other direct manufacturing costs 637 575 Employment costs 776 763 Depreciation and amortisation 118 210 Repairs and maintenance 204 177 Freight and commissions 326 327 Other operating income and expenditure 170 (2) 7 612 7 376 Classified as: Cost of sales 7 120 6 915 Selling, marketing and distribution expenses 403 390 Administrative and other expenses 89 71 7 612 7 376
  26. 30 GROWING REGIONAL SALES Beverage can market growth in progress

    • Aluminium cans in SA successfully introduced. Hulamin successfully qualified • Over 5 000 tons of can body stock successfully supplied in 2014 • 14 000 tons planned to be supplied in 2015 • Can end contract for local and regional supply offers further growth prospects Additional focus on other key market segments • Regional automotive strategy feasibility on auto body sheet in process • Renewed contracts signed for high tech applications in SA and global markets (Tesla 6061 plate, Mahle Auto HEX) Other regional market development strategies • Reviewing regional opportunities in distributor products • Fabrication and entrepreneurship programmes introduced in 2014
  27. 31 LONG–TERM METAL SUPPLY Slab supply from Bayside casthouse runs

    to Isizinda effective date • Bayside smelter closed June 2014 but slab casting continues • Liquid metal is now supplied by Hillside • Isizinda effective date determined by Competition Commission approval • 5 Year metal deal with BHP and matching slab offtake agreement to Hulamin Goal: To source 25% of metal units from third party scrap by 2018 • R300m investment in recycling capability approved and underway • Project includes scrap storage, separation, cleaning and melting • Ramp-up Q3 2015; interim plans in place Aluminium and Electricity • Aluminium supply security and beneficiation growth (slab, billet, melting ingot) • Strategic cooperation/alignment with stakeholders – Government and BHP Billiton
  28. 32 ISIZINDA (“THE HUB”) Background • In 2009 BHP Billiton

    announced closure of aluminium casthouse at Bayside and their intention to concentrate on production of melting ingot at Hillside • Casting facilities for certain aluminium valued-added products (VAPs), rim alloy, wire rod and extrusion billet, were mothballed by 2009 with the closure of the rolling slab facility planned for 2012 • Slab facility has continued to operate pending an acceptable long-term solution around the casthouse • Bayside provides Hulamin Rolled Products with c.100kt rolling slab p.a. (one-third of Hulamin‟s requirements) Acquisition of Bayside casthouse by Isizinda Aluminium • The sale of Bayside casthouse to Isizinda Aluminium was announced in November 2014, and is subject to Competition Commission approval Ownership and operation of Isizinda Aluminium • Isizinda Aluminium is a strategic partnership between BEE empowerment group, Bingelela Capital (60%) and Hulamin (40%) • Hulamin is the appointed strategic operator of the casthouse
  29. 33 ISIZINDA (“THE HUB”) | CONTINUED Supply agreements • Isizinda

    Aluminium has concluded a 5-year metal supply agreement, whereby liquid metal will be supplied from Hillside • Hulamin has concluded a matching 5-year rolling slab off take agreement with Isizinda Potential and growth • Vision of Isizinda is to unlock potential of aluminium and aluminium beneficiated products within South Africa by being the conduit for liquid aluminium to the downstream industry and seeing the restart of the production of a number of key aluminium VAP lines • Discussions are being held with key stakeholders to assess possibility of restarting the mothballed VAP casting lines: - Wire Rod » Used mainly in electrical transmission applications (conductivity and non-corrosive) - Extrusion Billet » Feedstock for extruded products - Rim Alloy » Used in the manufacture of aluminium alloy wheels
  30. 34 GAS SUPPLY Gas format and delivery options • Secure

    reliable supply • Reduce unit cost of gas/energy Allow for changing gas demand at Hulamin • Flexible supply with redundancy Infrastructure development • Aligned with future developing gas landscape in South Africa • Ownership of infrastructure, small scale liquefaction plant, pipelines Internal engineering projects • Reticulation, burners, control systems
  31. 35 GAS ENERGY COST INITIATIVES GAS SUPPLY | CONTINUED Gas

    Supply Options Delivery Timeline Other Key Considerations Phase 1 Virtual Pipe Network Compressed Natural Gas (CNG) (Methane Rich Gas via Lilly Pipeline) June 2015 Order placed for equipment, compressors, trailers Minimal Capex required at HLM Regulatory approval process initiated Phase 2 Preferred Option Piped Gas (Methane Rich Gas via Lilly Pipeline into DJP) 3 – 4 years In discussion with various parties to unlock this opportunity A feasibility study into the conversion of the DJP to gas is to be undertaken by TPL Phase 2 Alternative Option Liquefied Natural Gas (LNG) (Liquefaction - small scale plant) 12 – 18 months Modular concept - capex of R180m to size for Hulamin Additional regulatory approvals and extended commitment period LNG Imported 3 – 4 years No import infrastructure although on Portnet radar – facilities not earmarked for Durban Global traded value – significantly higher than piped gas
  32. 36 SUPPORTIVE REGULATORY ENVIRONMENT Enabling Government Policy • Curbing of

    scrap exports policy in operation for 18 months • Improvements in policy implemented • Growth in recycling of aluminium is a global trend • Hulamin R300 million recycling plant on track • Used Beverage Can recycling very much linked with - job creation - environmental benefits - local Can Body Stock supply • Tariff protection essential for local Can Body Stock long-term sustainability
  33. 37 A CASE FOR IMPORT TARIFF PROTECTION In 2011 ITAC

    • Awarded partial relief to extrusions, and • Rejected rolled products application Post 2011 • Imports of extruded and rolled products continued to increase • Uneven tariff regimes in SA trade partners especially in BRICS remain • A group of products sold by Hulamin in Brazil attract 12% duty, whilst similar imports from Brazil attract zero duty in SA • Examples of import duties in rolled products • Hulamin application to ITAC in Q4 2014 for import tariff increases being reviewed Brazil Russia China India SA Duty % 12 20 5 6 0
  34. 38 PARTNERING WITH GOVERNMENT Ongoing Engagements • Partnership with others

    to access gas pipeline • Non-punitive and competitive carbon pricing lobbied • Continued competitiveness and investment support (e.g. MCEP) • Equitable and symmetrical import tariff regime • Investigations for local Automotive Body Sheet supply • Elevation of the strategic importance of aluminium industry to SA manufacturing • Support for government efforts towards continued inclusion of SA in AGOA renewal
  35. 39 REVIEW OF HULAMIN EXTRUSIONS Key indicators for 2014 •

    Revenue down 3% • Sales volume down 12% • Margins stable but under pressure • Unit costs up 17%, as a result of low throughput, absolute costs up 2% • Operating profit up by R6m
  36. 40 Background • 2007 B-BBEE transaction matured with limited vesting

    and empowerment • Terms of proposed replacement transaction announced December 2014 - Circular will be issued March 2015 for approval at AGM Rationale for proposed new transaction • Strategic industry – alignment with government objectives • Importance of transformation to Hulamin – range of initiatives • BEE rating - Maturing of initial transactions in 2012 and 2014 - Impact of proposed revised B-BBEE Codes on target - Access to government incentives • ESOP - facilitation of employee ownership, empowerment, retention • Strategic partners – commerciality / broad-base / achieve reasonable exit PROPOSED B-BBEE TRANSACTION
  37. 41 Accounting costs • Total accounting costs (R133m at R9.00

    per share) - IFRS 2 cost of c.4.1% of market capitalisation (R118m at R9.00 per share) - Cash costs (R15m) – transaction costs plus BEE support fee - Cost profile: » Year 1: Earnings impact of c.R47m, HEPS 14cps » Years 2 – 5: Earnings impact of c.R14m, HEPS 4cps Category % of total ordinary shares Nature of shares Term Dividend entitlement IFRS 2 cost as % of market cap ESOP 8.1% 15% grant / 85% appreciation rights 5 years Cash dividends on grant shares c.3.4% Strategic partner 9.3% 50% voting-only / 85% appreciation rights 8 years (5-year vesting) No entitlement c.0.7% (capped at R20m) Terms & structure PROPOSED B-BBEE TRANSACTION | CONTINUED
  38. 42 PROPOSED B-BBEE TRANSACTION | CONTINUED Years 1 to 5

    At vesting Shares entitled to vote % Shares entitled to cash dividends % % ESOP 31.5 million 8.1% 4.7 million 1.4% Strategic partner 36.0 million 9.3% - - Total BEE 67.5 million 17.4% 4.7 million 1.4% 2.5% - 6.5% Ordinary shareholders 319.6 million 82.6% 319.6 million 98.6% 93.5% to 97.5% TOTAL 387.1 million 100.0% 324.3 million 100.0% 100.0% Ordinary shareholder dilution
  39. 44 OUTLOOK • Global outlook is positive but markets are

    dynamic • Harness the ebb and flow of individual products and regions • Moving up the value chain demands manufacturing excellence • Stable to gentle weakening in the Rand/$ exchange rate would benefit • Strong beverage can demand in SA provides attractive opportunity • Aluminium recycling will provide alternate source of metal units • Isizinda will build local beneficiation and remove uncertainty • Electricity supply in SA will be key to both demand and output