Discovery of Possible Adverse Reactions Emir Muñoz Fujitsu (Ireland) Limited, Researcher Insight Centre for Data Analytics at NUI Galway, PhD Student Joint work with Vít Nováček and Pierre-Yves Vandenbussche November 15th, 2016 AMIA, Chicago, US
side effects between similar drugs. Formulate an extensible approach for Adverse Drug Events detection using linked open data sources. Learning Objectives
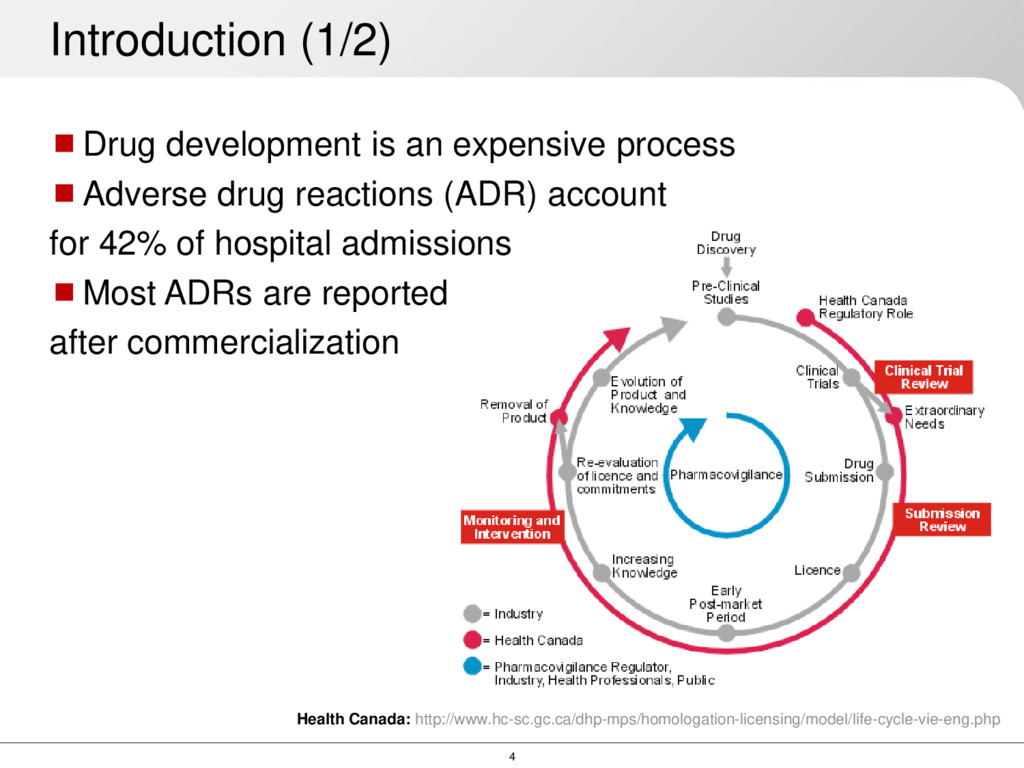
drug reactions (ADR) account for 42% of hospital admissions Most ADRs are reported after commercialization Health Canada: http://www.hc-sc.gc.ca/dhp-mps/homologation-licensing/model/life-cycle-vie-eng.php
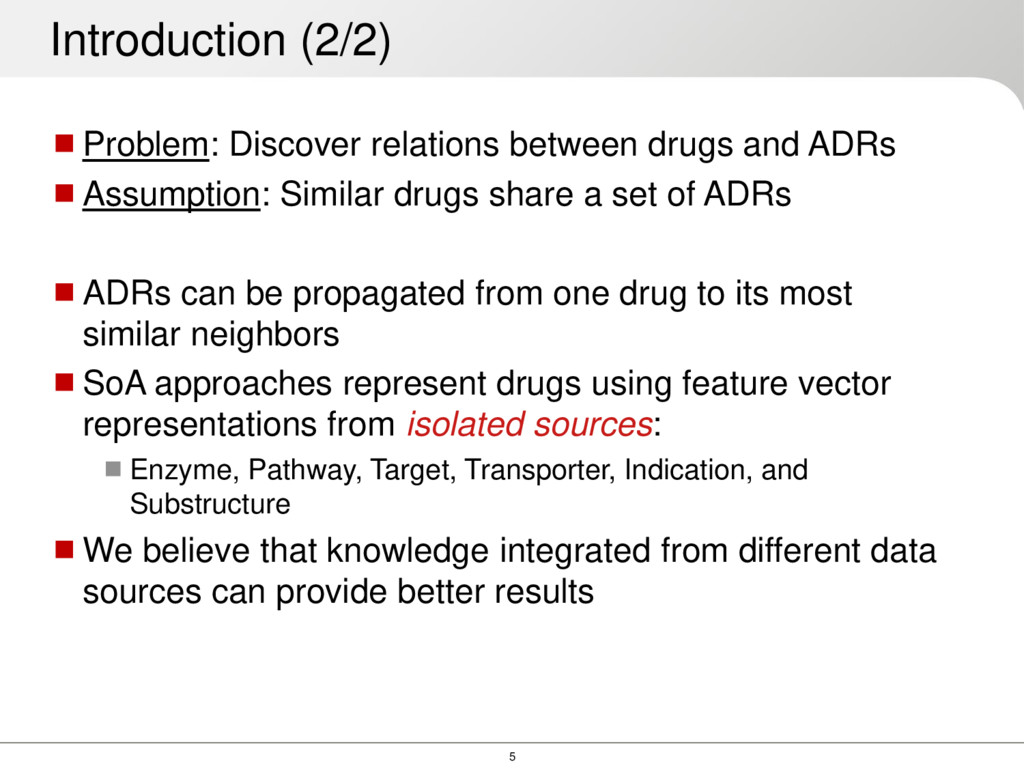
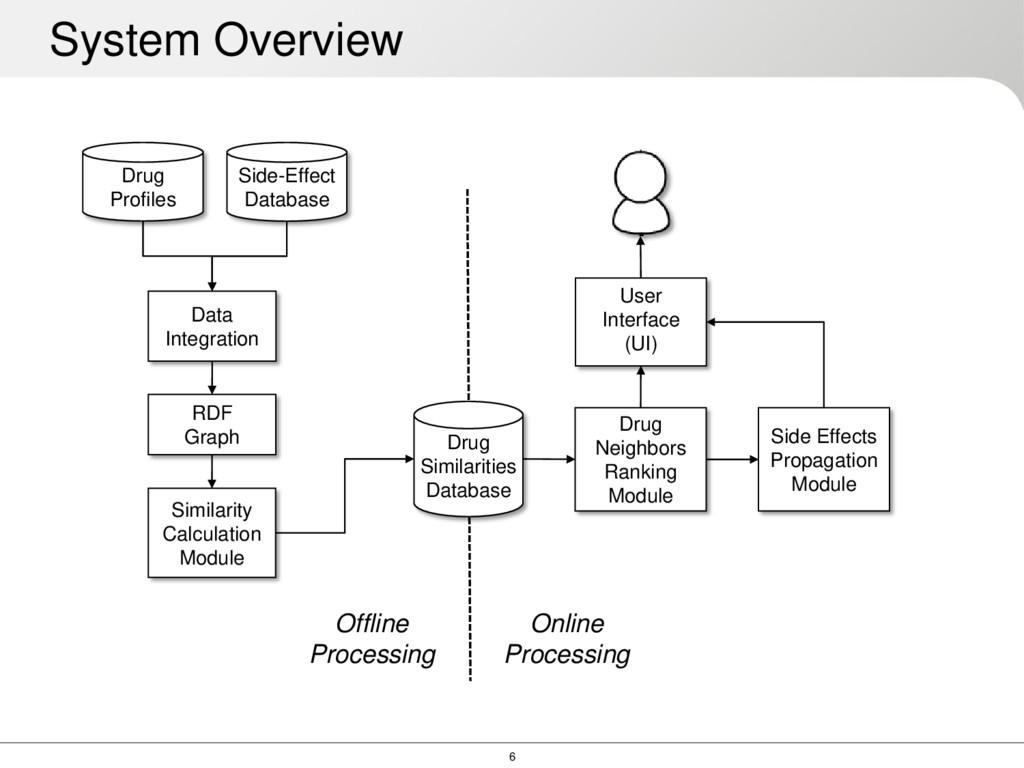
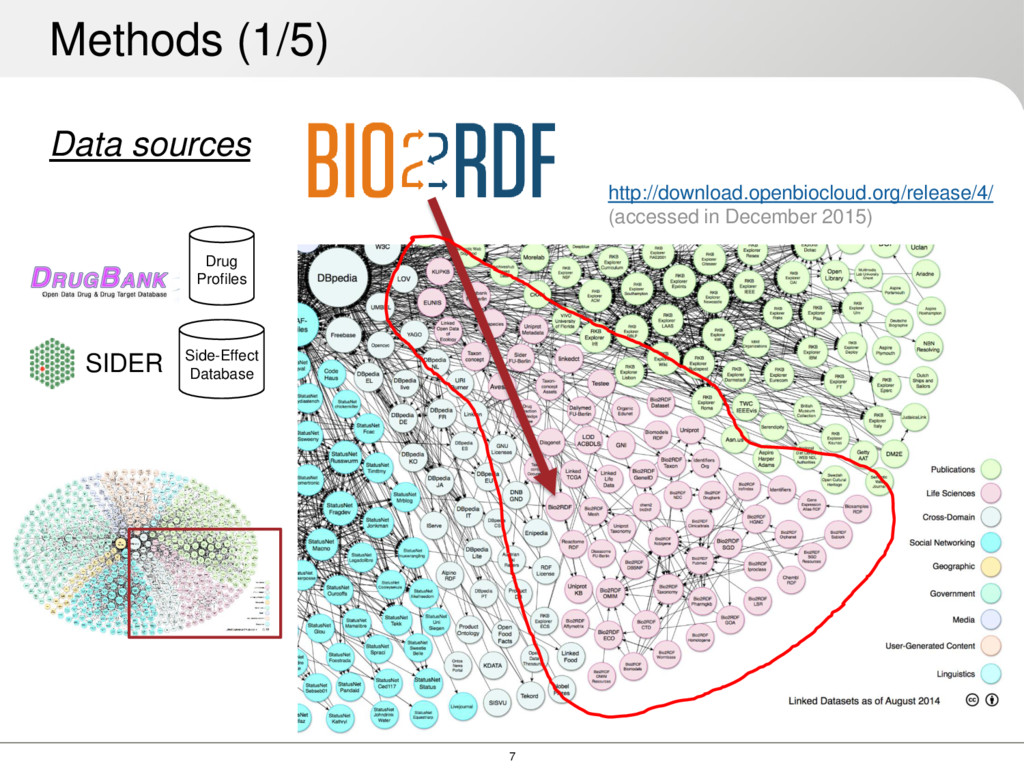
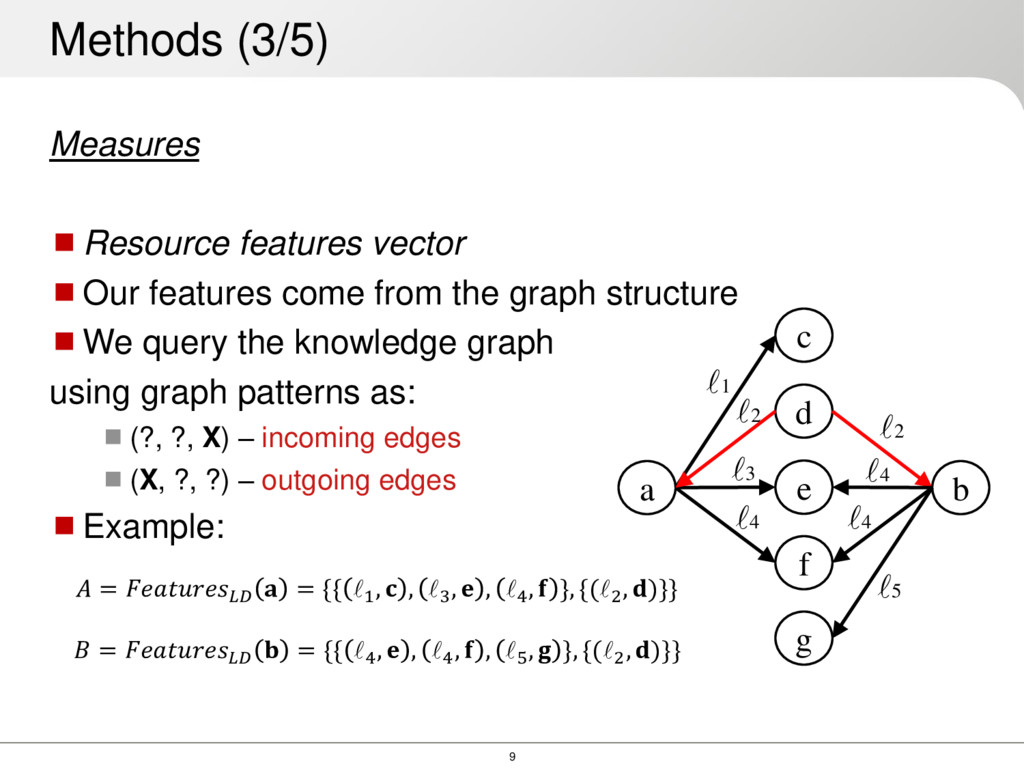
drugs share a set of ADRs ADRs can be propagated from one drug to its most similar neighbors SoA approaches represent drugs using feature vector representations from isolated sources: Enzyme, Pathway, Target, Transporter, Indication, and Substructure We believe that knowledge integrated from different data sources can provide better results Introduction (2/2)
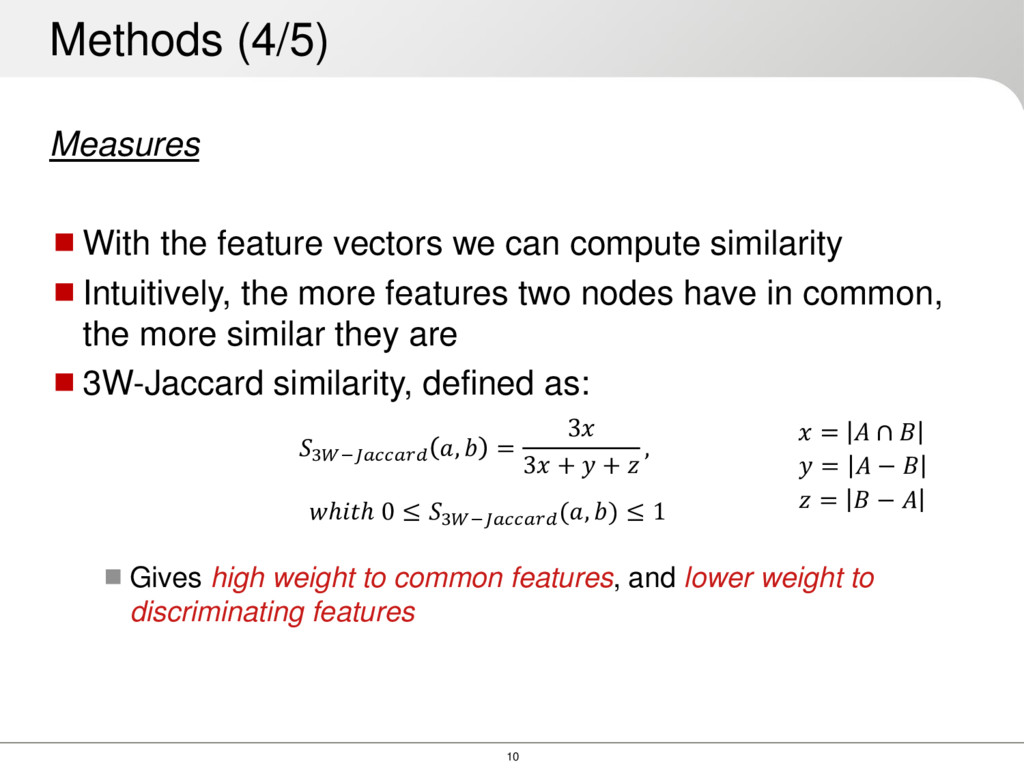
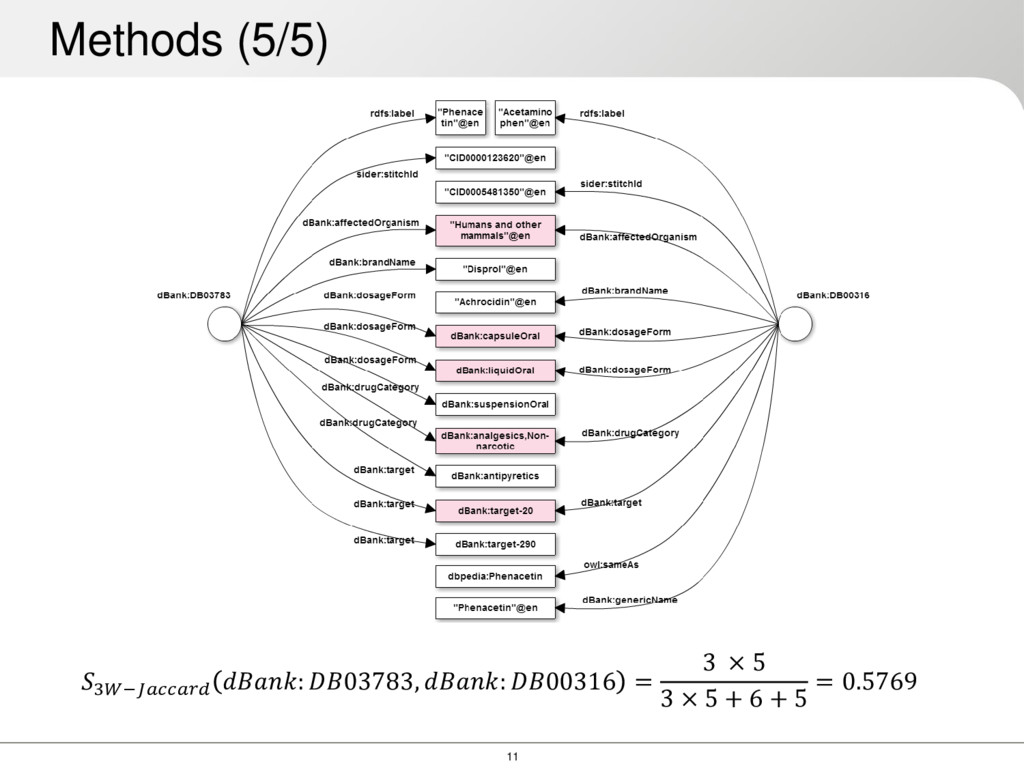
Intuitively, the more features two nodes have in common, the more similar they are 3W-Jaccard similarity, defined as: Gives high weight to common features, and lower weight to discriminating features Methods (4/5) 3− , = 3 3 + + , ℎℎ 0 ≤ 3− (, ) ≤ 1 = ∩ = − = −
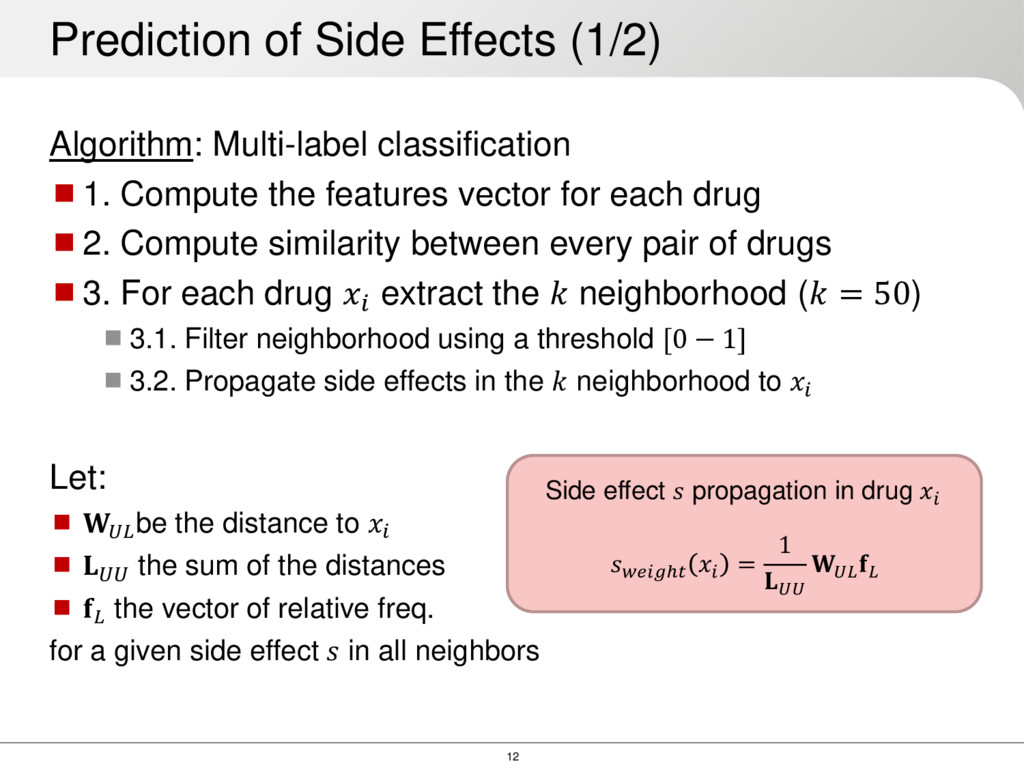
each drug 2. Compute similarity between every pair of drugs 3. For each drug extract the neighborhood ( = 50) 3.1. Filter neighborhood using a threshold [0 − 1] 3.2. Propagate side effects in the neighborhood to Let: be the distance to the sum of the distances the vector of relative freq. for a given side effect in all neighbors Prediction of Side Effects (1/2) ℎ = 1 Side effect propagation in drug
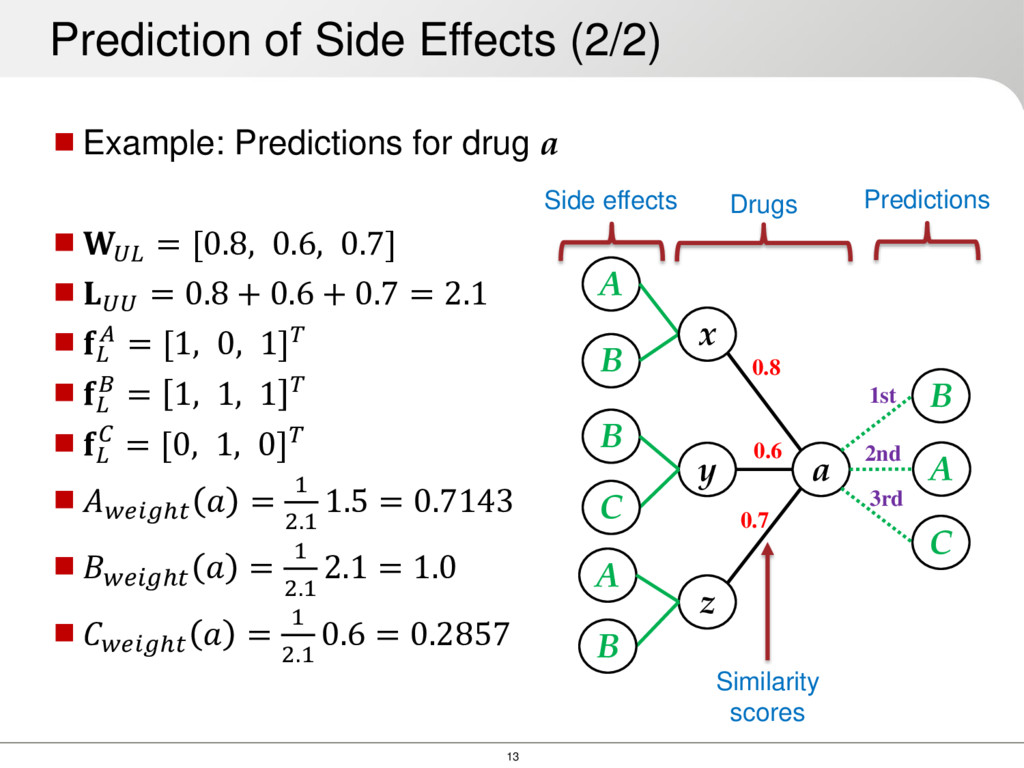
0.7] = 0.8 + 0.6 + 0.7 = 2.1 = [1, 0, 1] = 1, 1, 1 = [0, 1, 0] ℎ = 1 2.1 1.5 = 0.7143 ℎ = 1 2.1 2.1 = 1.0 ℎ = 1 2.1 0.6 = 0.2857 Prediction of Side Effects (2/2) a y B B A z C x 0.7 0.8 0.6 A B Drugs Side effects Similarity scores B A C Predictions 1st 2nd 3rd
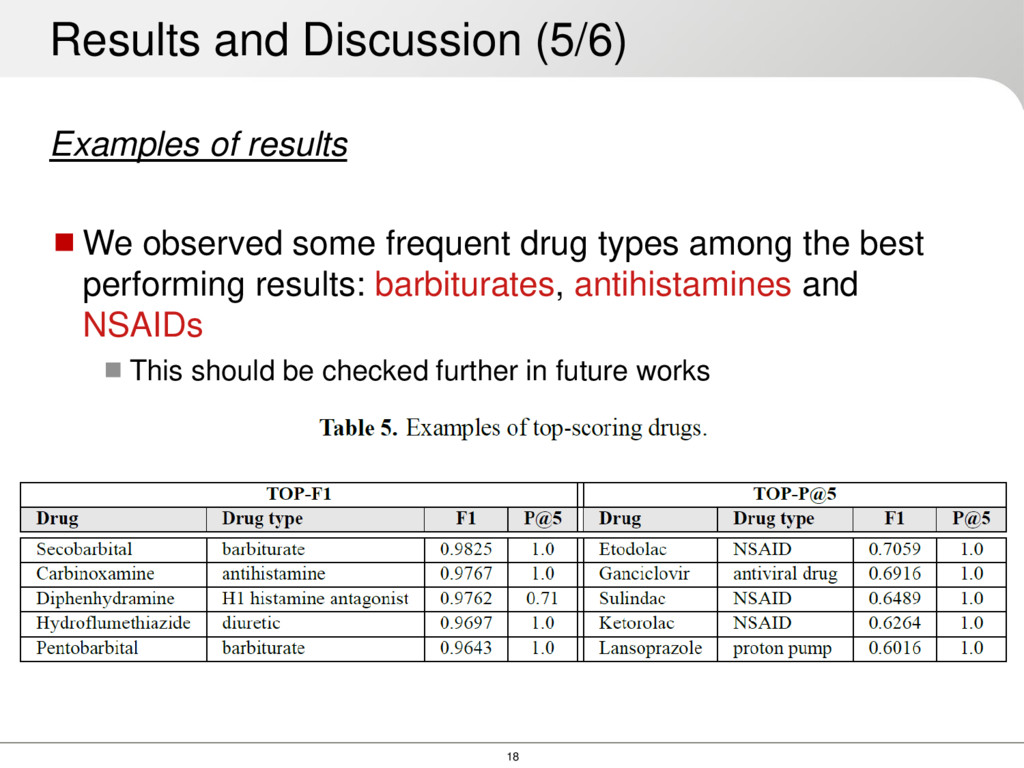
among the best performing results: barbiturates, antihistamines and NSAIDs This should be checked further in future works Results and Discussion (5/6)
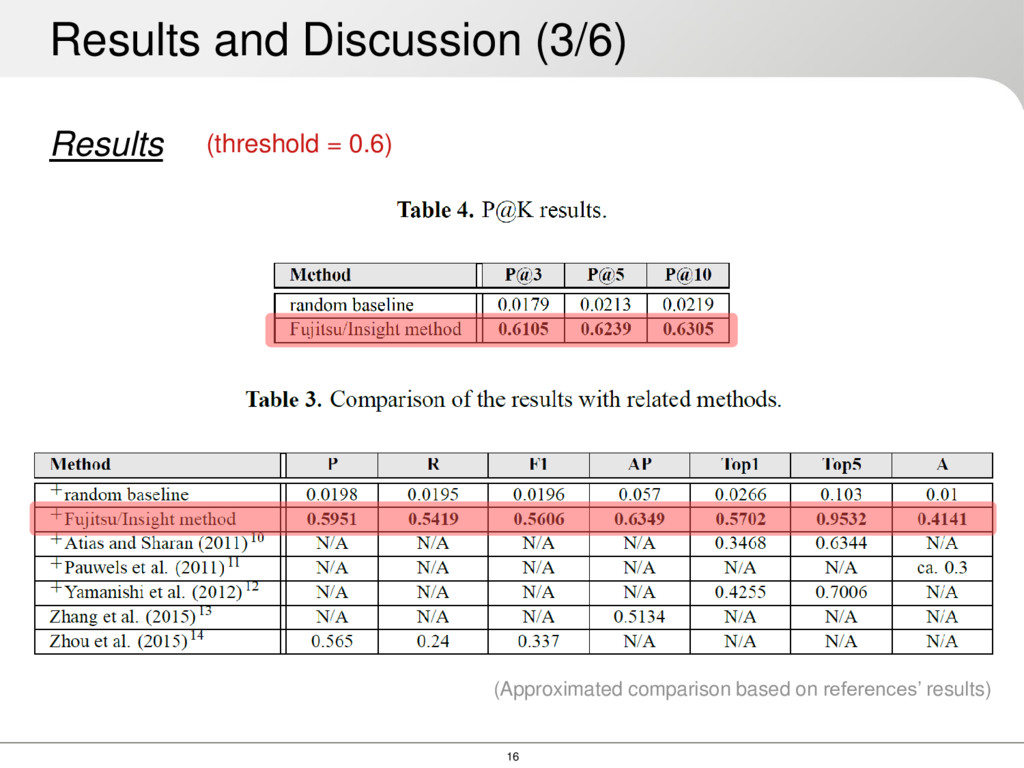
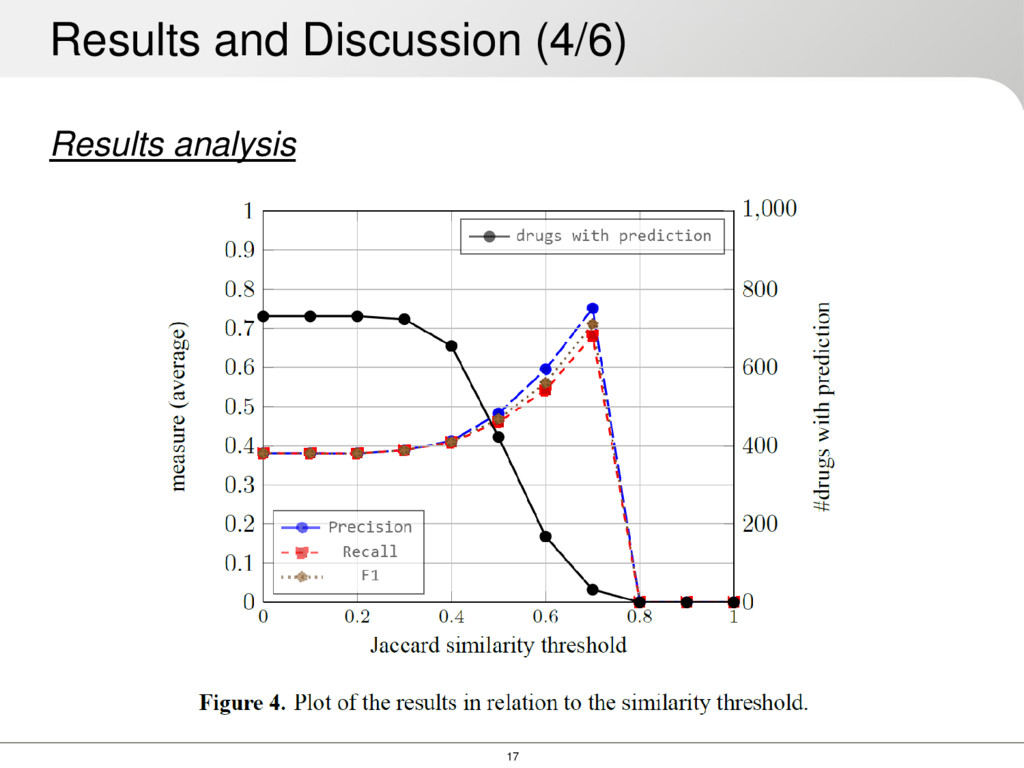
can make Which delivers good results until the 0.6 cut-off Previous approaches treat the problem only as classification or only as ranking We tried to mix both approaches and compare as much as we can There is no clear gold-standard out there SIDER seems to be the best option at the moment for sort of formal benchmarking • (We are working on a method using FDA reports and AEOLUS data set for complementary evaluation) Results and Discussion (6/6)
adverse reactions Graph-based similarities show promising results Next steps Propagation using graph regularization Gaussian label propagation Inclusion of more drug- and disease- related Bio2RDF data sets in our knowledge graph Test path features over the knowledge graph to compute similarity between drugs Conclusions and Future Work Thank you!