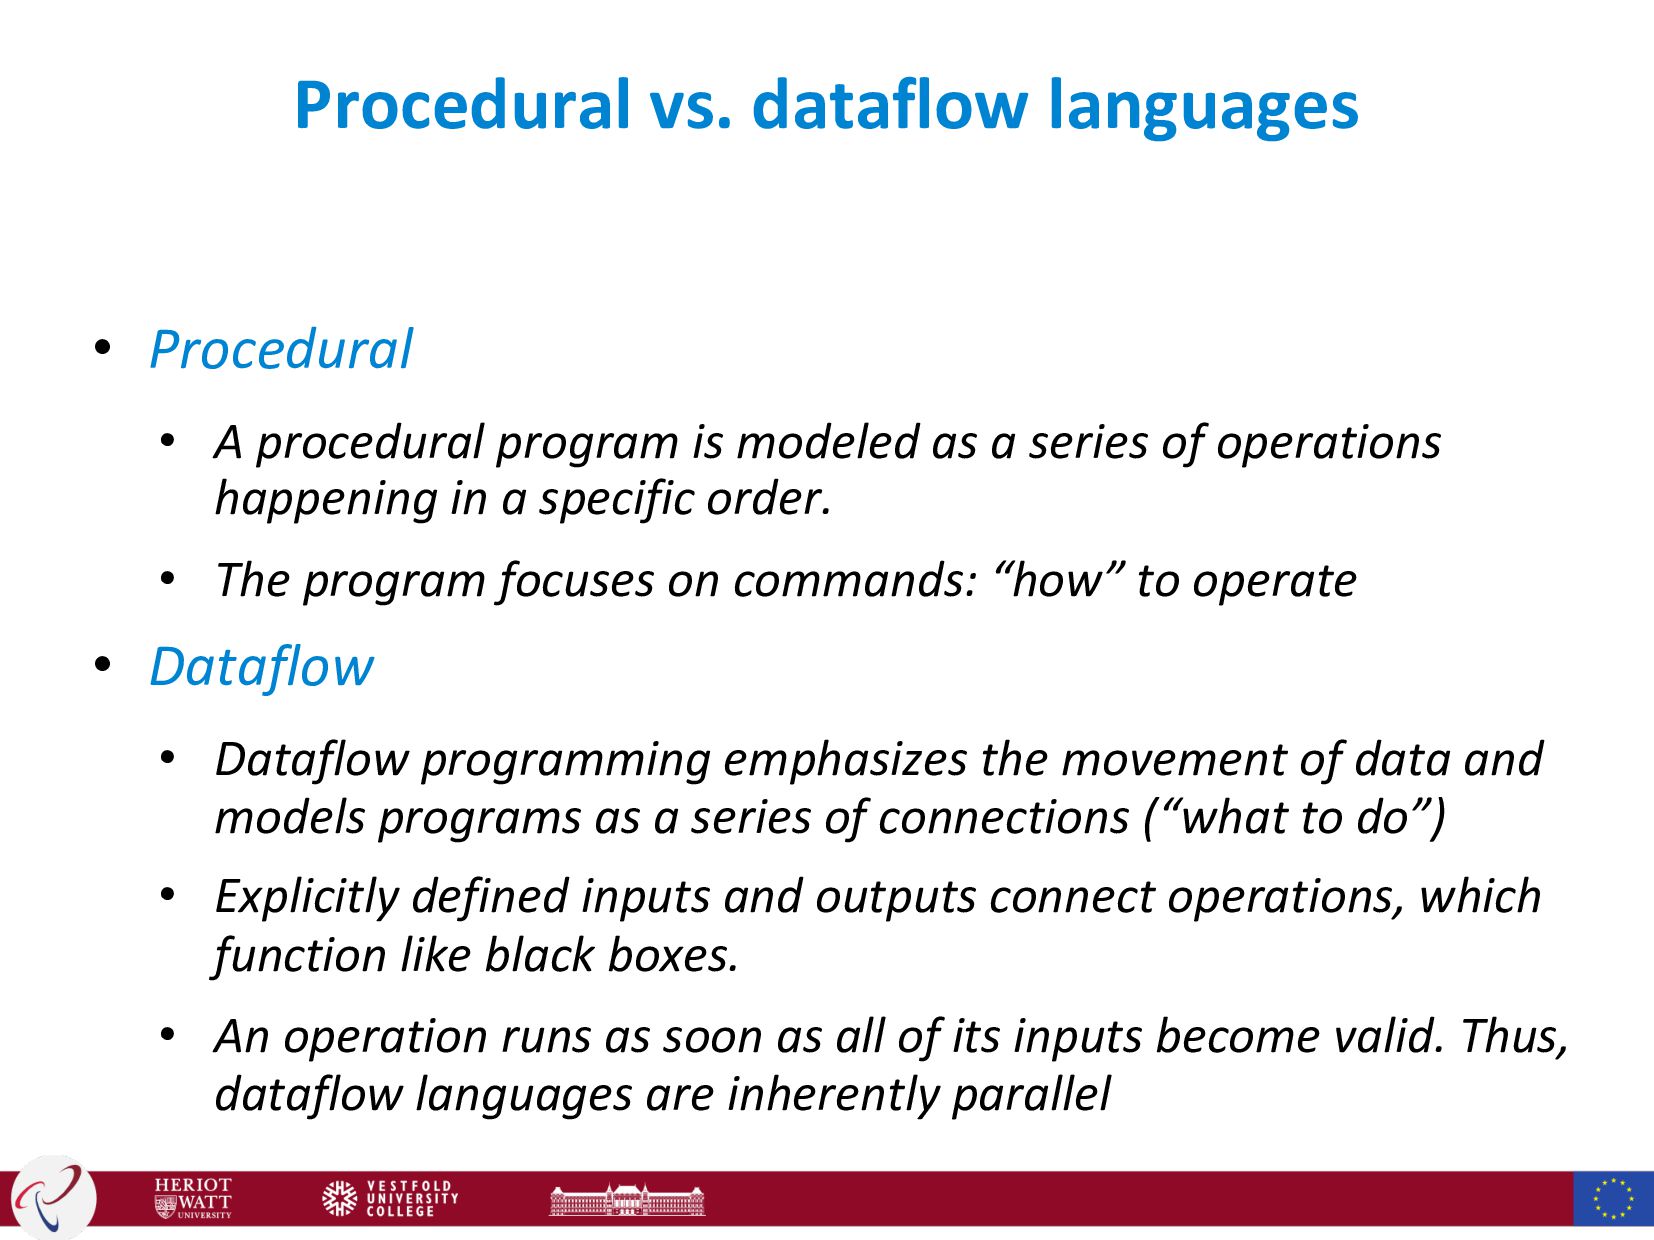
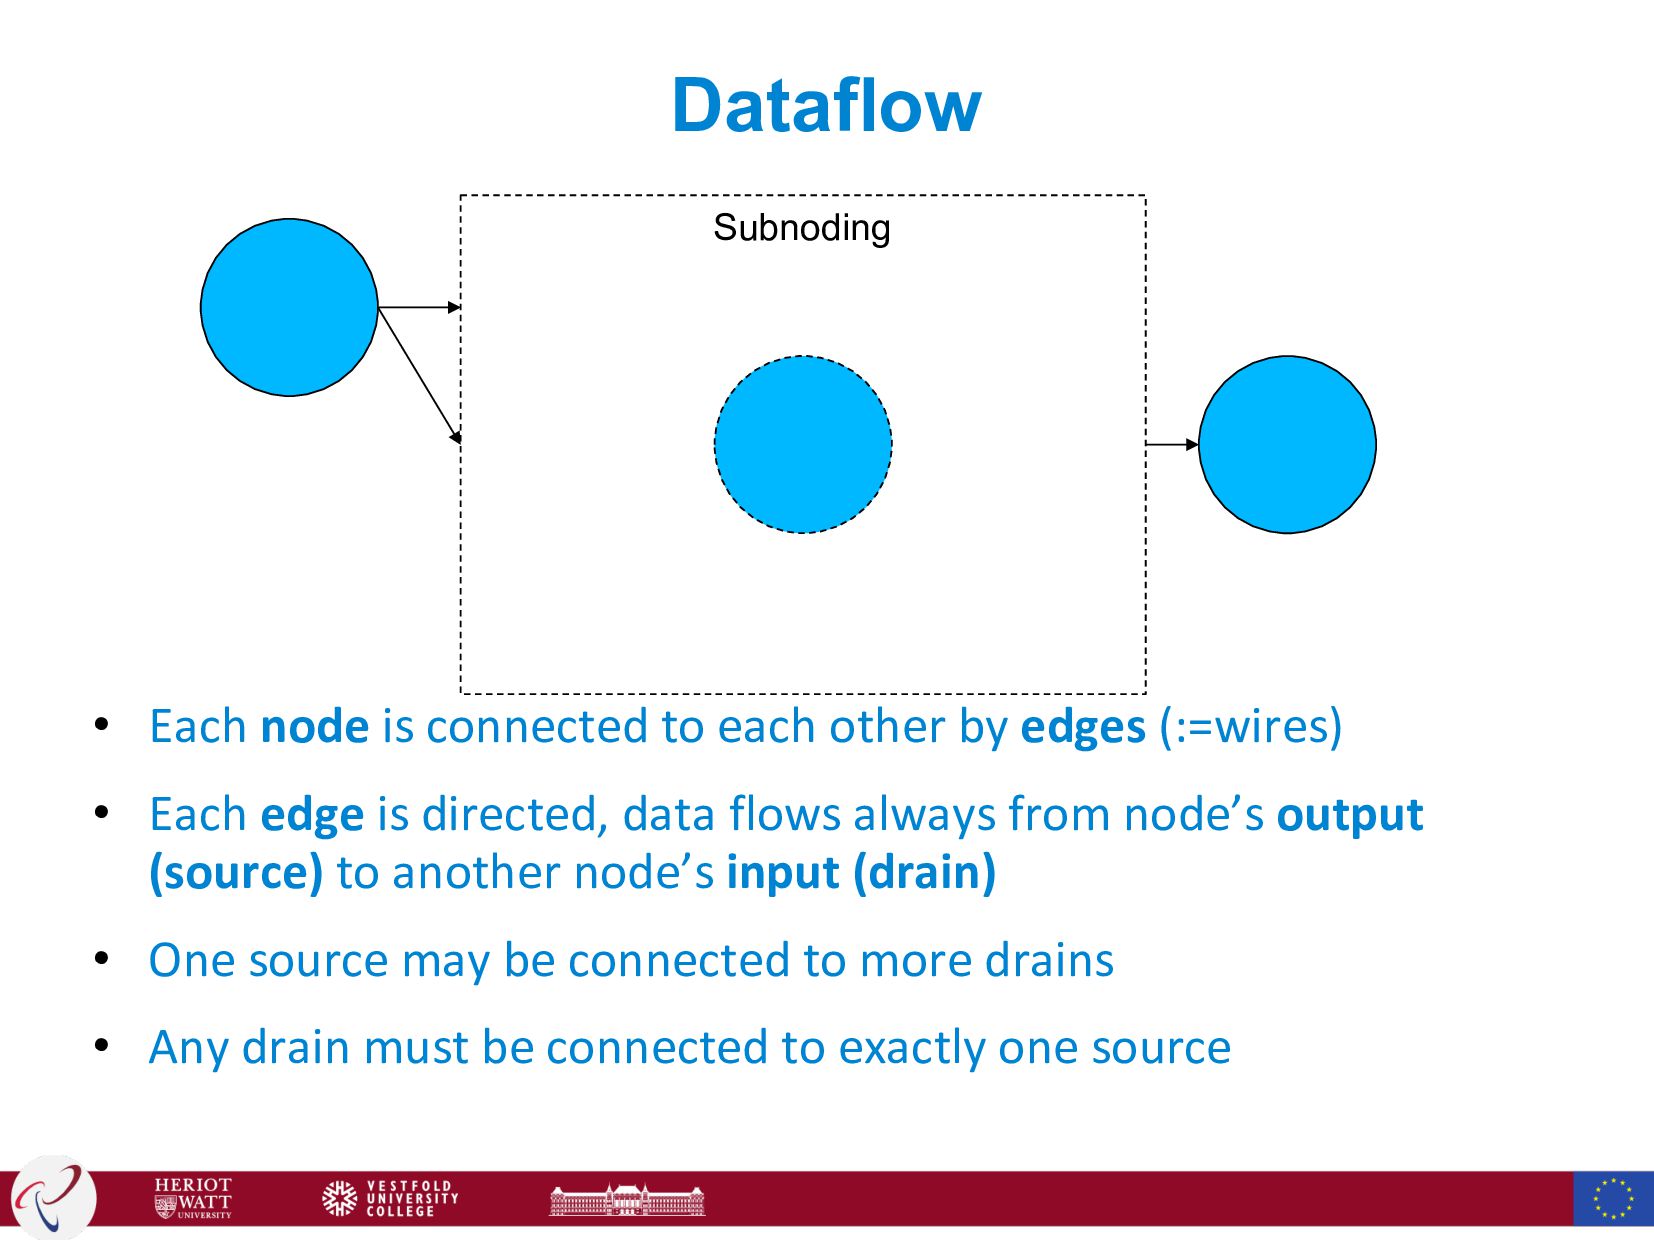
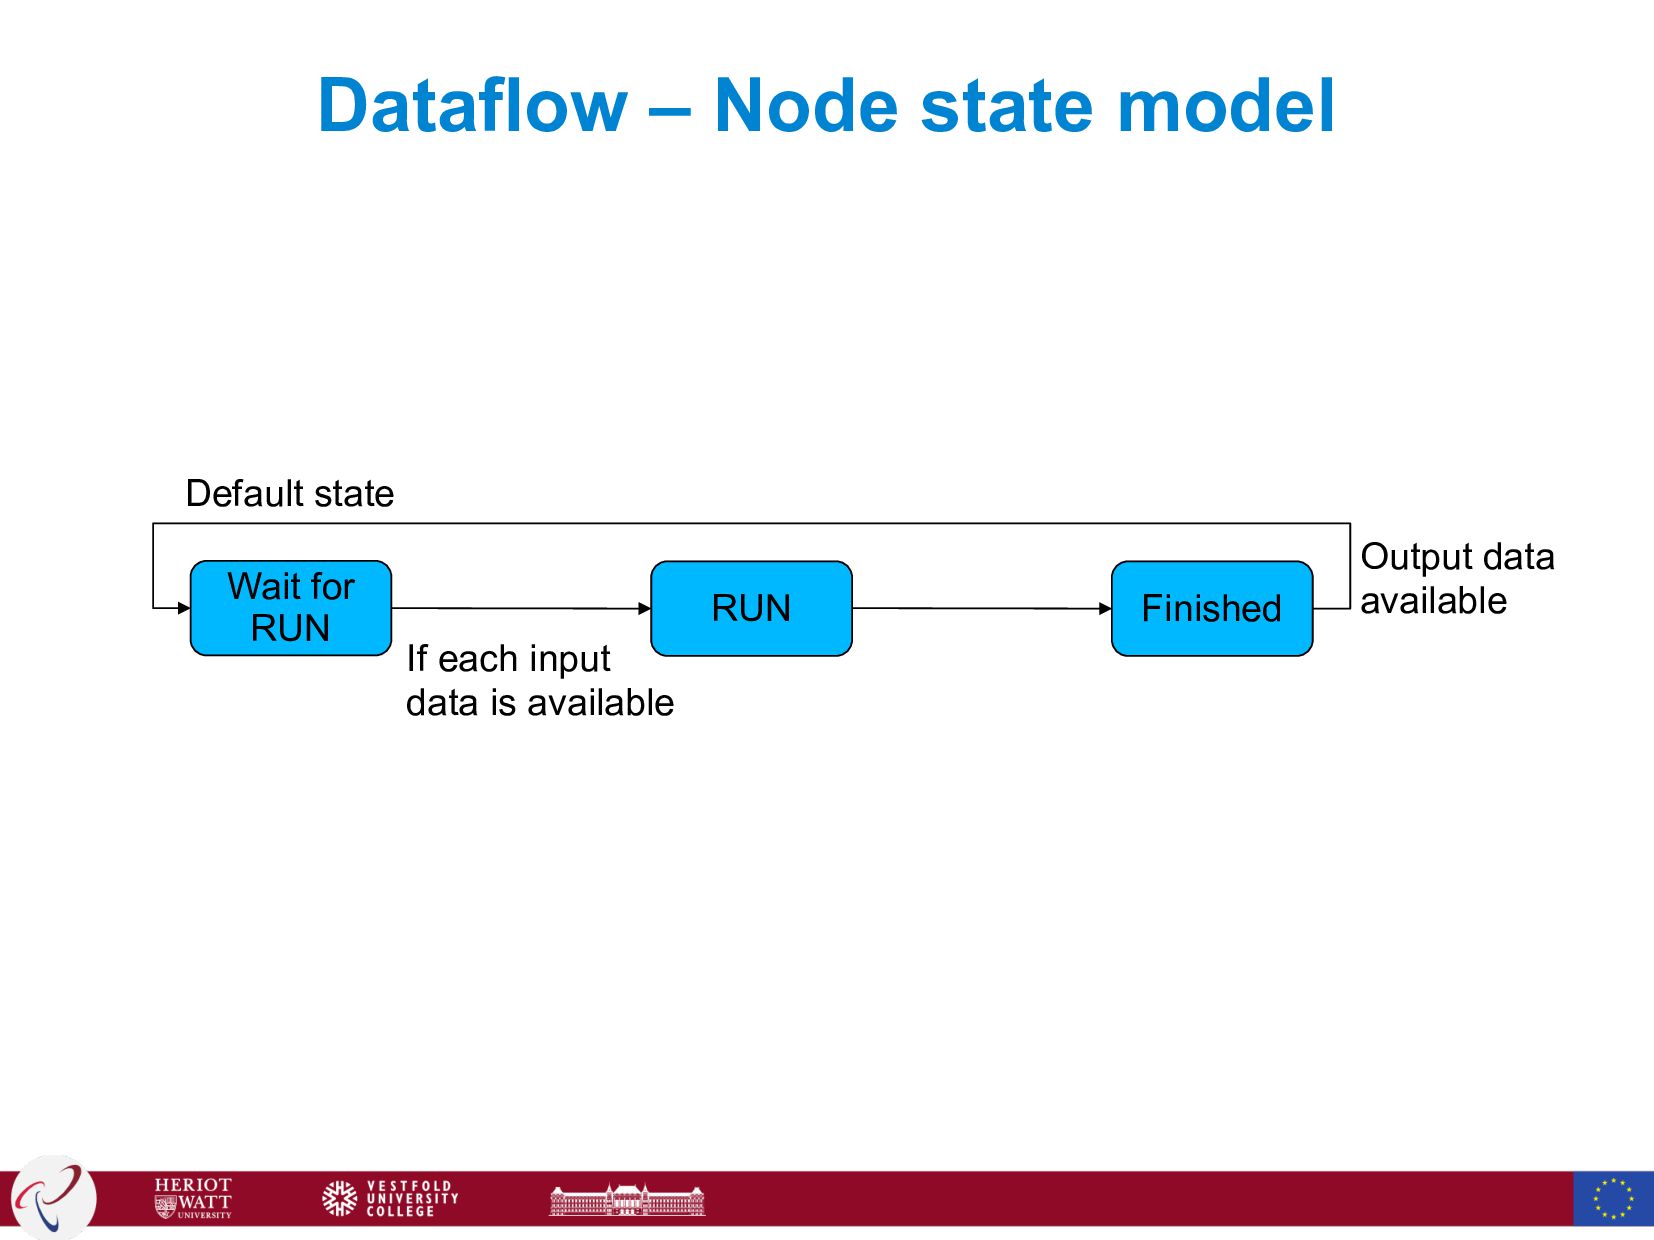
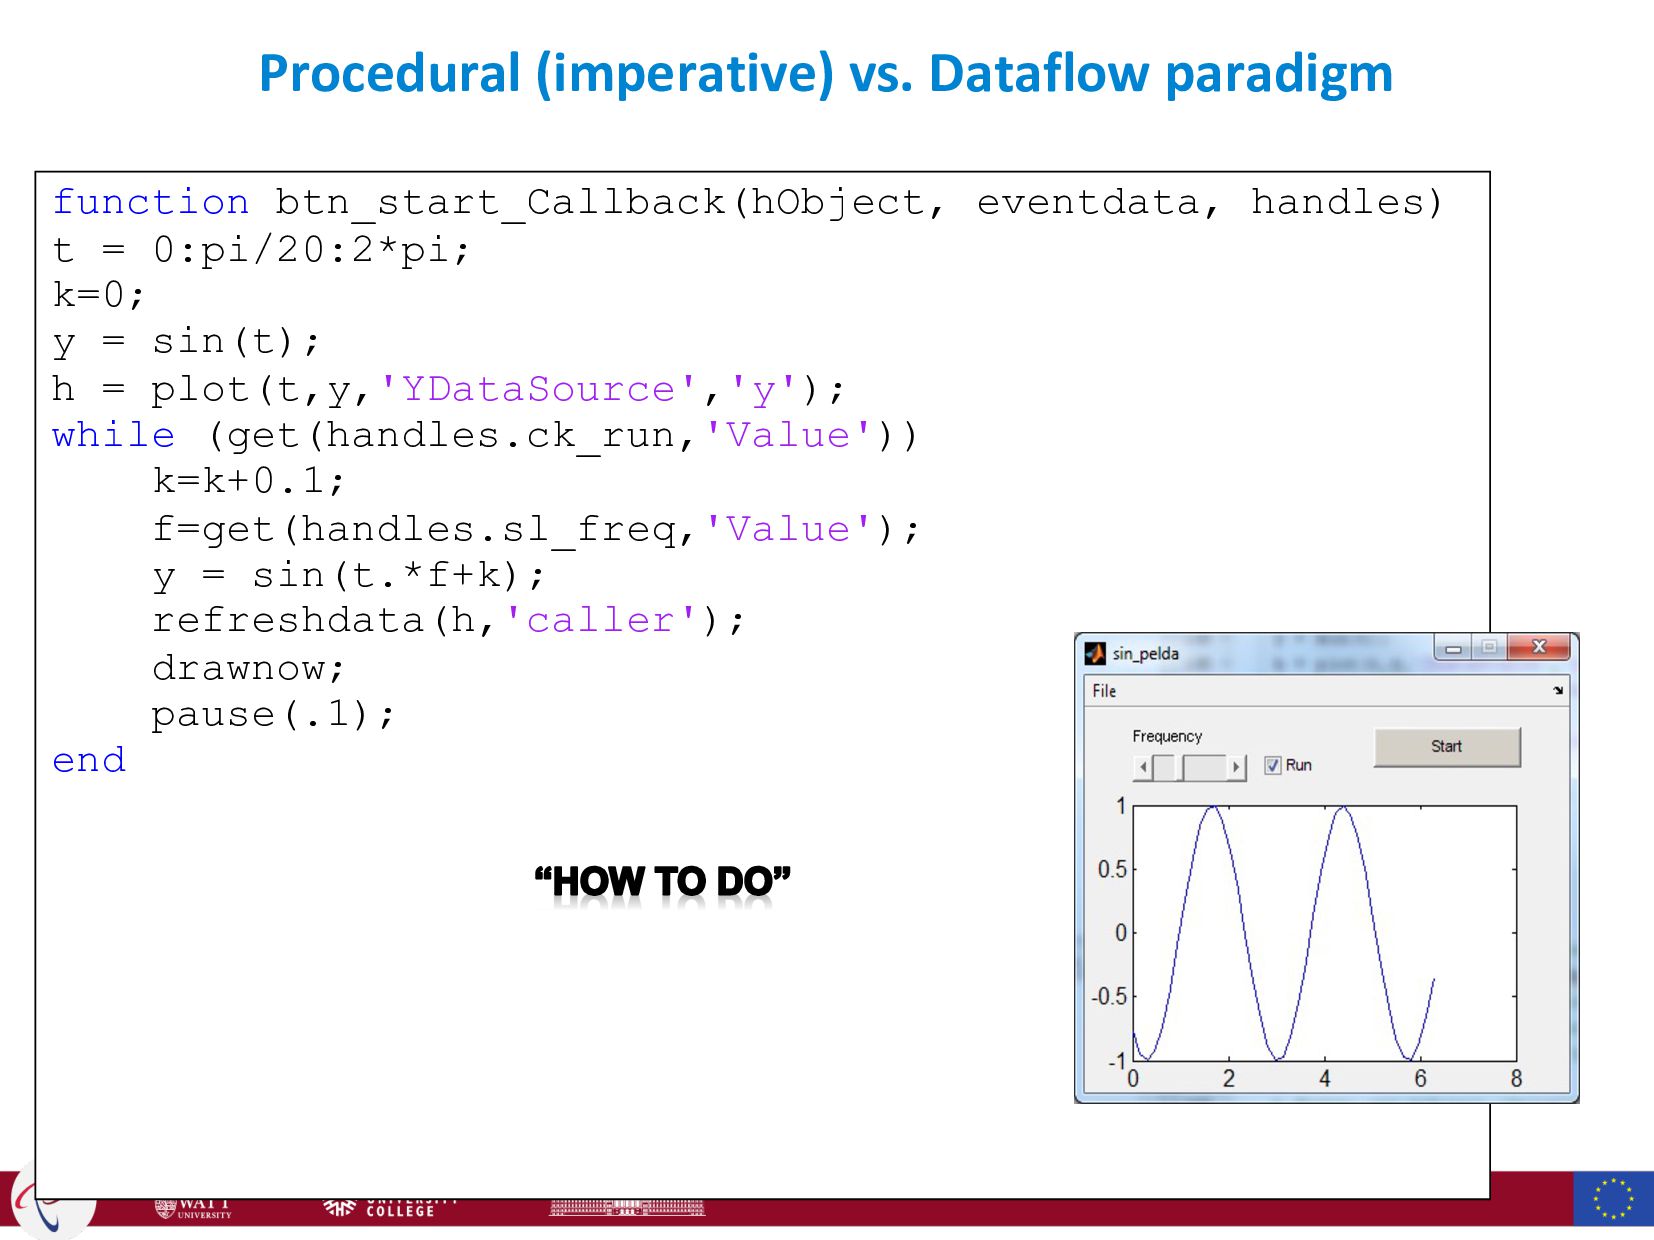
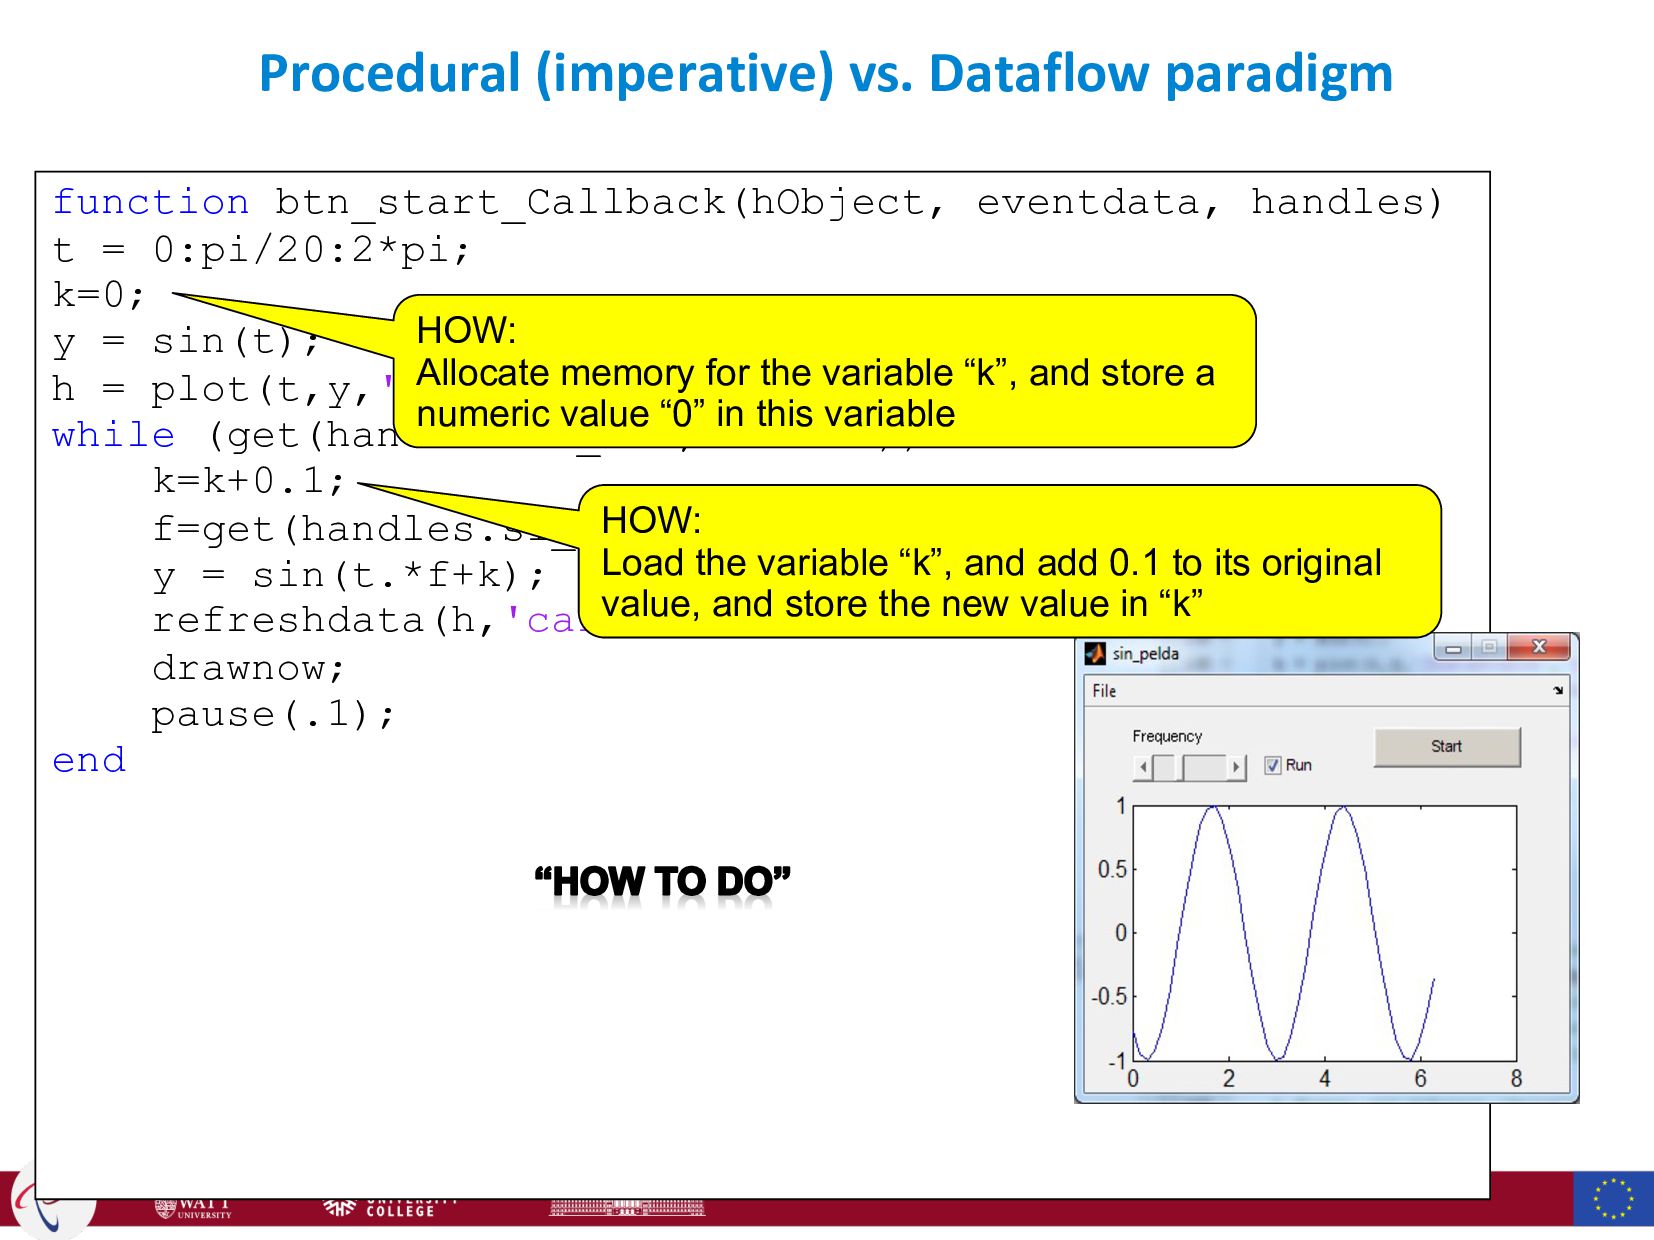
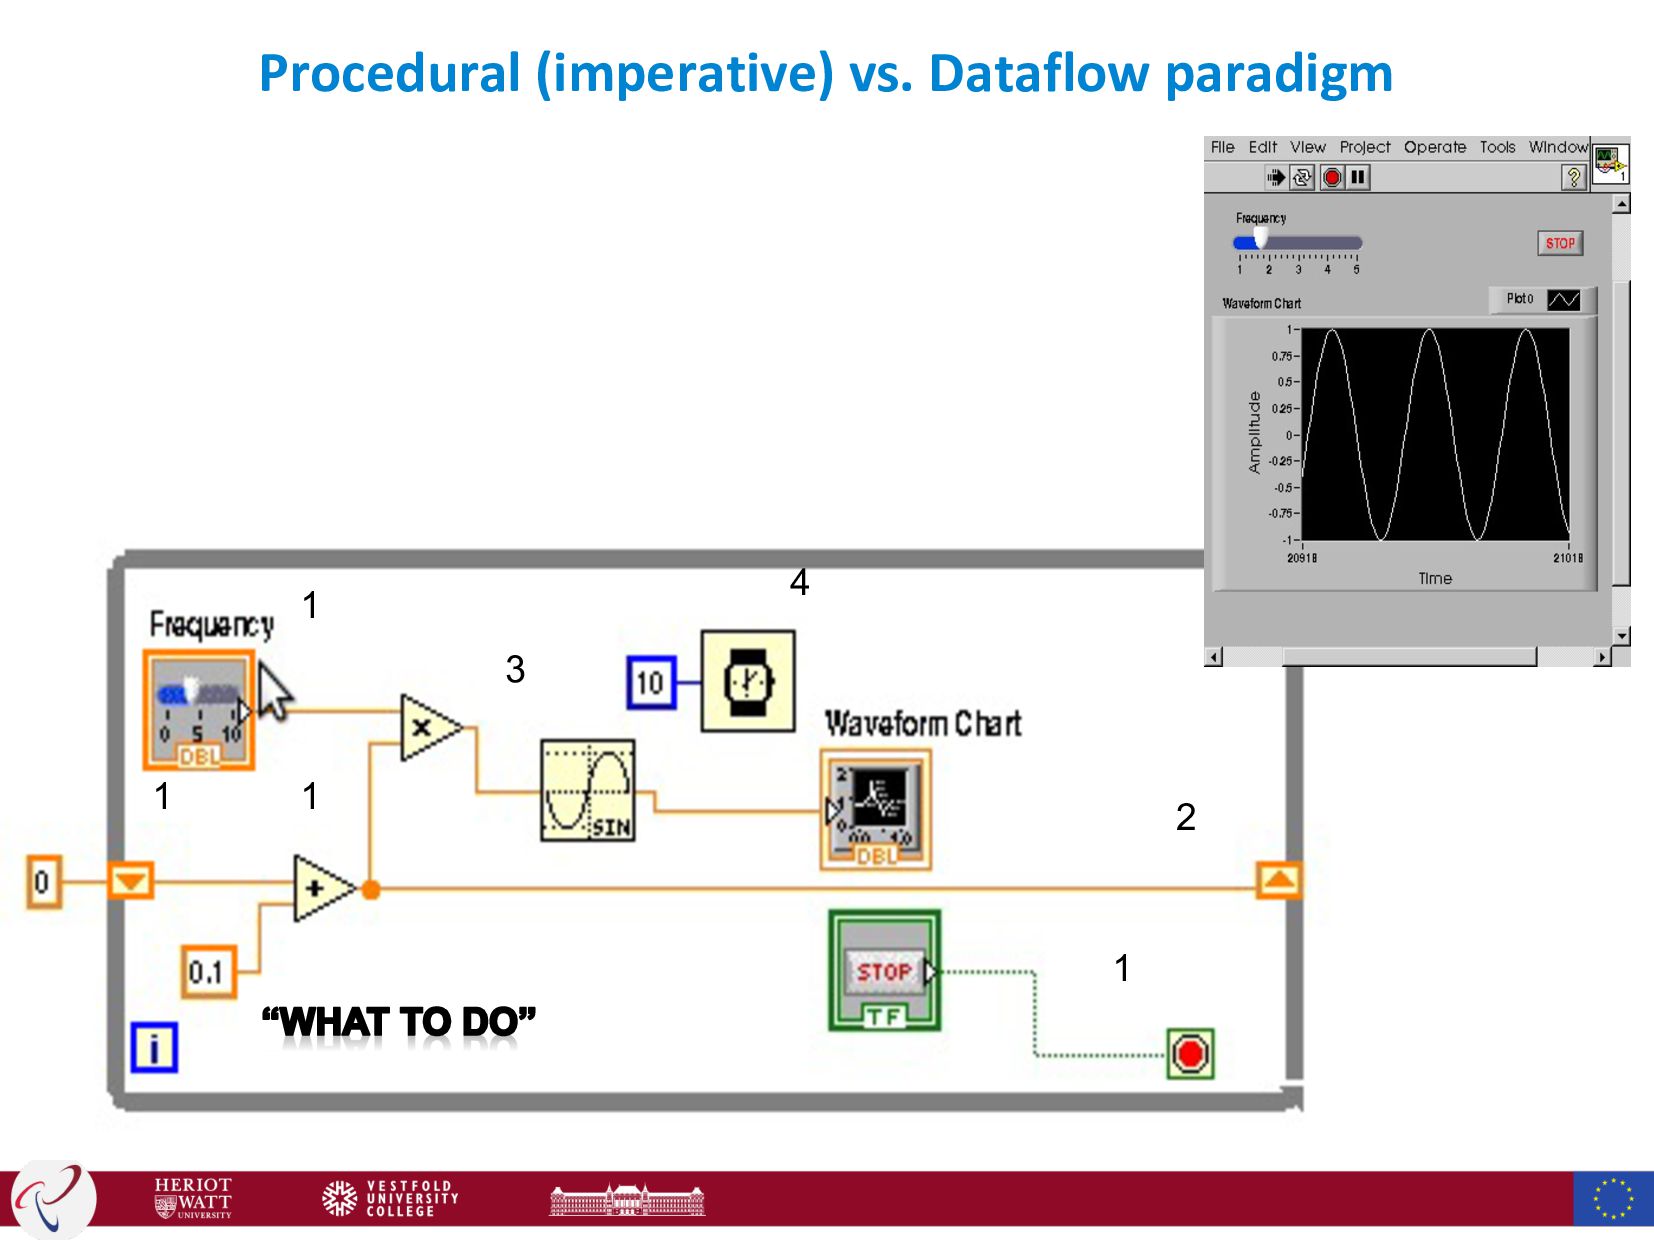
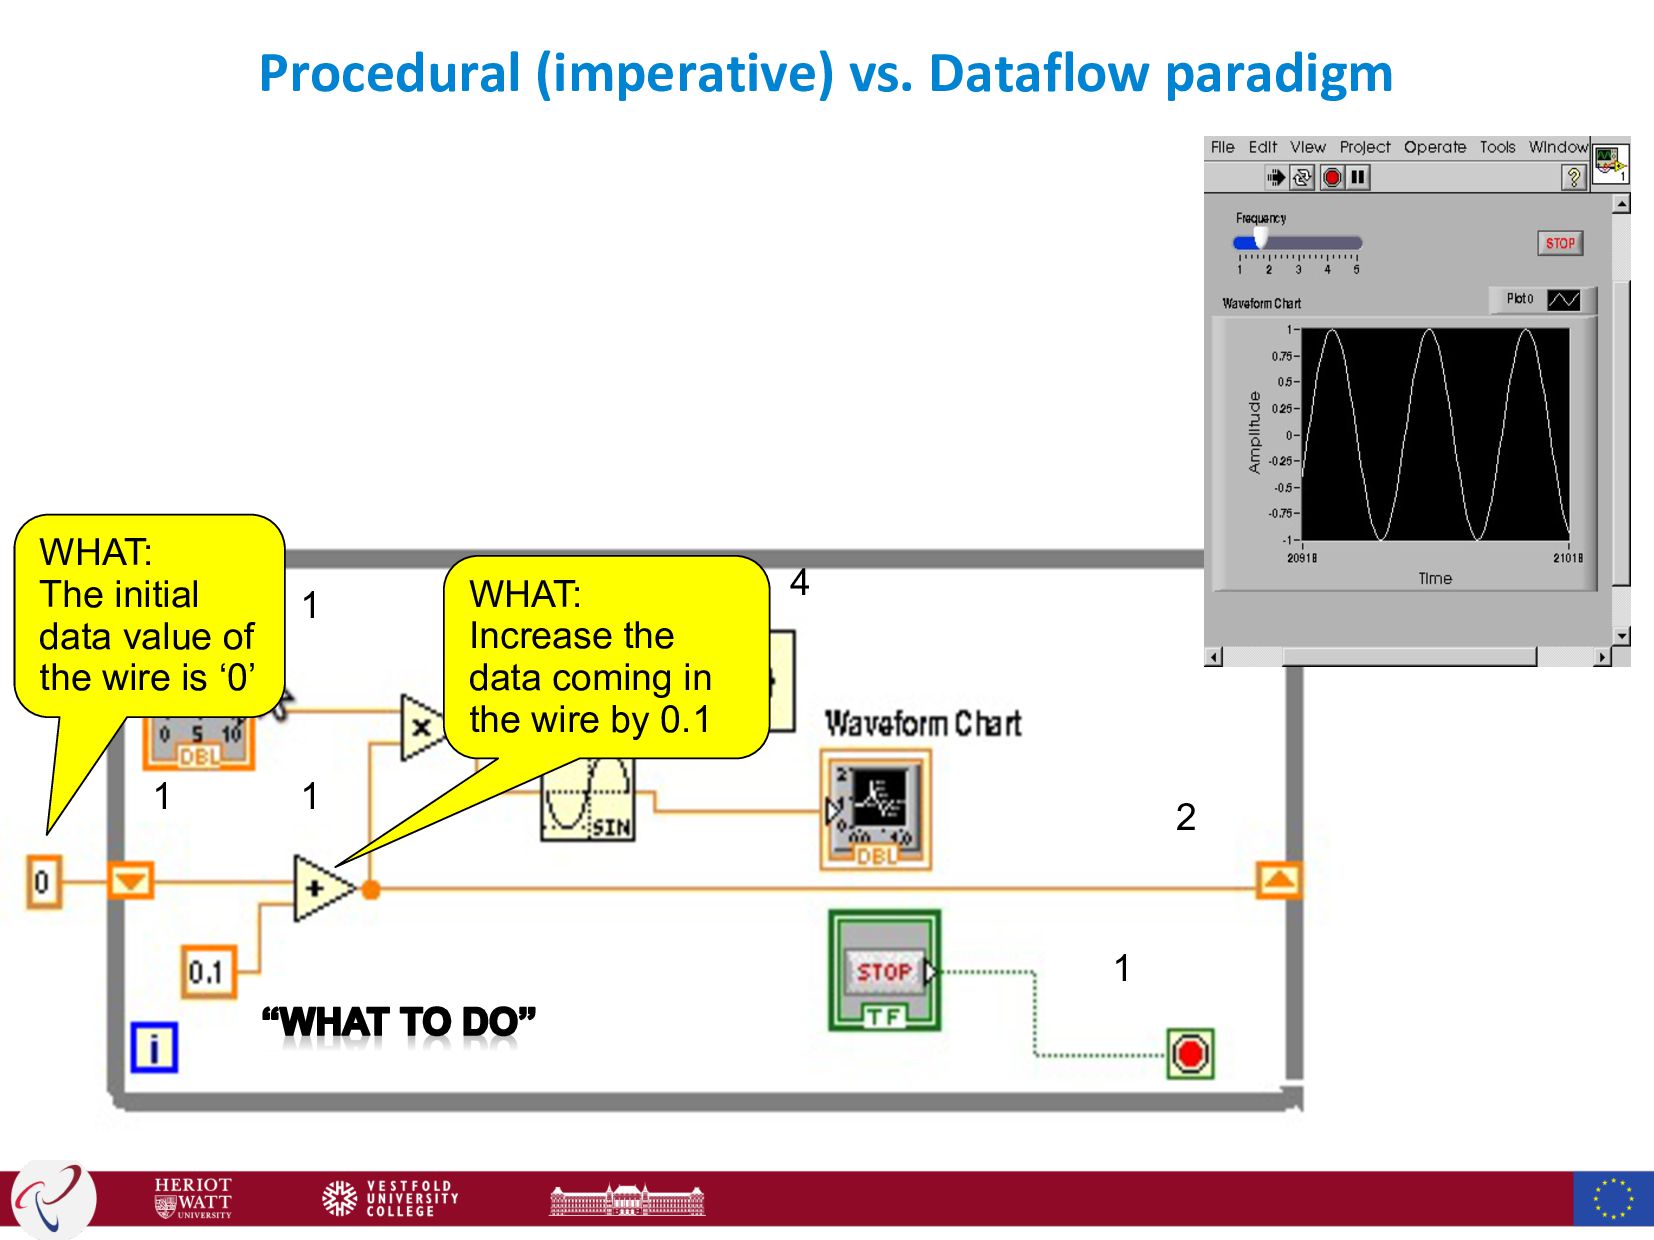
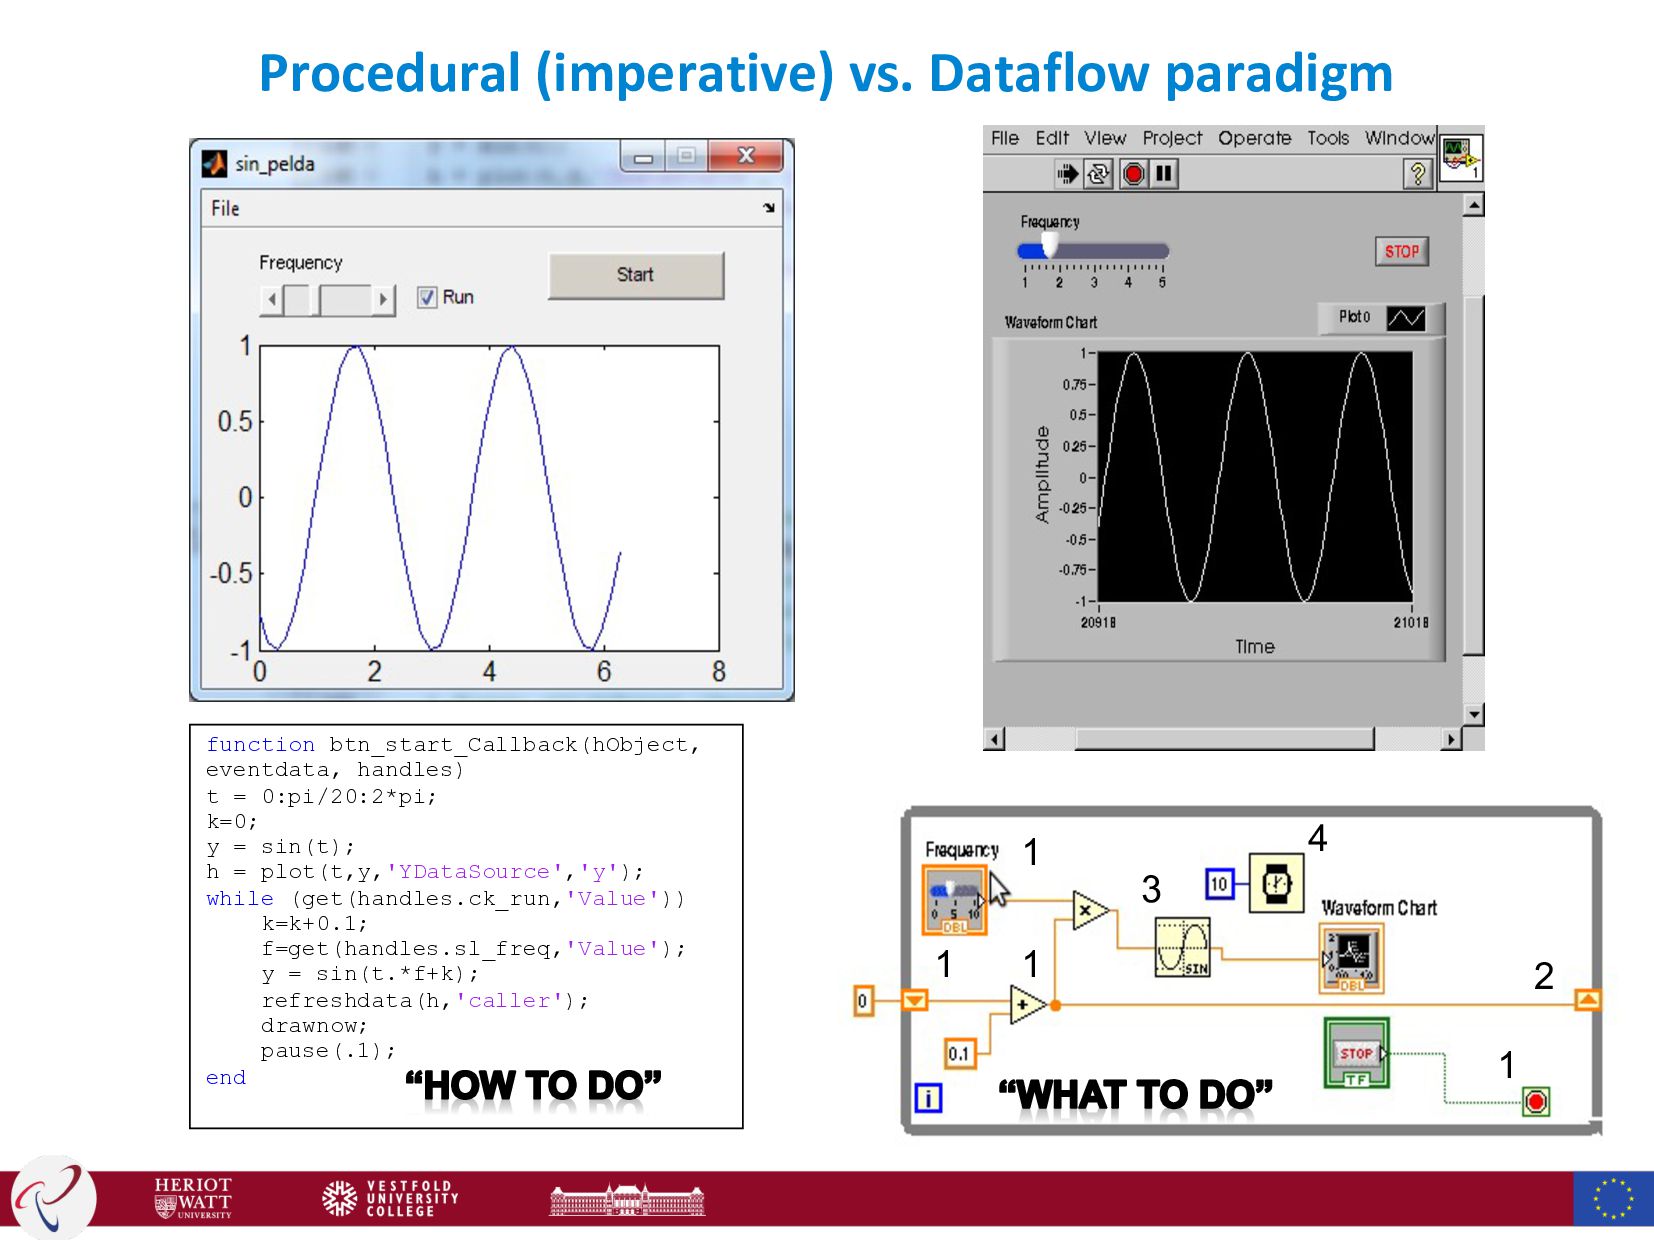
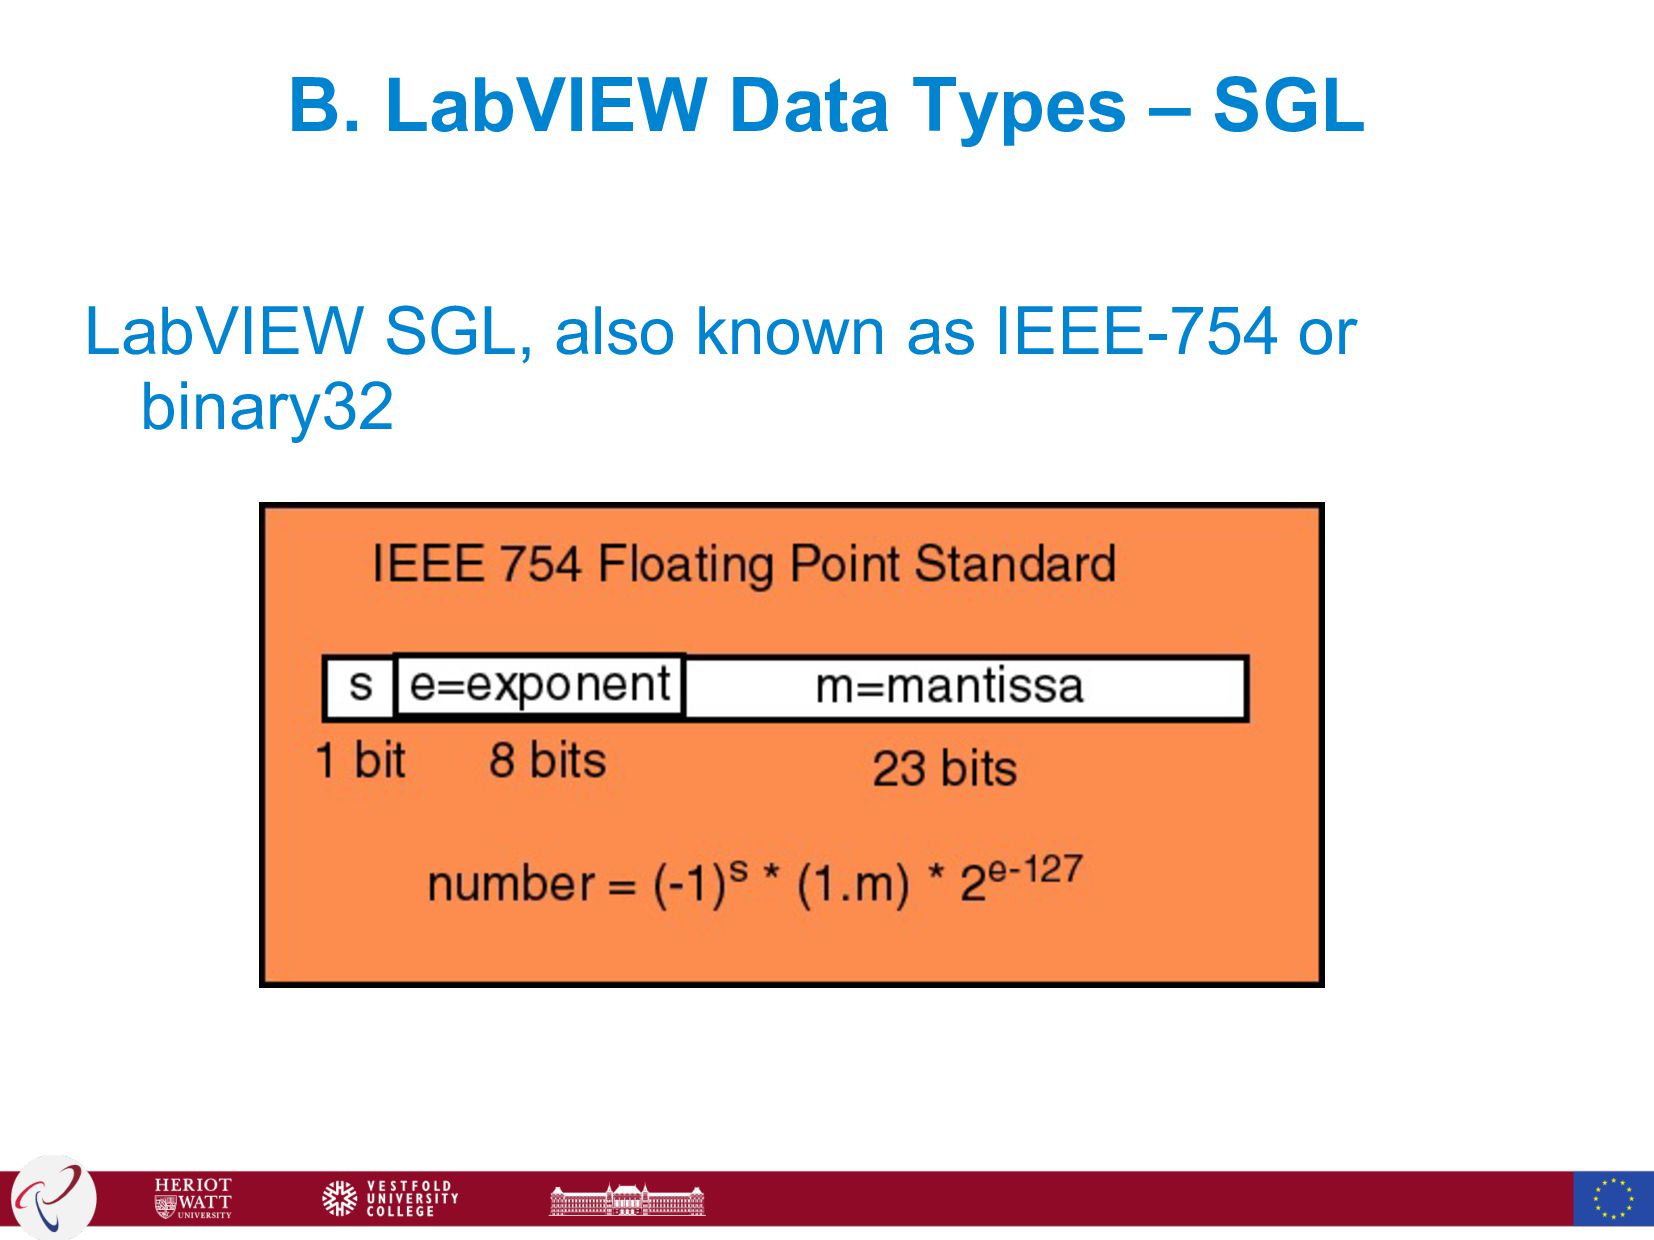
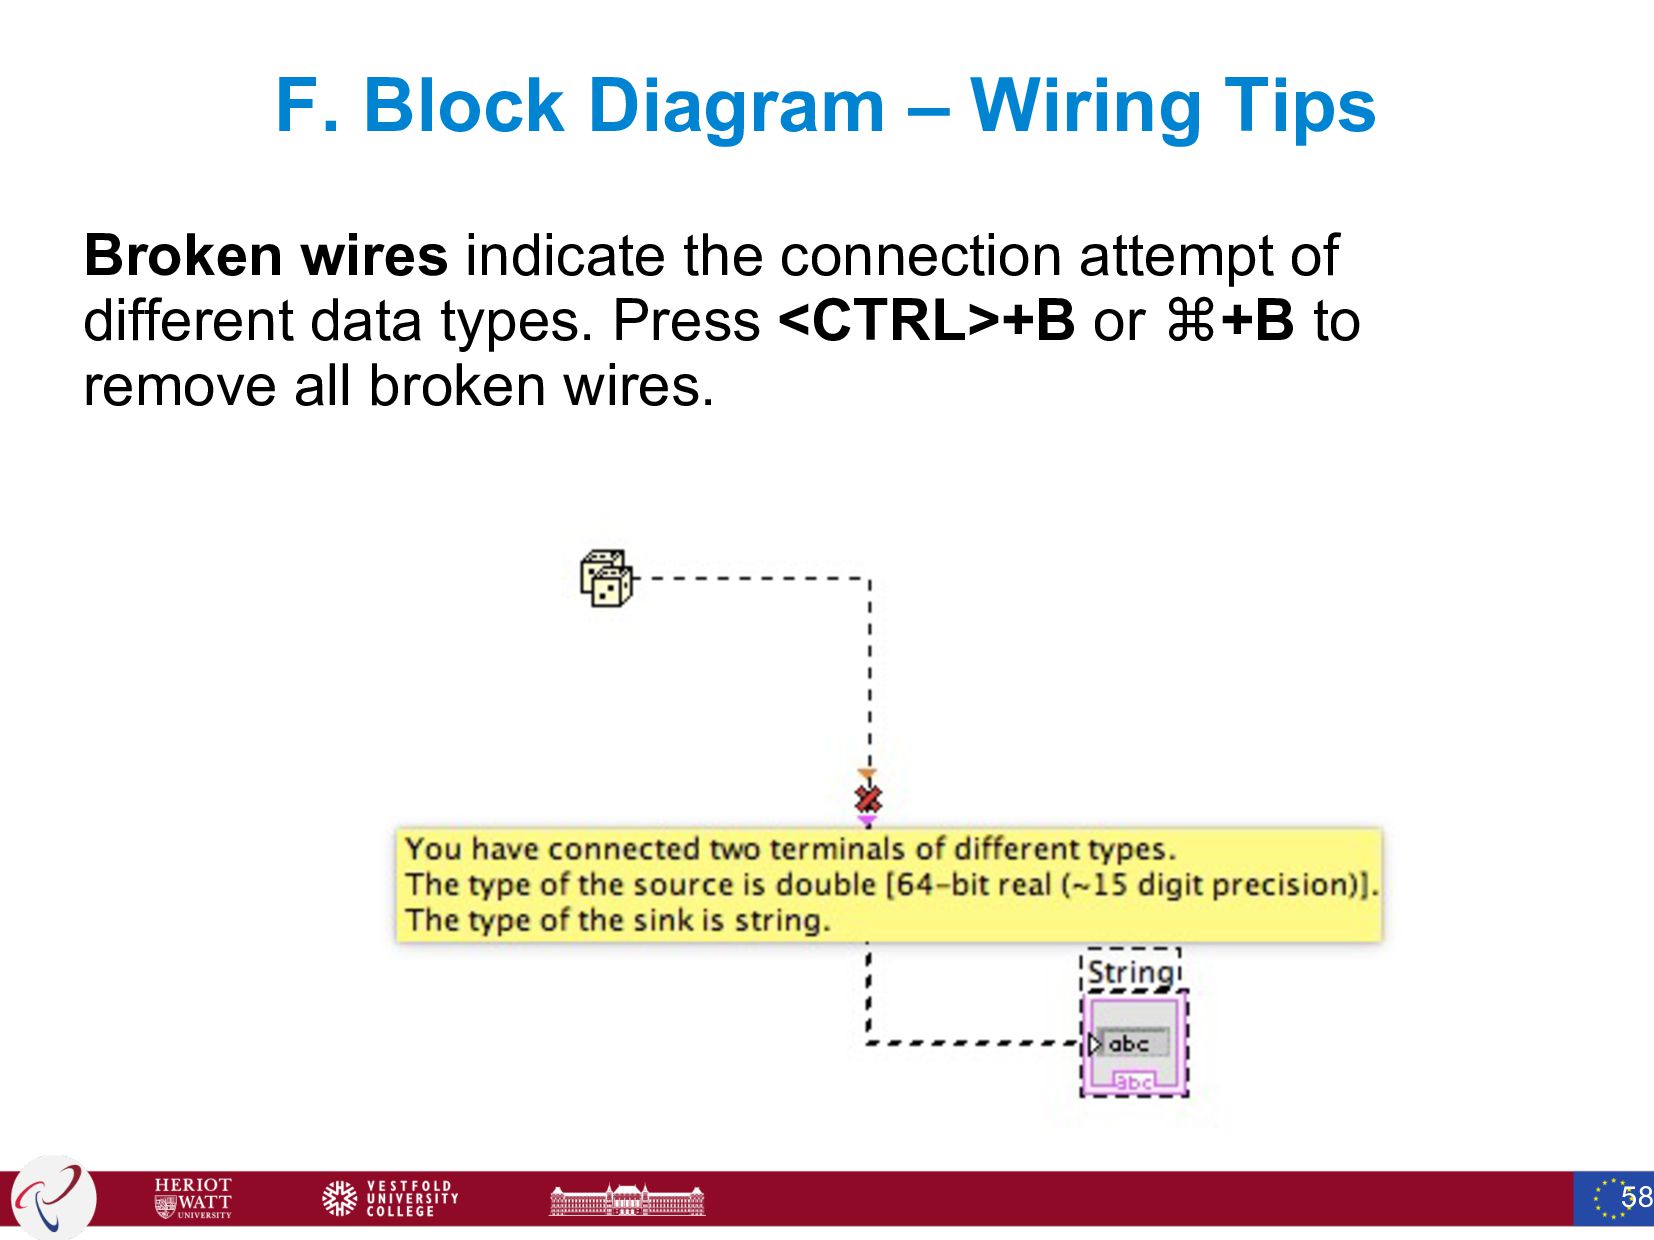
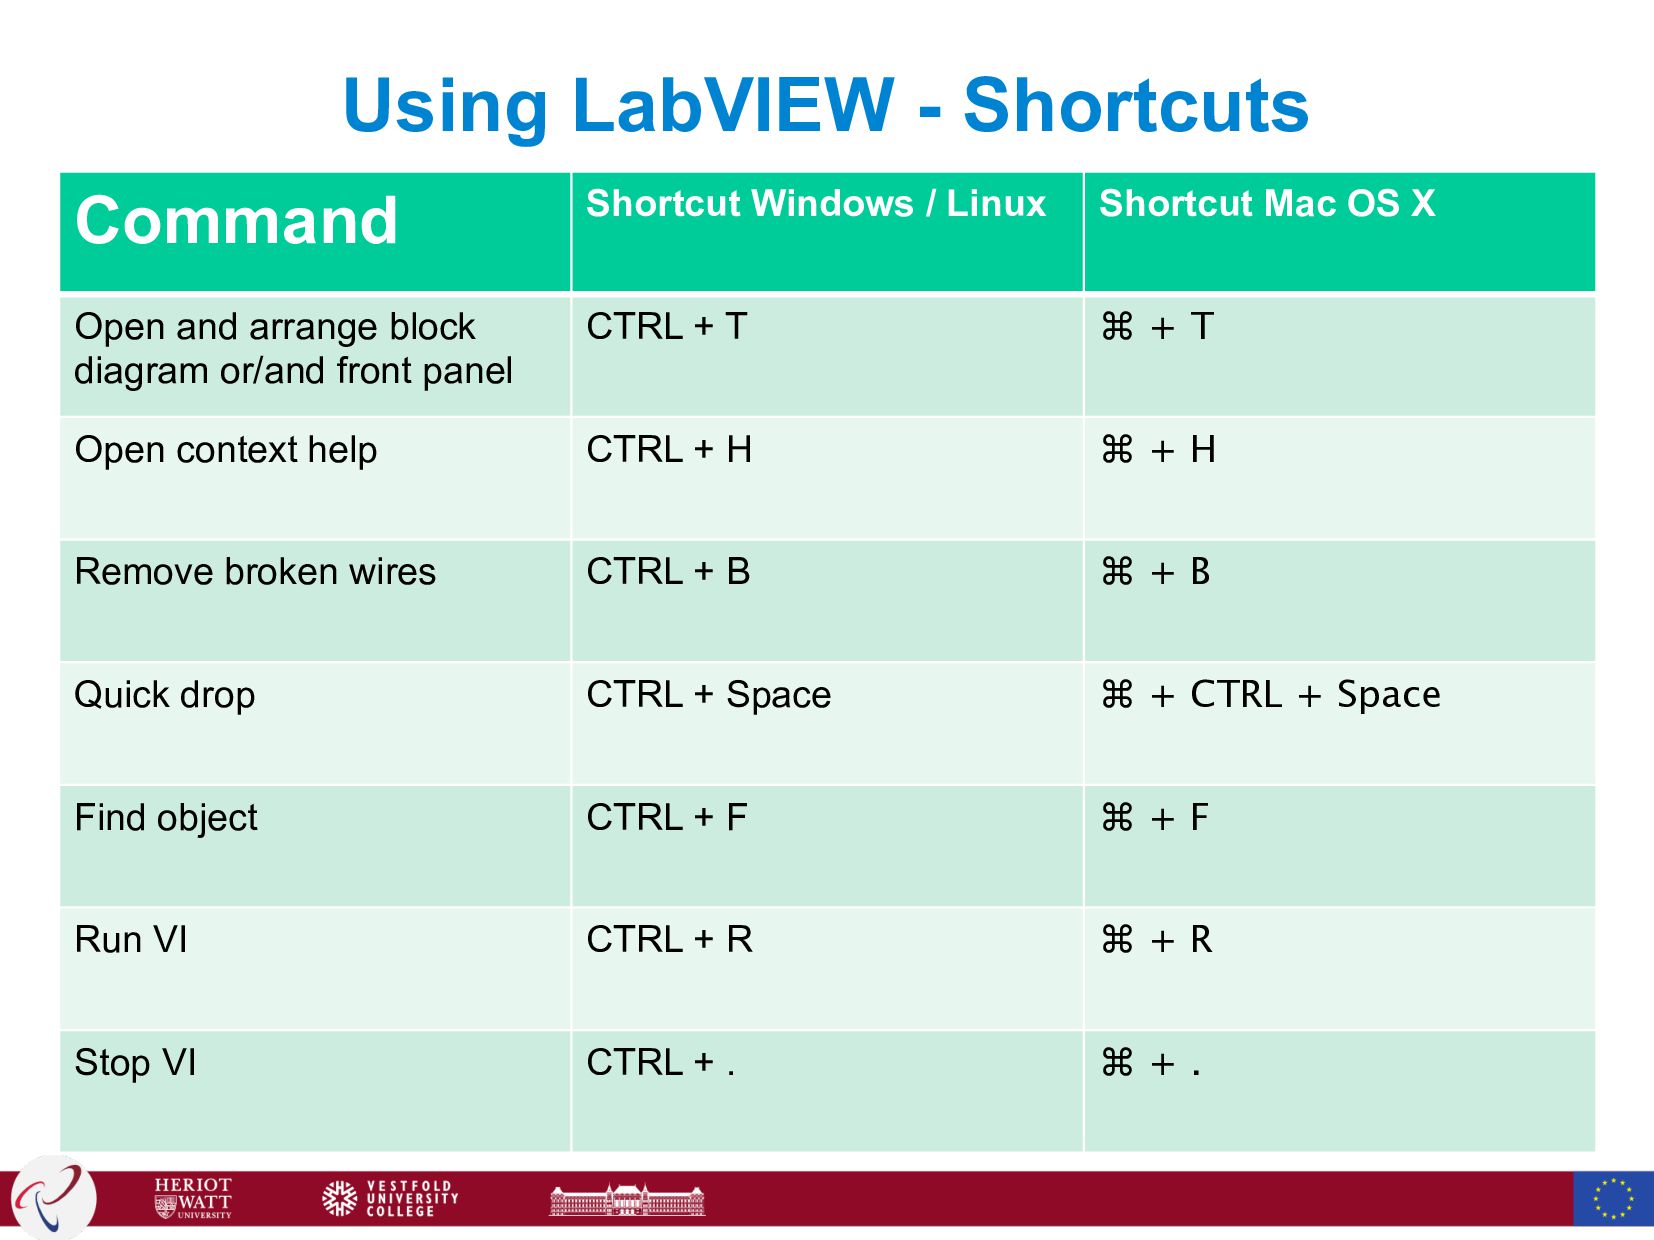
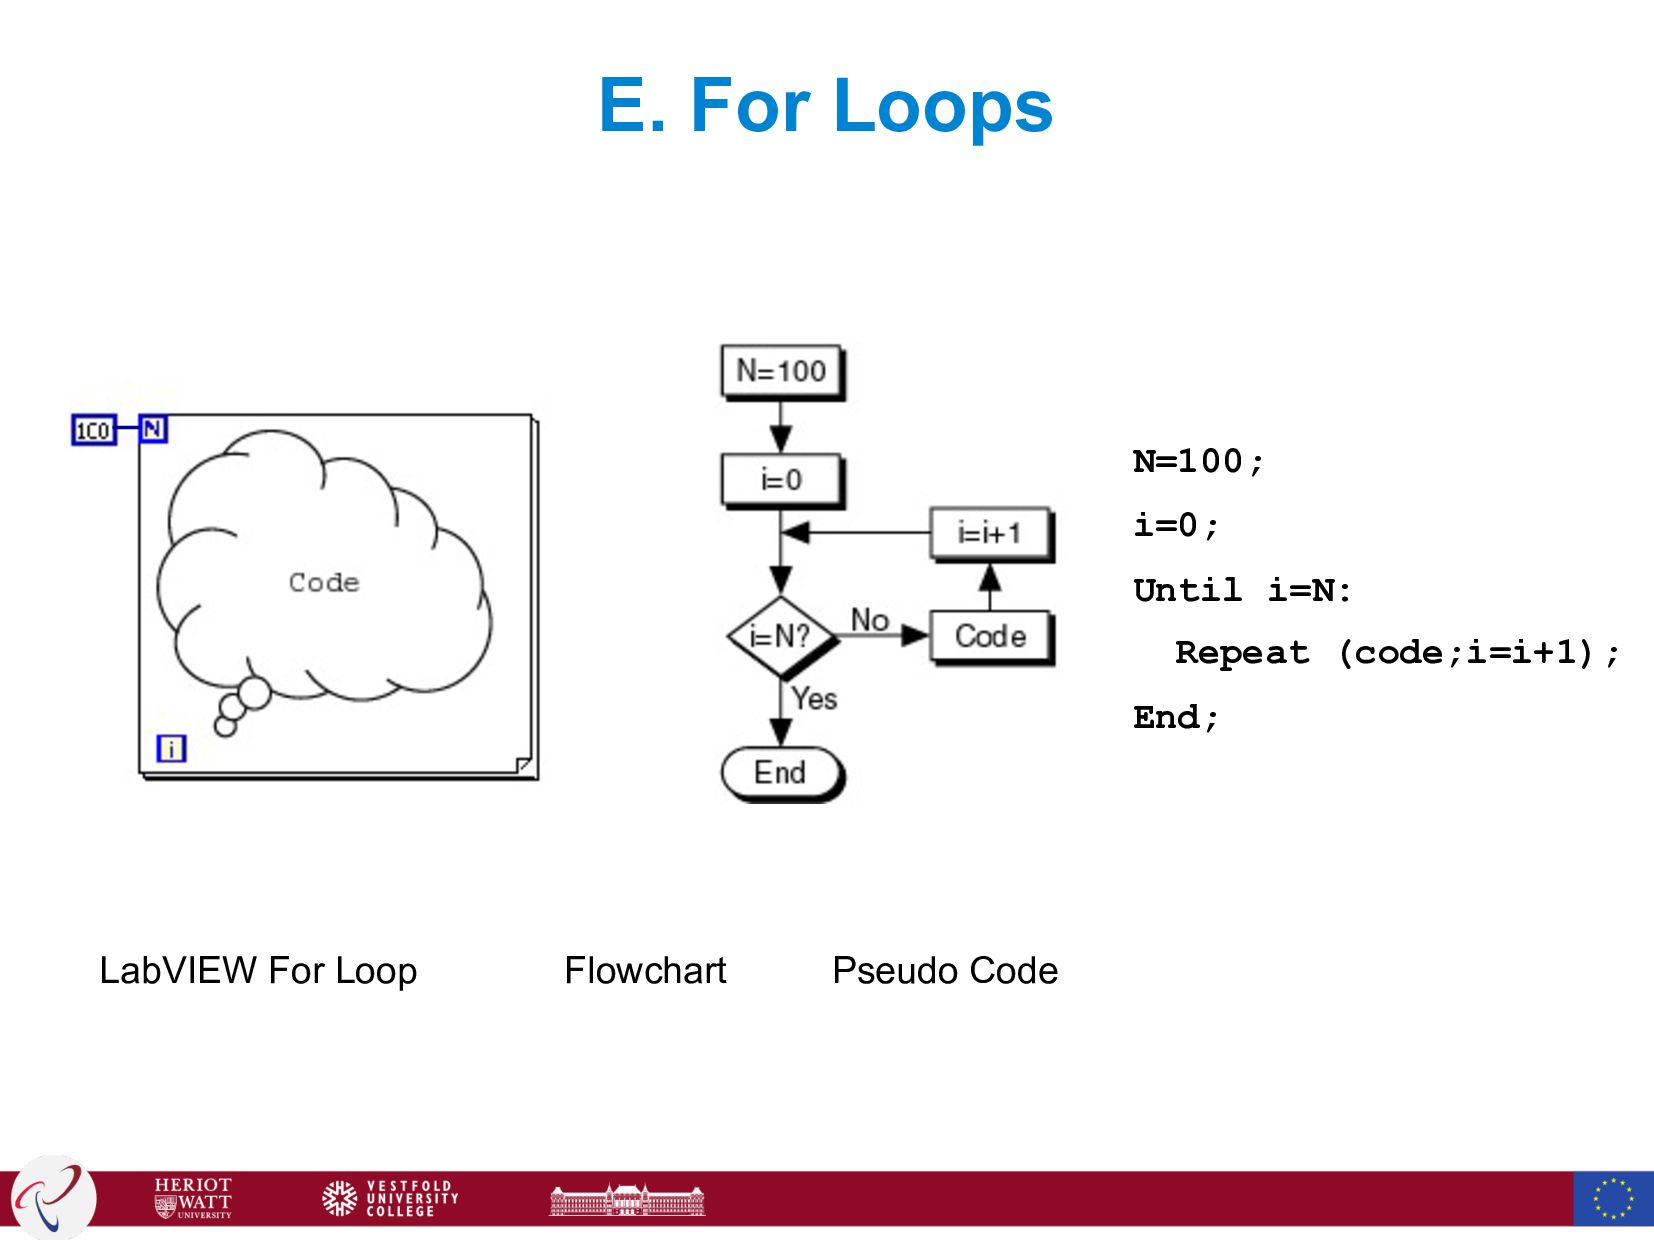
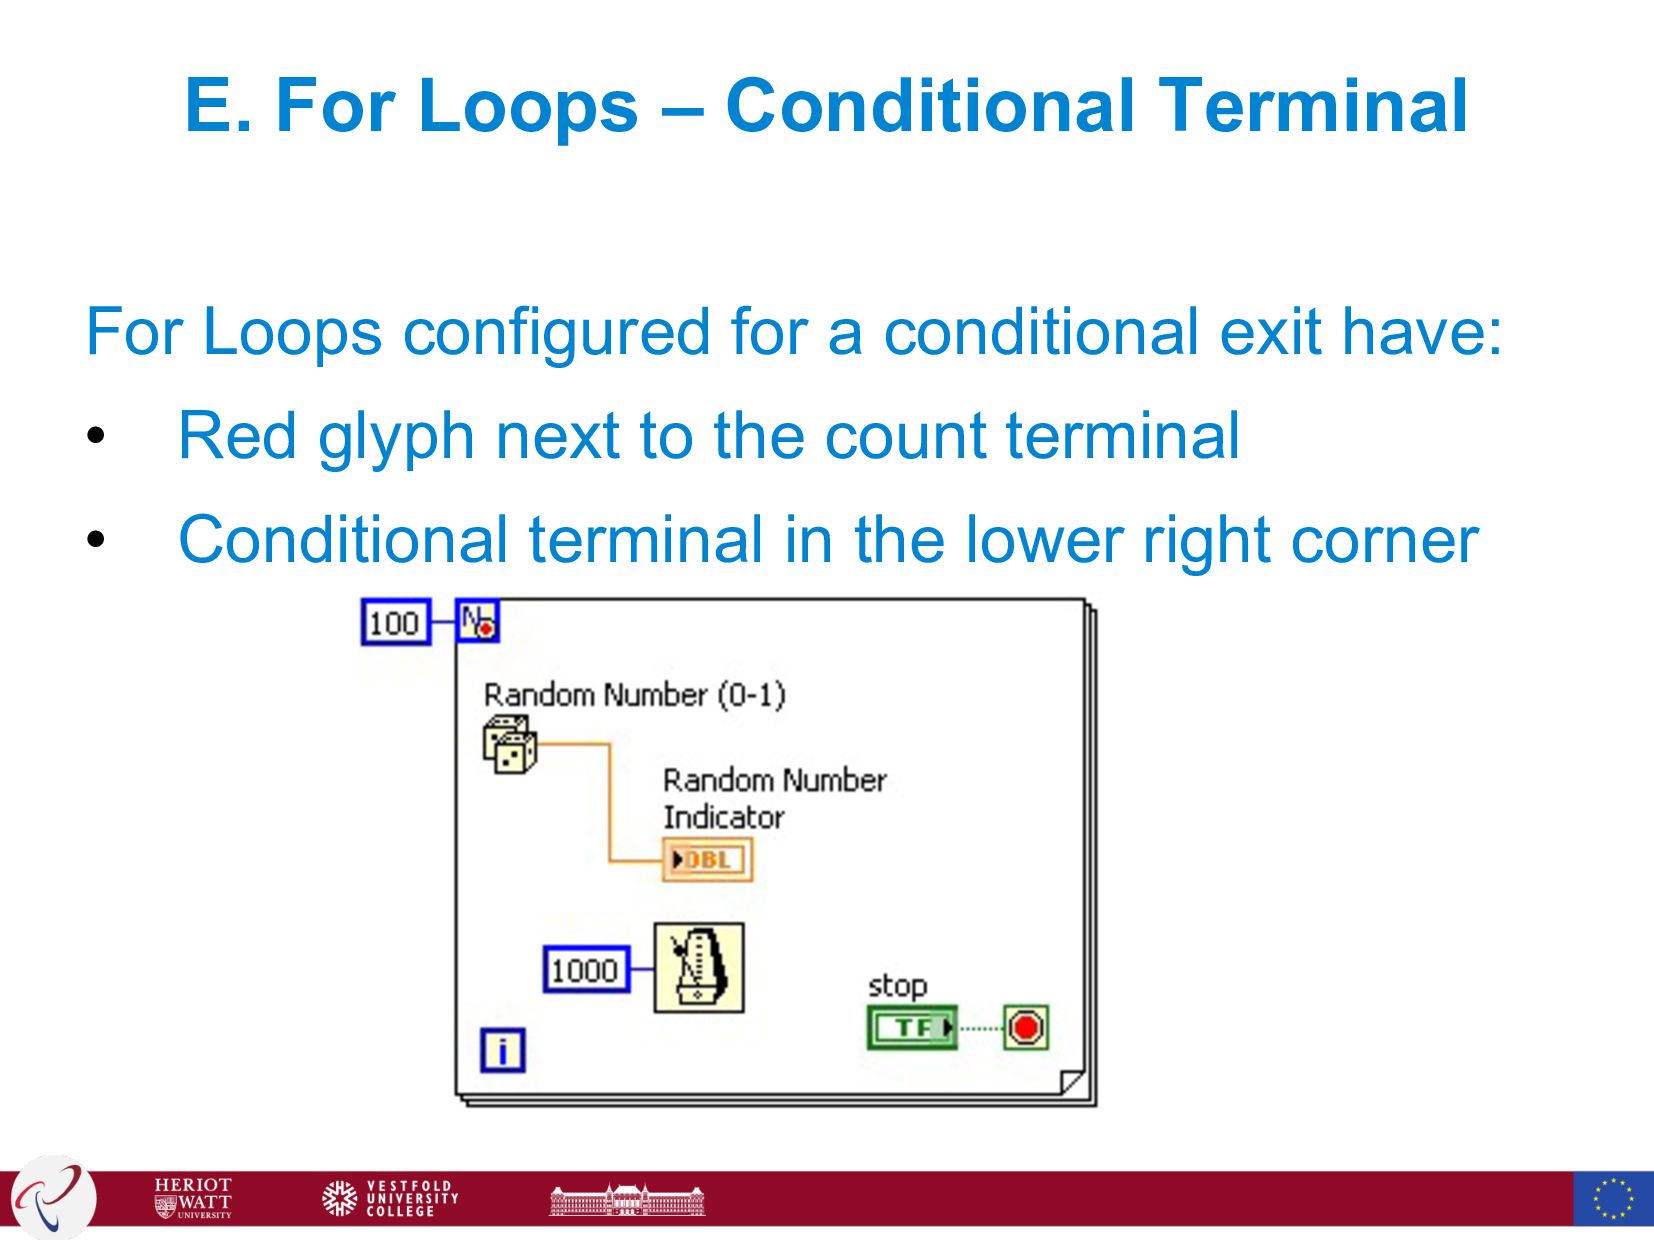
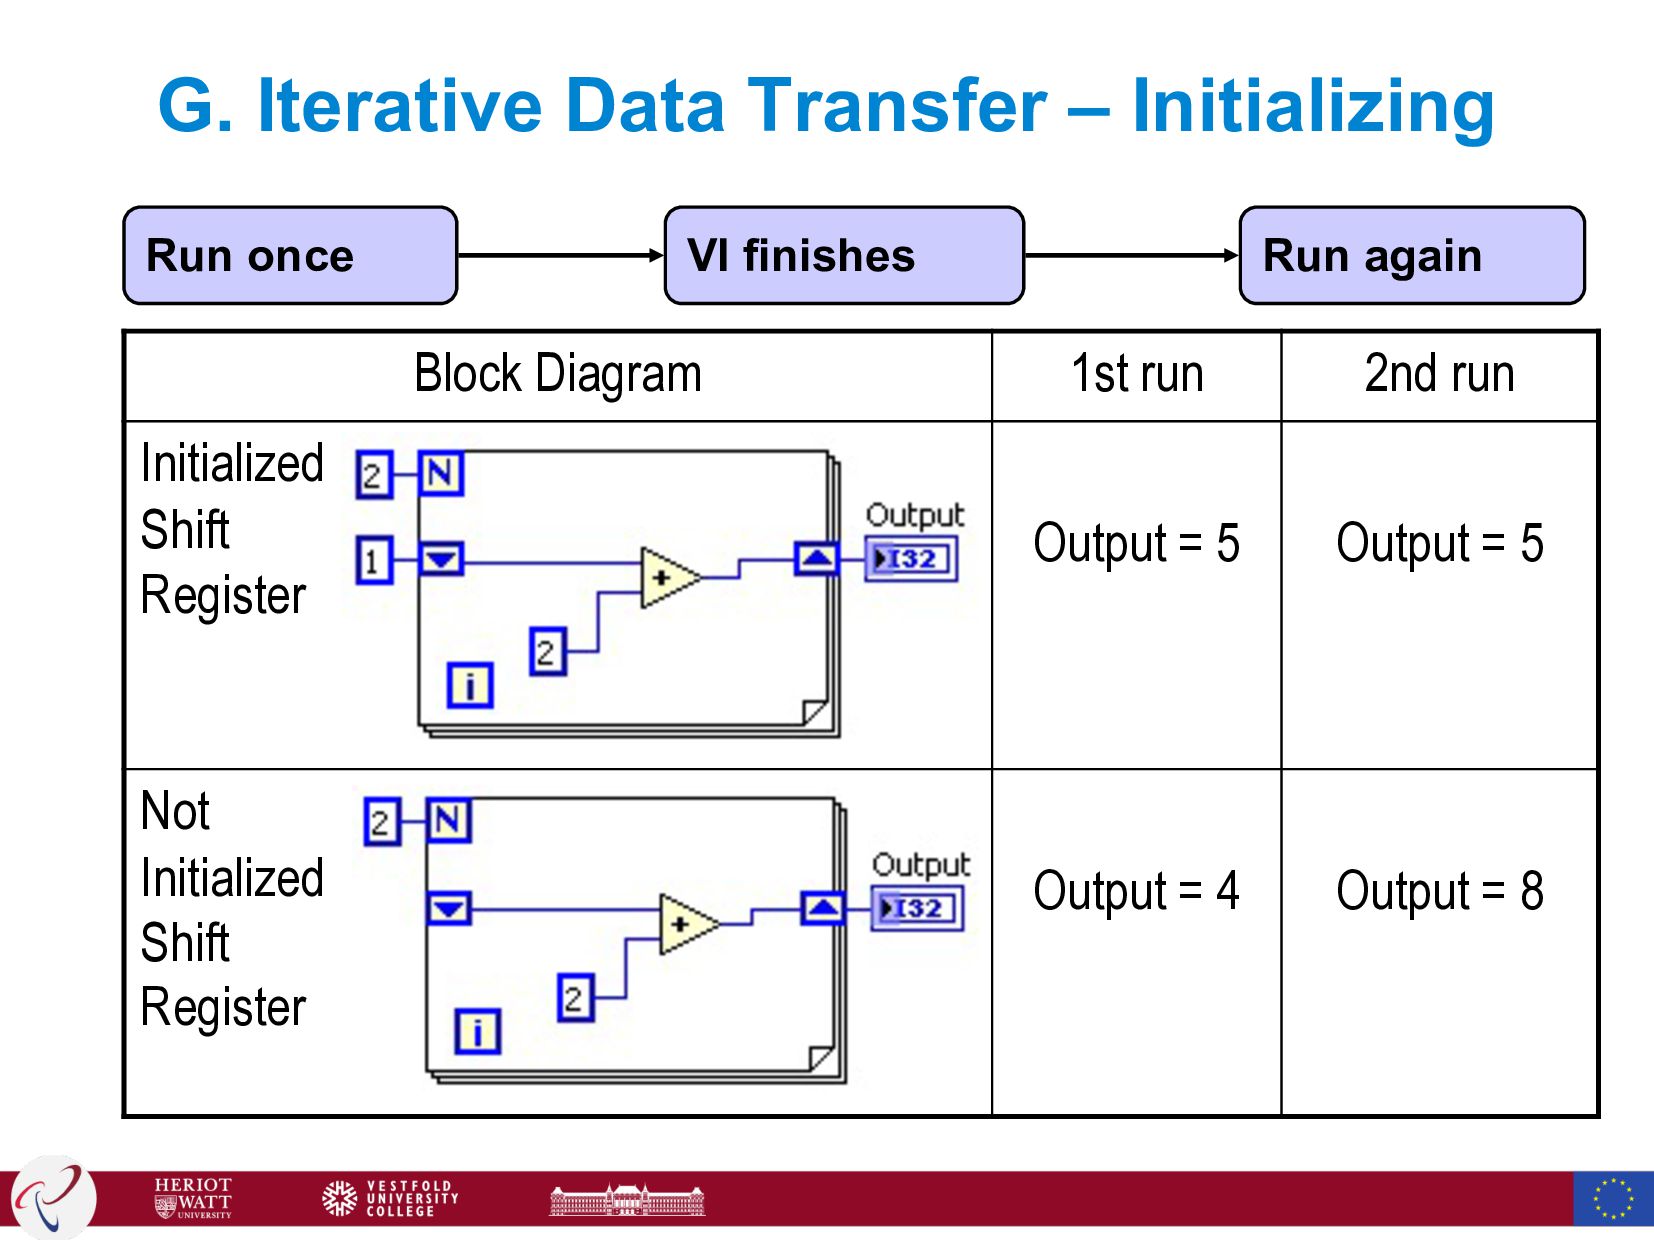
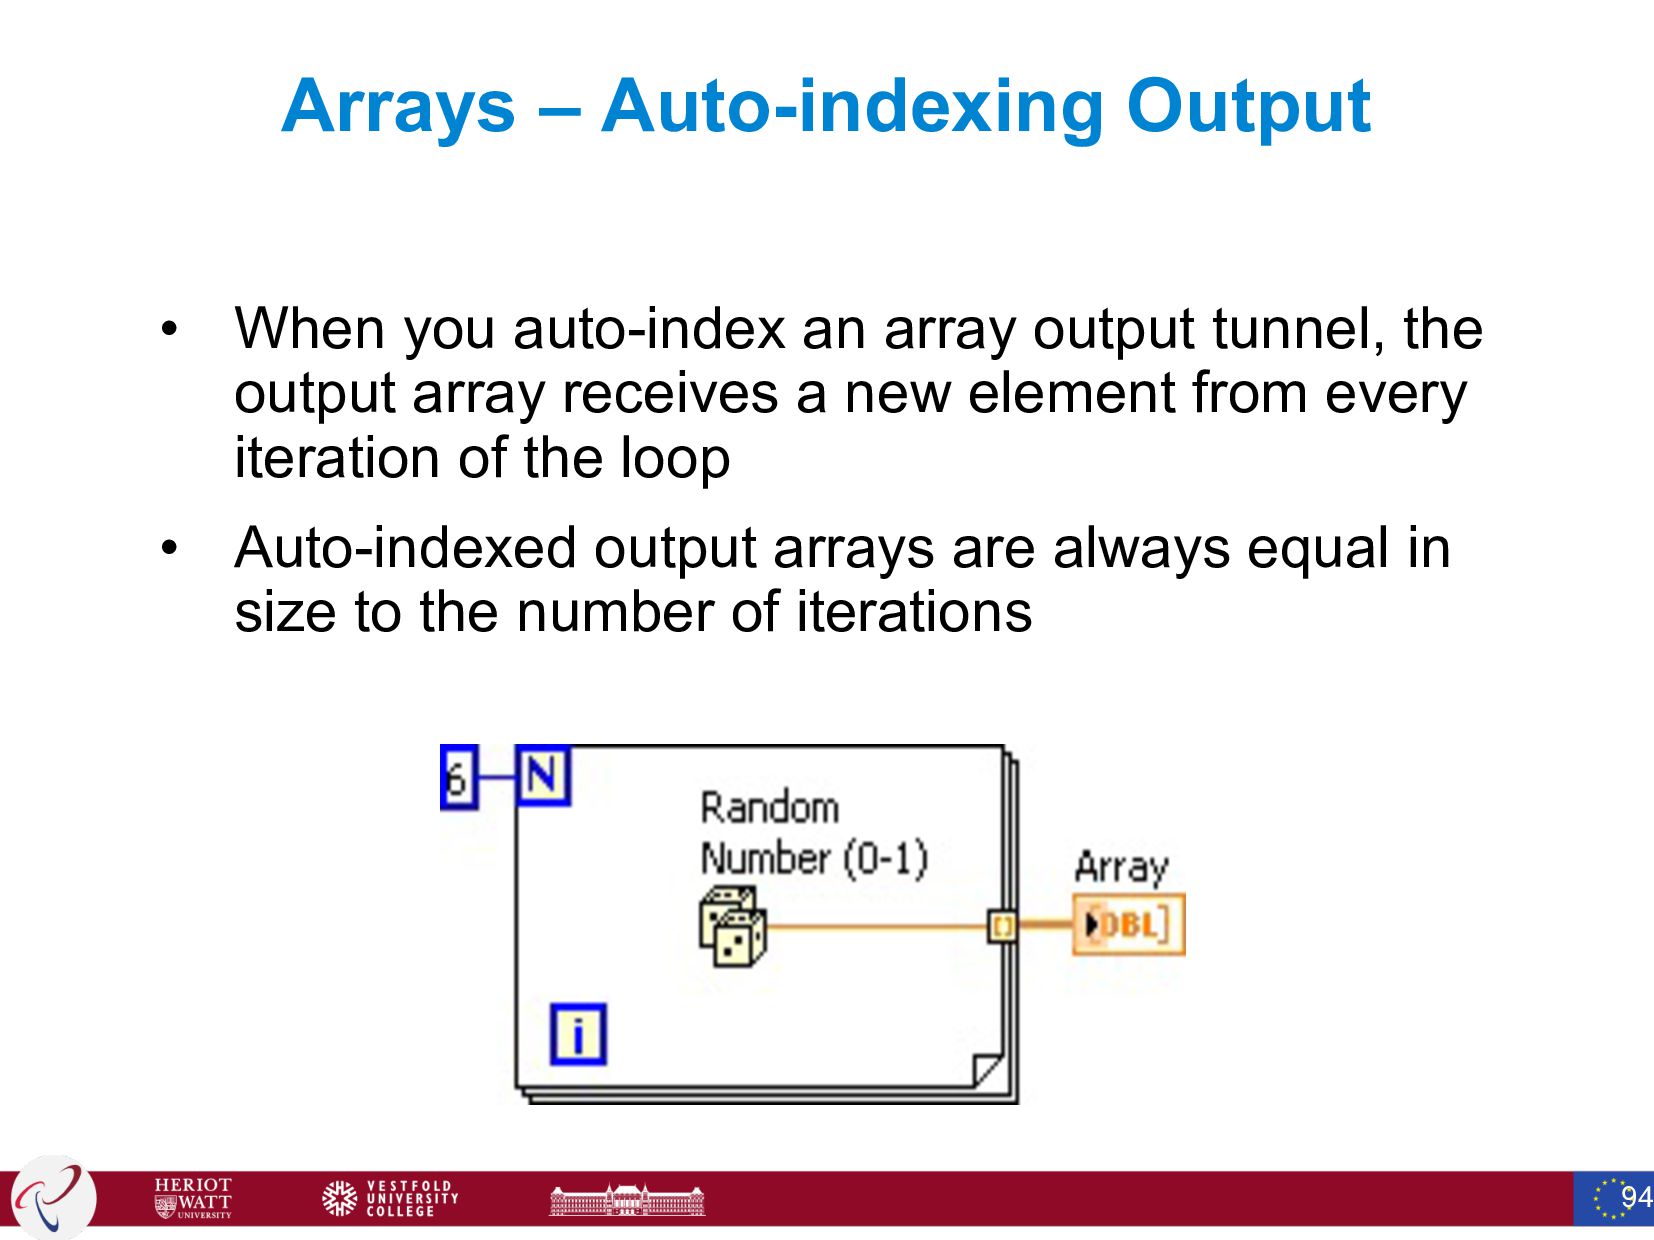
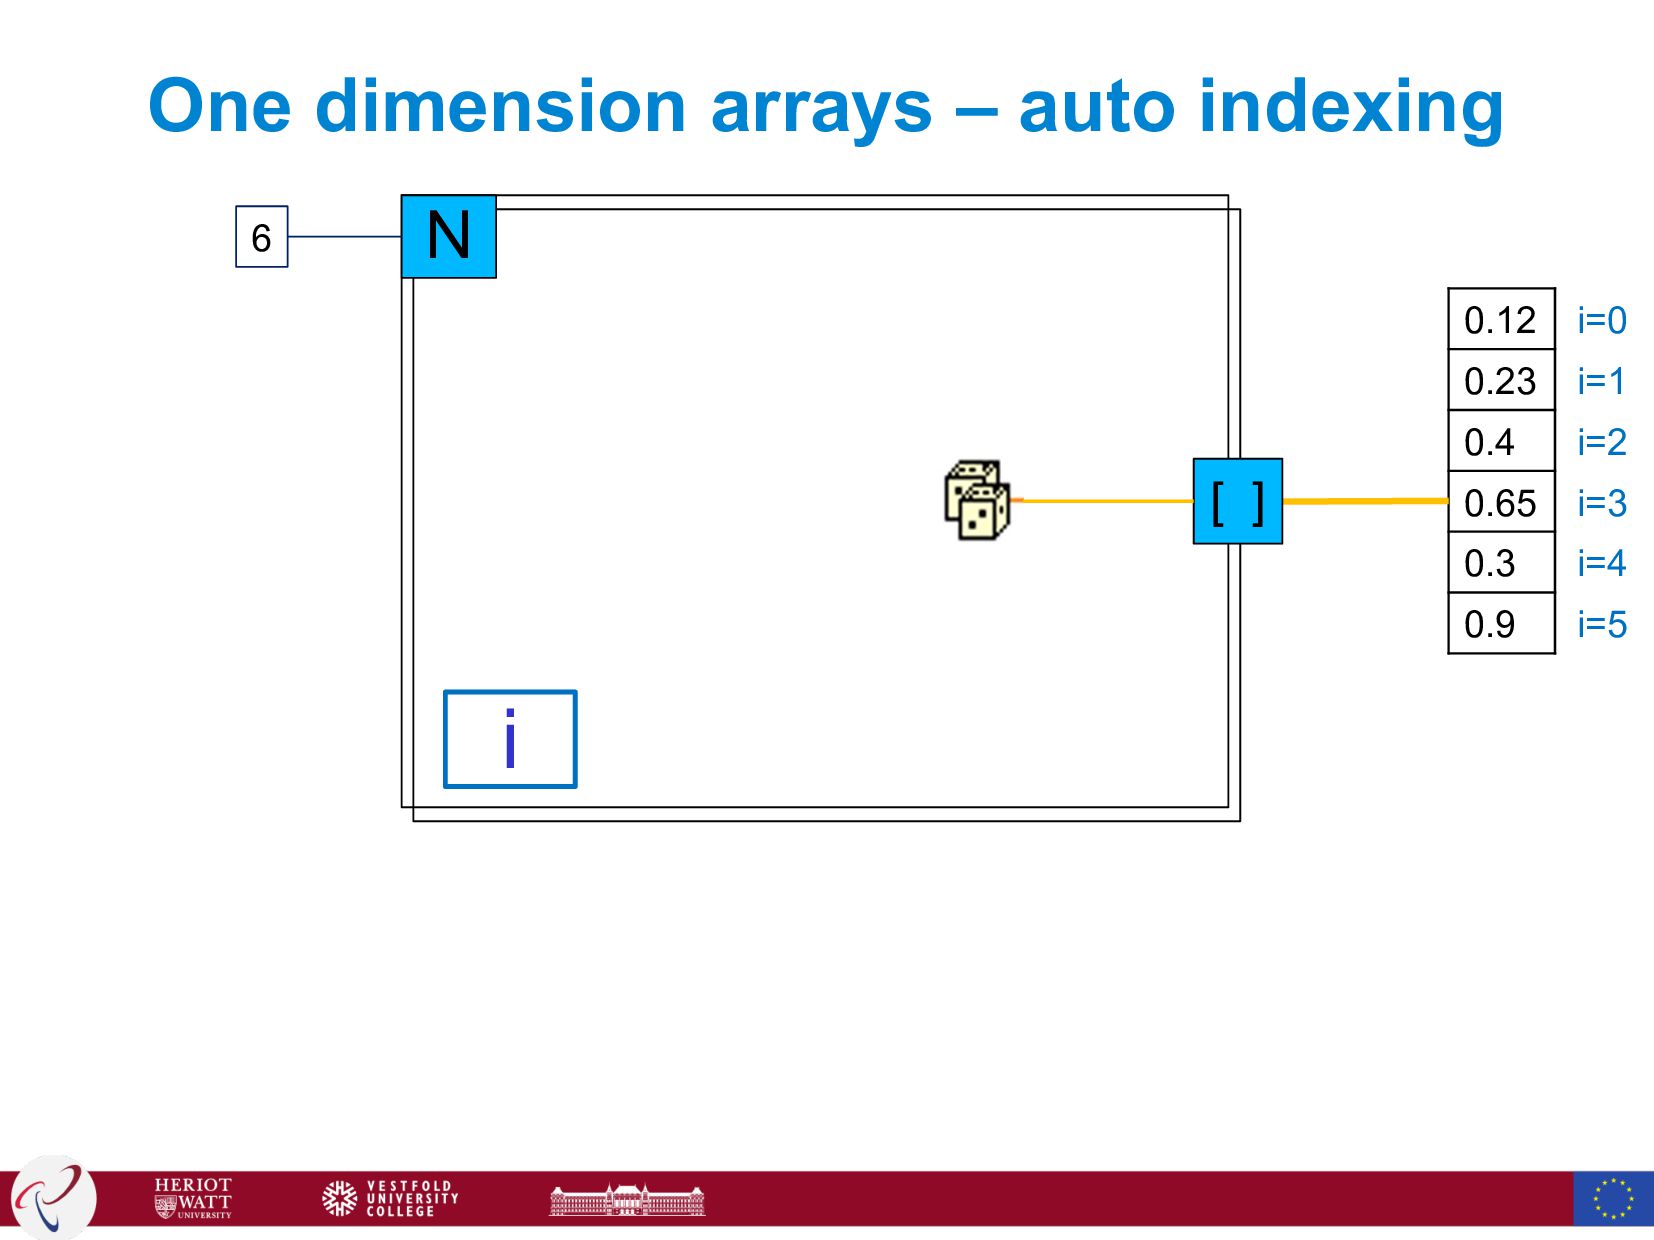
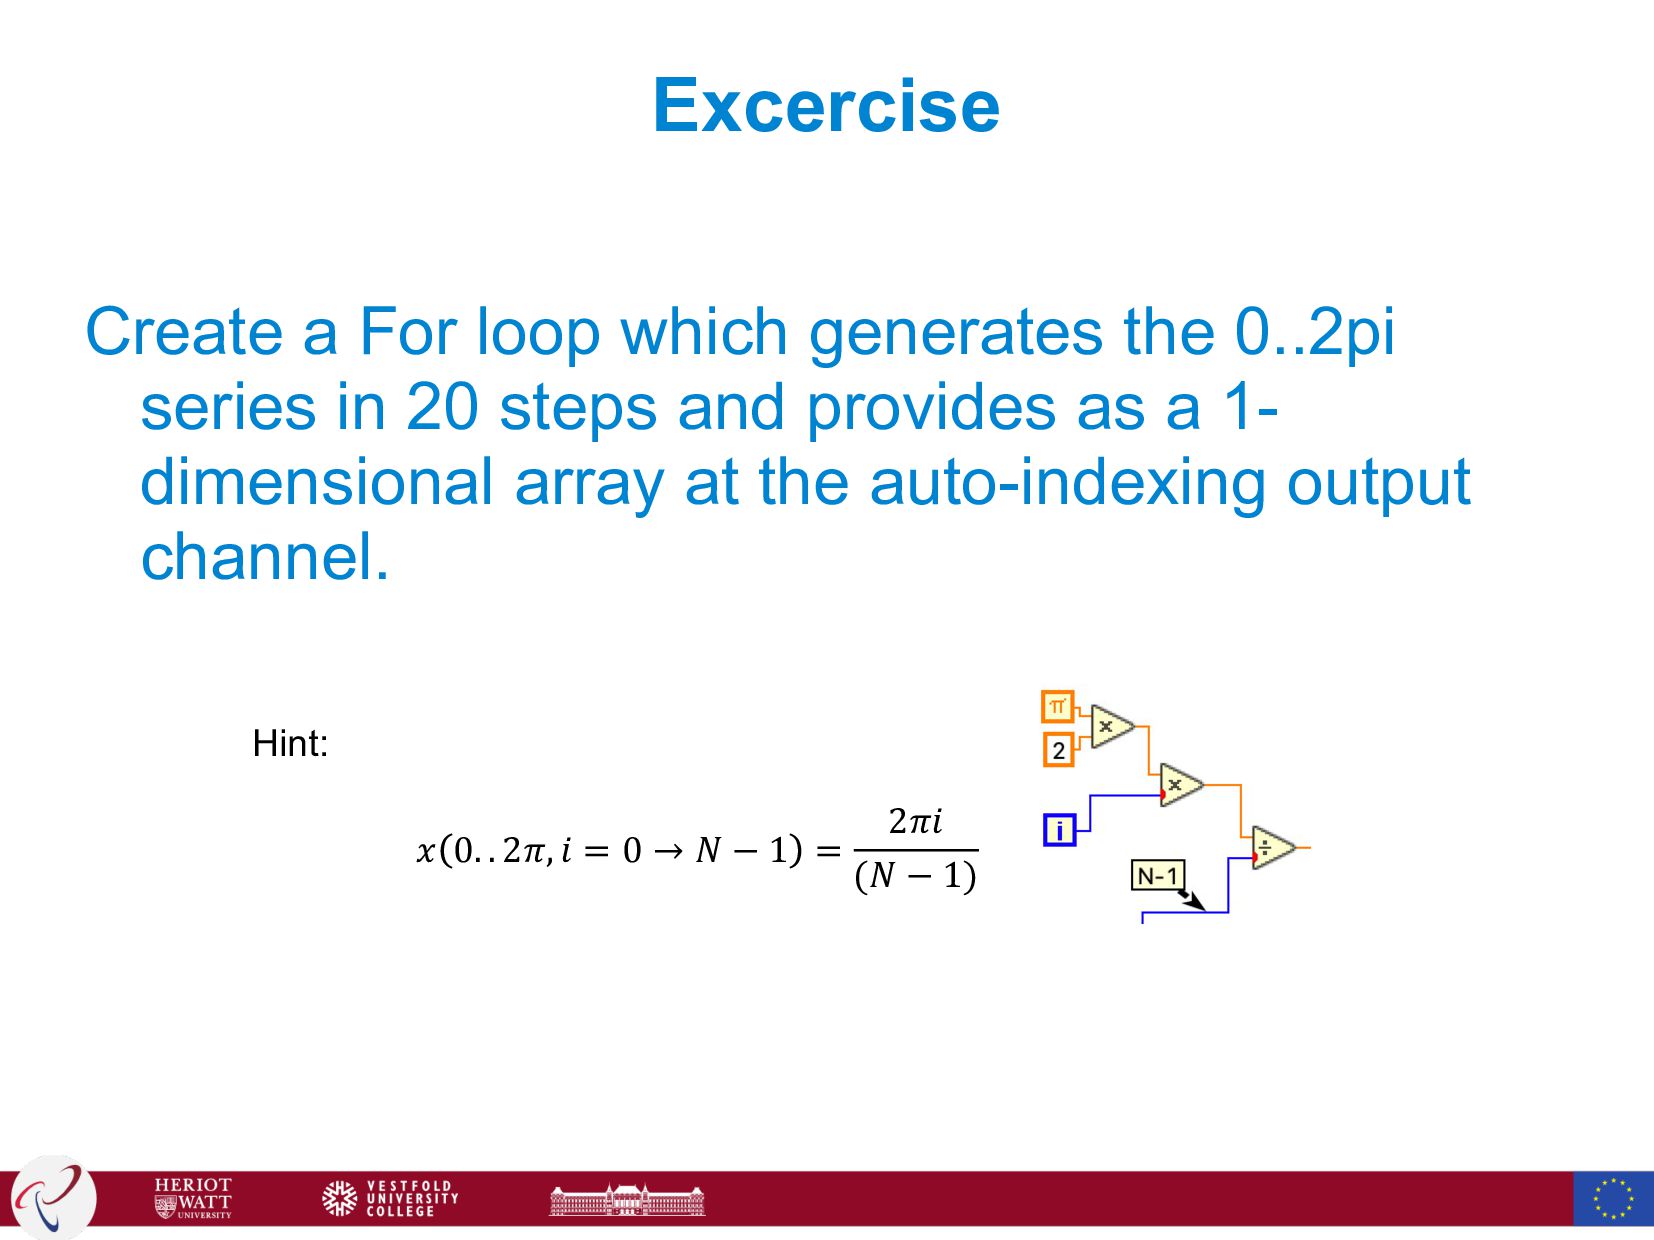
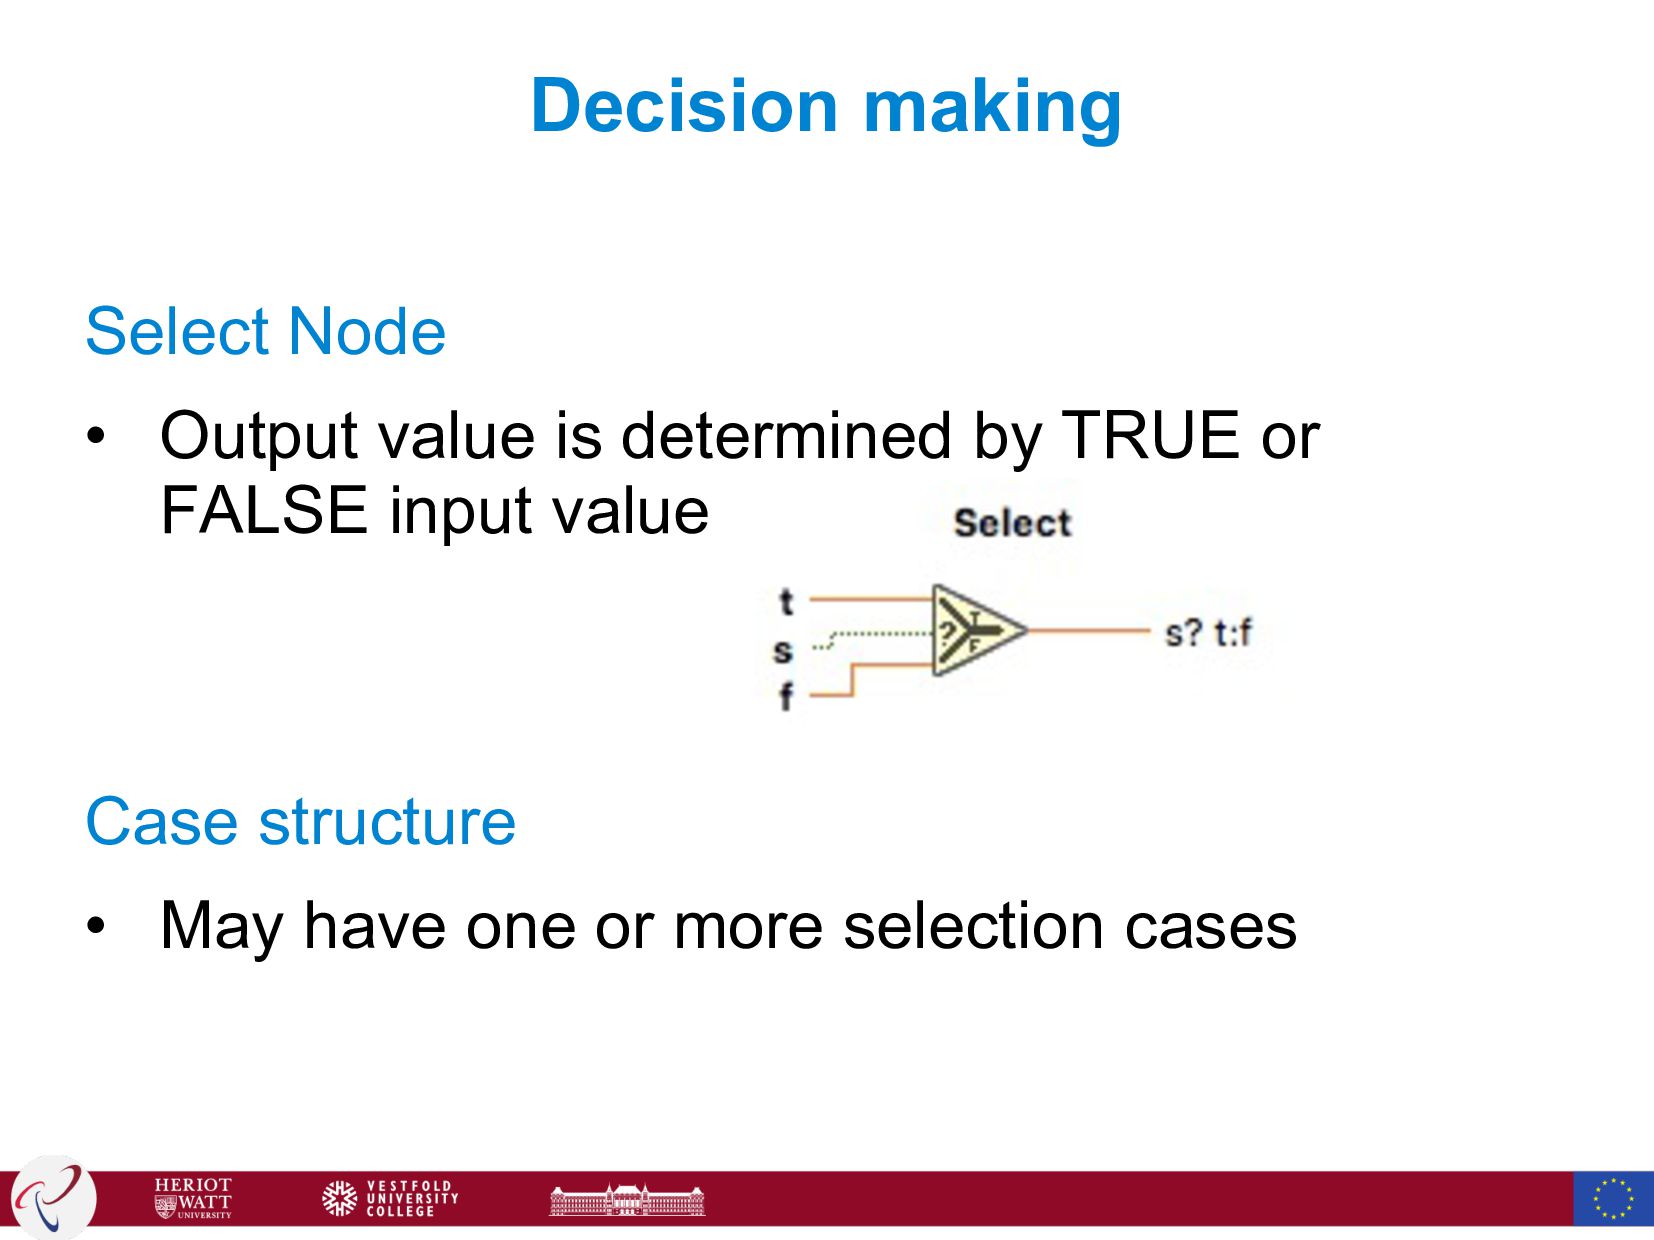
= 0:pi/20:2*pi; k=0; y = sin(t); h = plot(t,y,'YDataSource','y'); while (get(handles.ck_run,'Value')) k=k+0.1; f=get(handles.sl_freq,'Value'); y = sin(t.*f+k); refreshdata(h,'caller'); drawnow; pause(.1); end HOW: Allocate memory for the variable “k”, and store a numeric value “0” in this variable HOW: Load the variable “k”, and add 0.1 to its original value, and store the new value in “k”