student at Université Catholique de Louvain (Belgium) A MRI committer, mainly interested in what’s happening for the next version and of course in anything benchmark-related
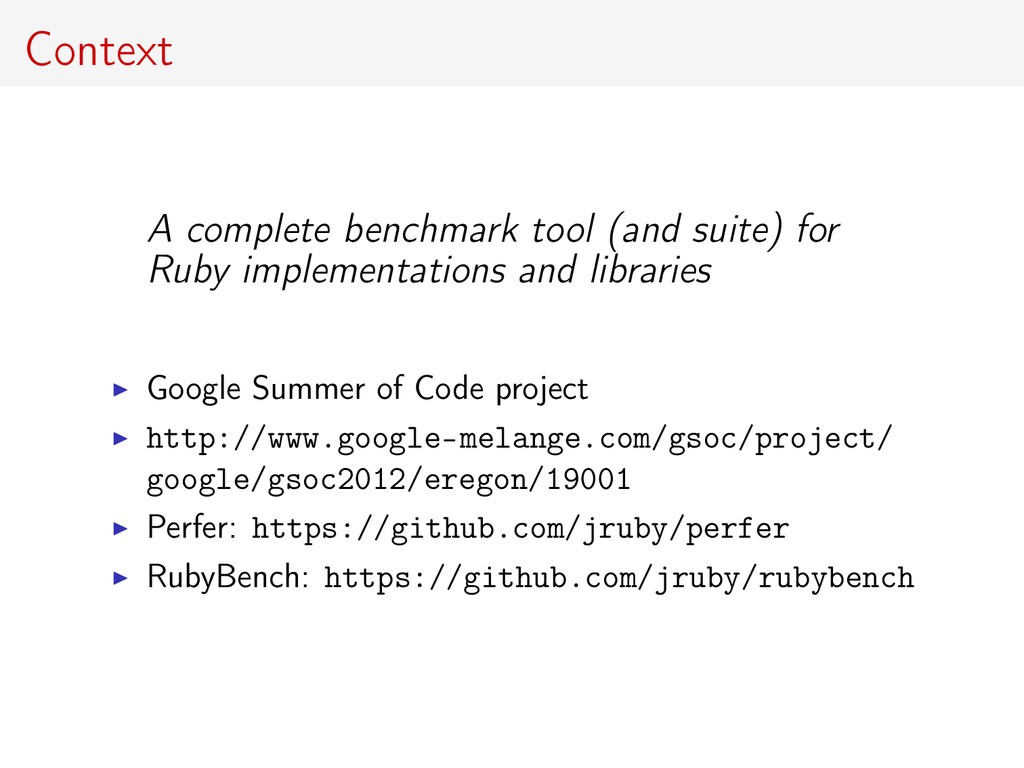
and libraries Google Summer of Code project http://www.google-melange.com/gsoc/project/ google/gsoc2012/eregon/19001 Perfer: https://github.com/jruby/perfer RubyBench: https://github.com/jruby/rubybench
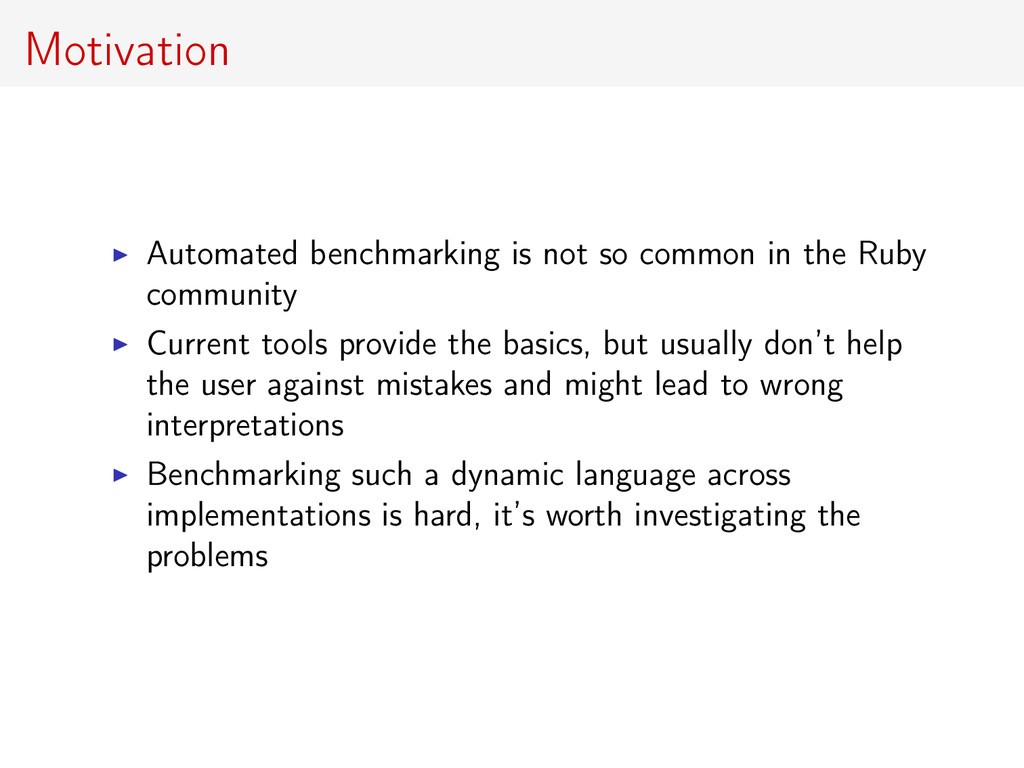
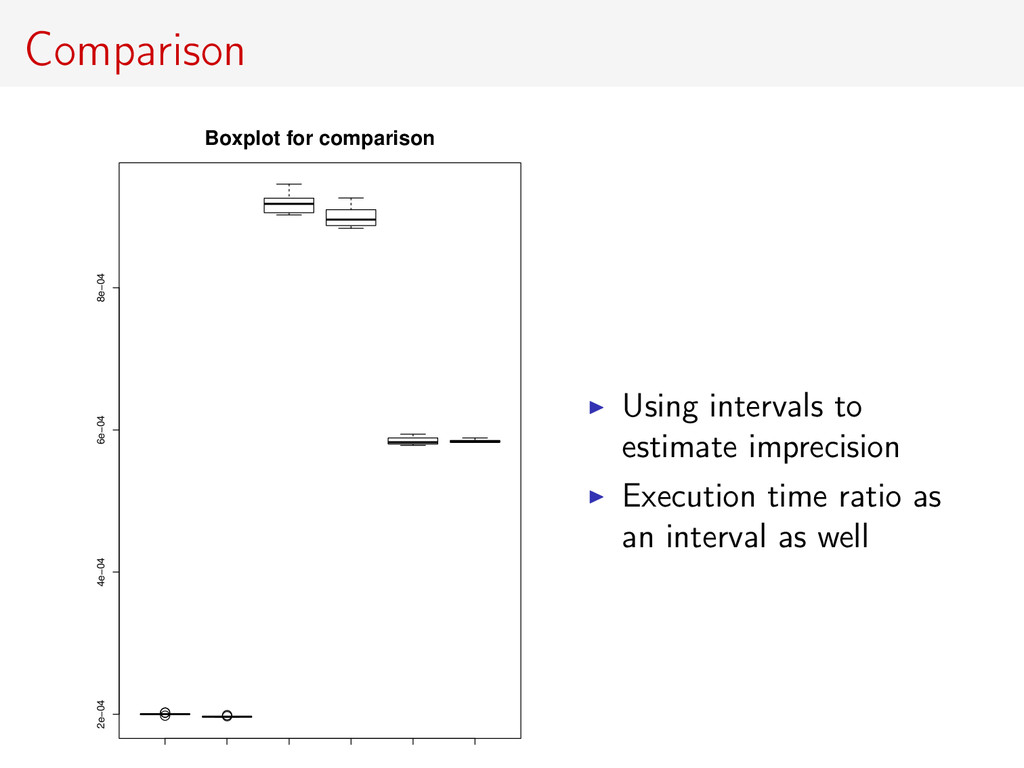
community Current tools provide the basics, but usually don’t help the user against mistakes and might lead to wrong interpretations Benchmarking such a dynamic language across implementations is hard, it’s worth investigating the problems
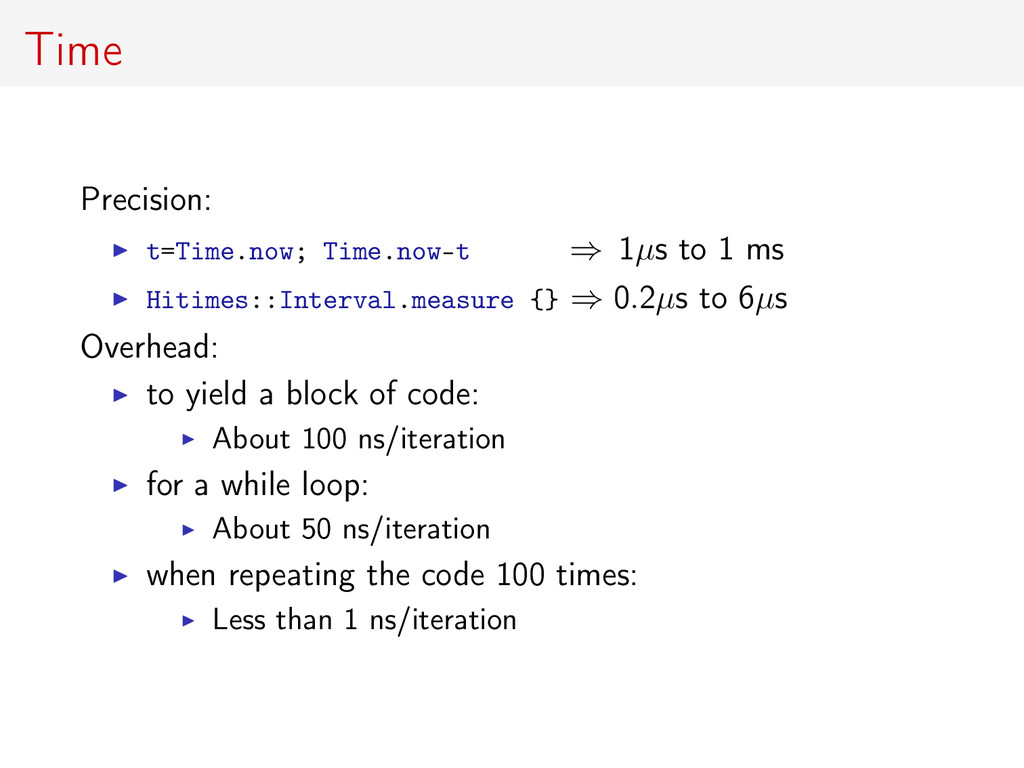
{} ⇒ 0.2µs to 6µs Overhead: to yield a block of code: About 100 ns/iteration for a while loop: About 50 ns/iteration when repeating the code 100 times: Less than 1 ns/iteration
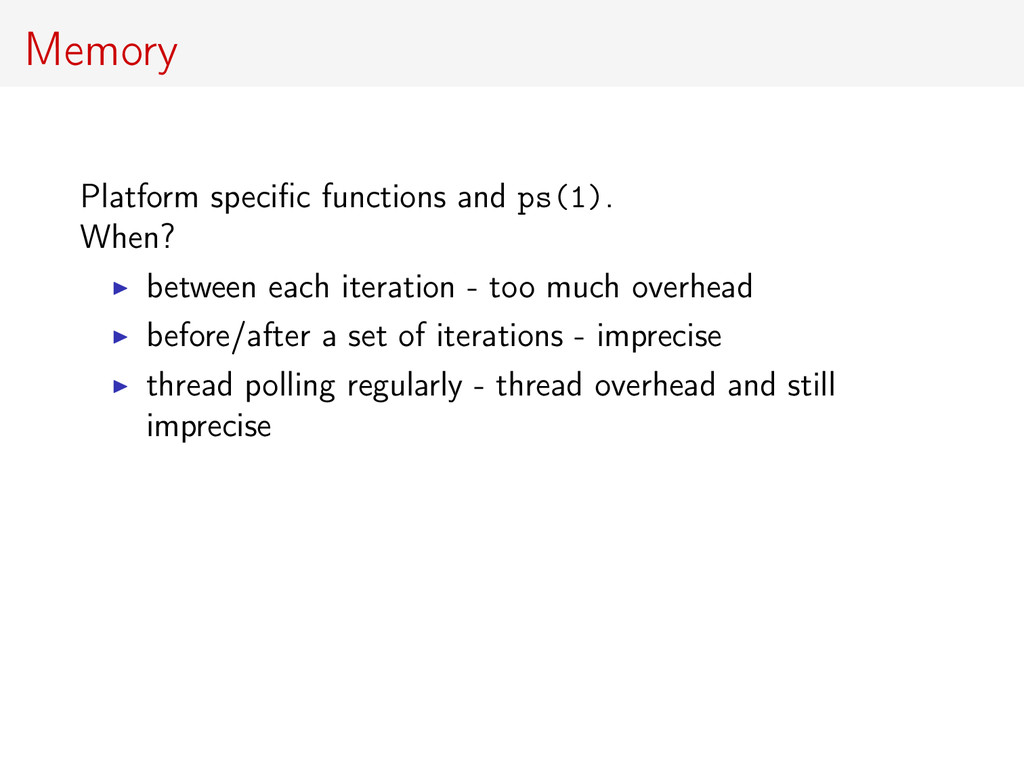
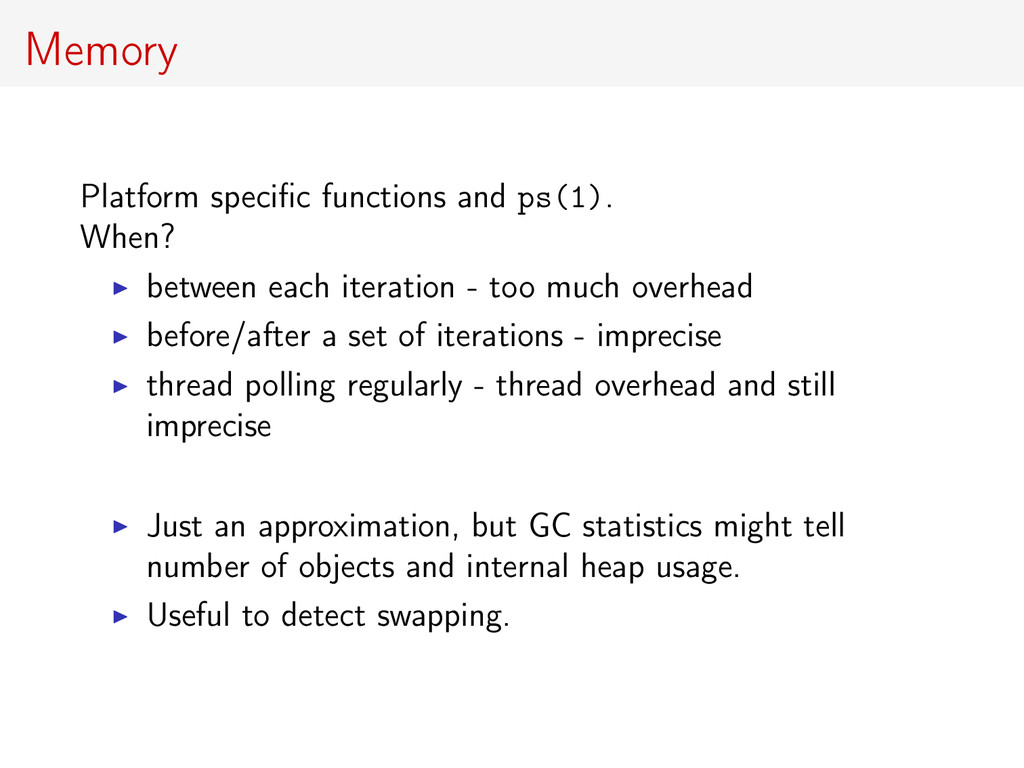
- too much overhead before/after a set of iterations - imprecise thread polling regularly - thread overhead and still imprecise Just an approximation, but GC statistics might tell number of objects and internal heap usage. Useful to detect swapping.
ruby bench.rb Does not work well for JRuby because of VM invocation Not very stable, depends a lot on very few code loaded and initial memory usage Inequality of running times: 0.03 seconds to 2 minutes Makes comparison difficult
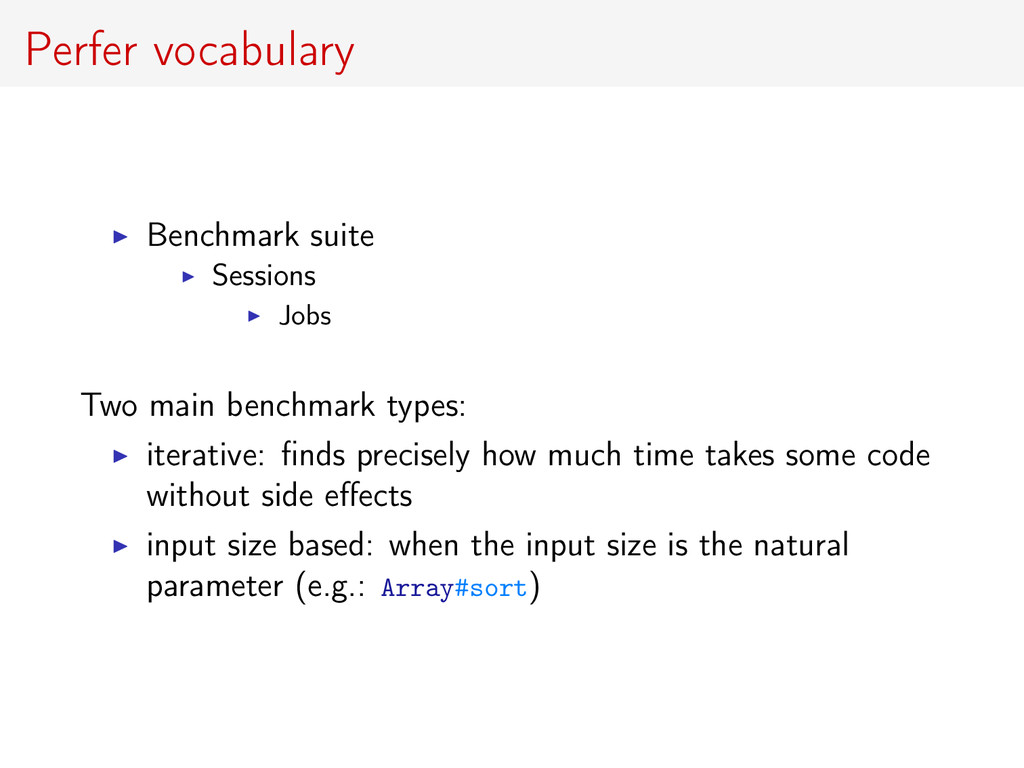
iterative: finds precisely how much time takes some code without side effects input size based: when the input size is the natural parameter (e.g.: Array#sort)
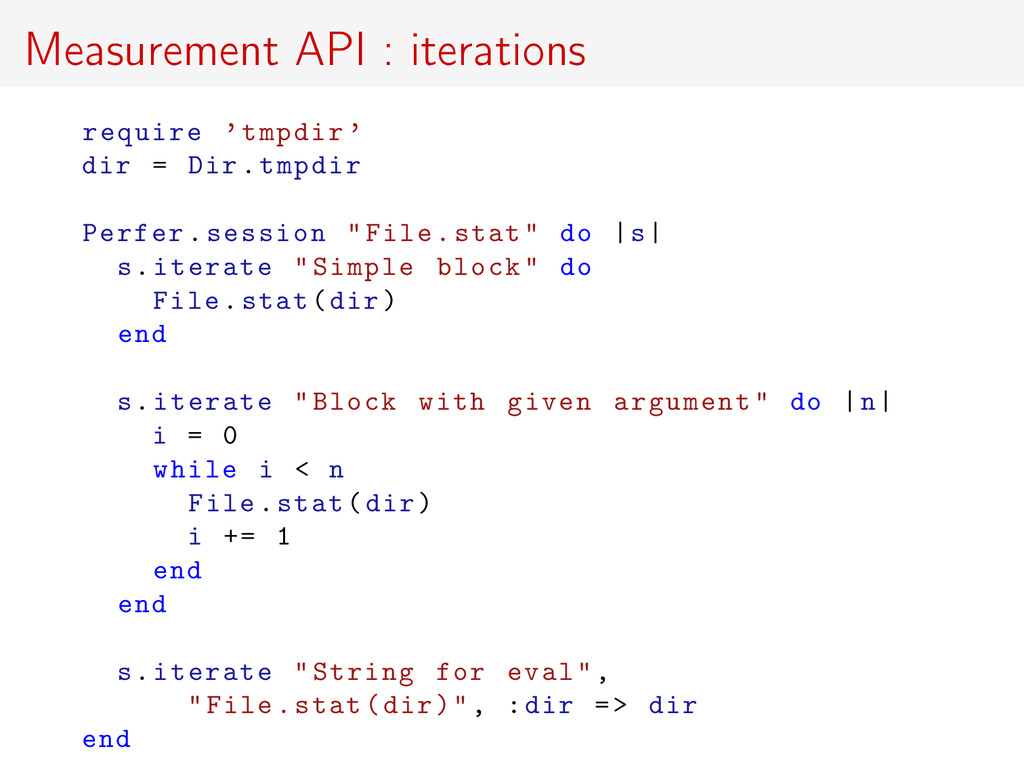
Perfer.session "File.stat" do |s| s.iterate "Simple block" do File.stat(dir) end s.iterate "Block with given argument" do |n| i = 0 while i < n File.stat(dir) i += 1 end end s.iterate "String for eval", "File.stat(dir)", :dir => dir end
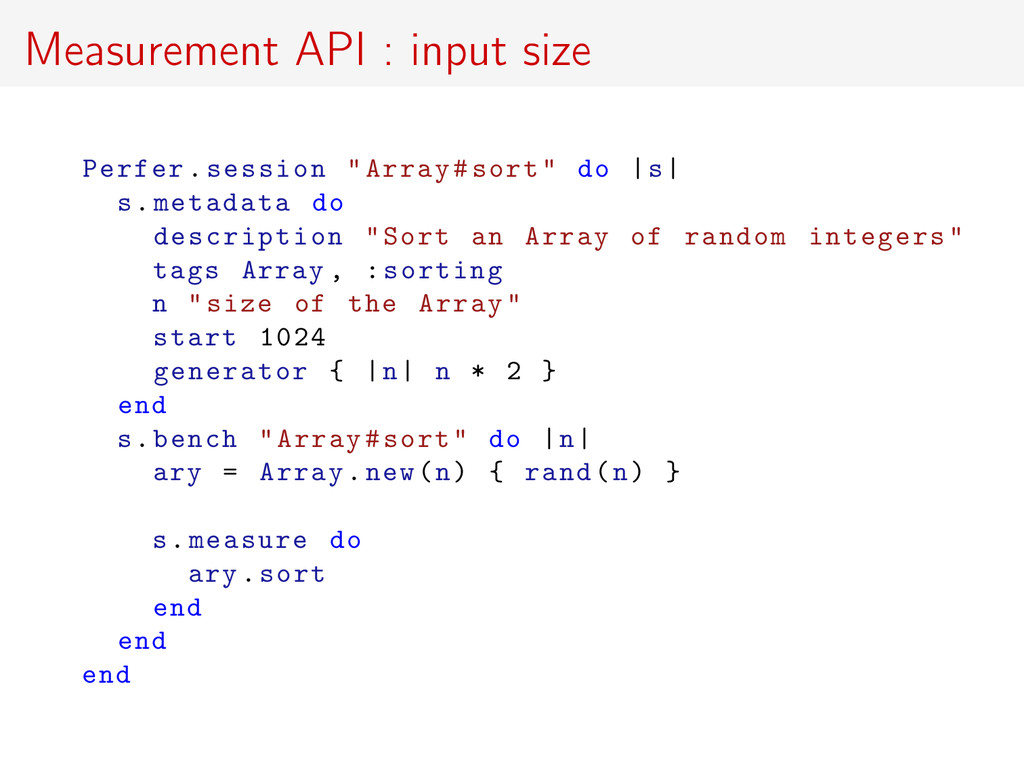
do description "Sort an Array of random integers" tags Array , :sorting n "size of the Array" start 1024 generator { |n| n * 2 } end s.bench "Array#sort" do |n| ary = Array.new(n) { rand(n) } s.measure do ary.sort end end end
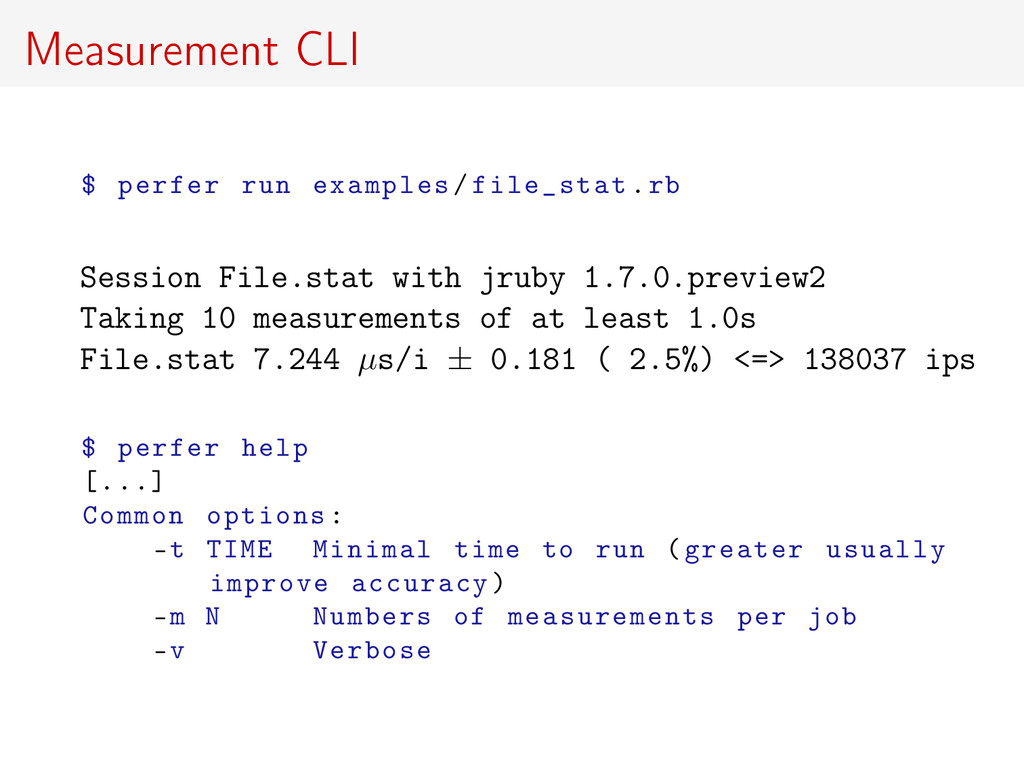
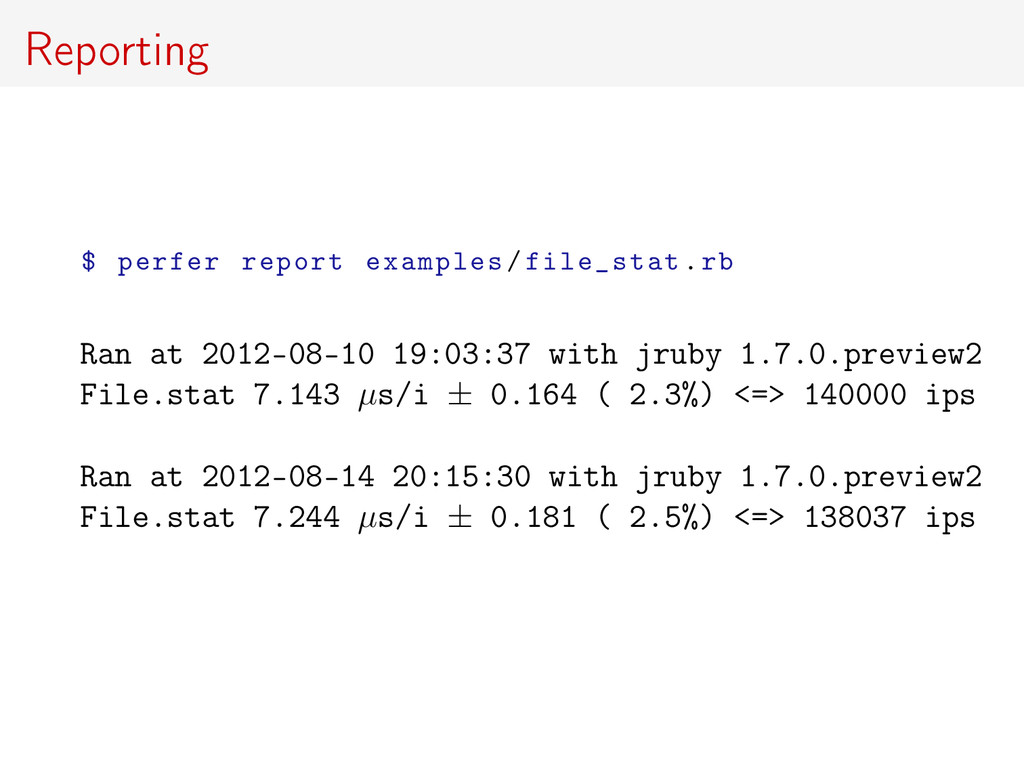
1.7.0.preview2 Taking 10 measurements of at least 1.0s File.stat 7.244 µs/i ± 0.181 ( 2.5%) <=> 138037 ips $ perfer help [...] Common options: -t TIME Minimal time to run (greater usually improve accuracy) -m N Numbers of measurements per job -v Verbose
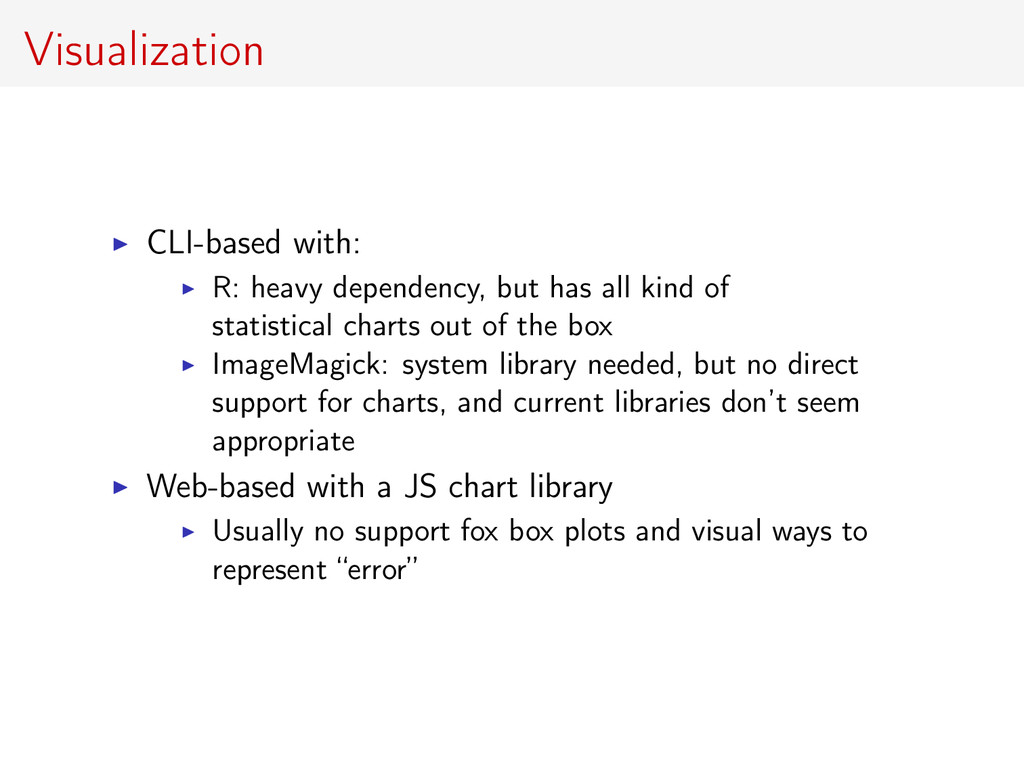
of statistical charts out of the box ImageMagick: system library needed, but no direct support for charts, and current libraries don’t seem appropriate Web-based with a JS chart library Usually no support fox box plots and visual ways to represent “error”
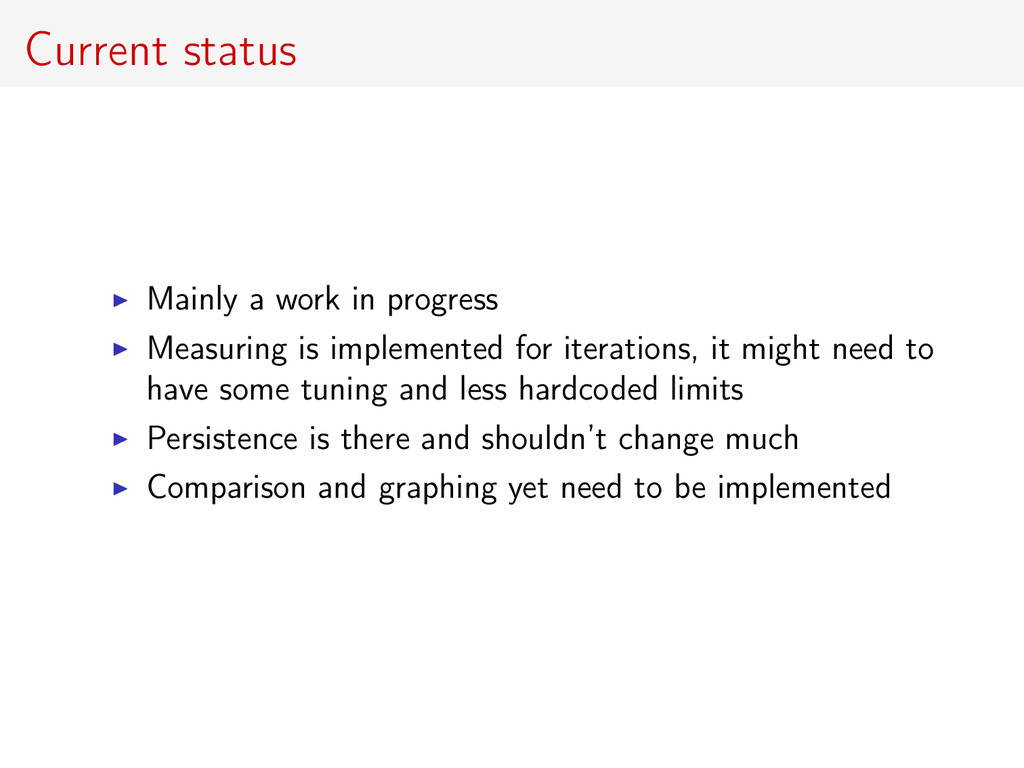
for iterations, it might need to have some tuning and less hardcoded limits Persistence is there and shouldn’t change much Comparison and graphing yet need to be implemented
new features like refinements, algorithm improvement, etc. Ability to compare performance meaningfully Having some sort of continuous benchmarking, which helps to see the changes over time in different scenarios. For implementations but also libraries.