Upgrade to Pro — share decks privately, control downloads, hide ads and more …

Study of Biological Sequence Structure: Clustering and Visualization

Saliya Ekanayake
February 08, 2013

Study of Biological Sequence Structure: Clustering and Visualization

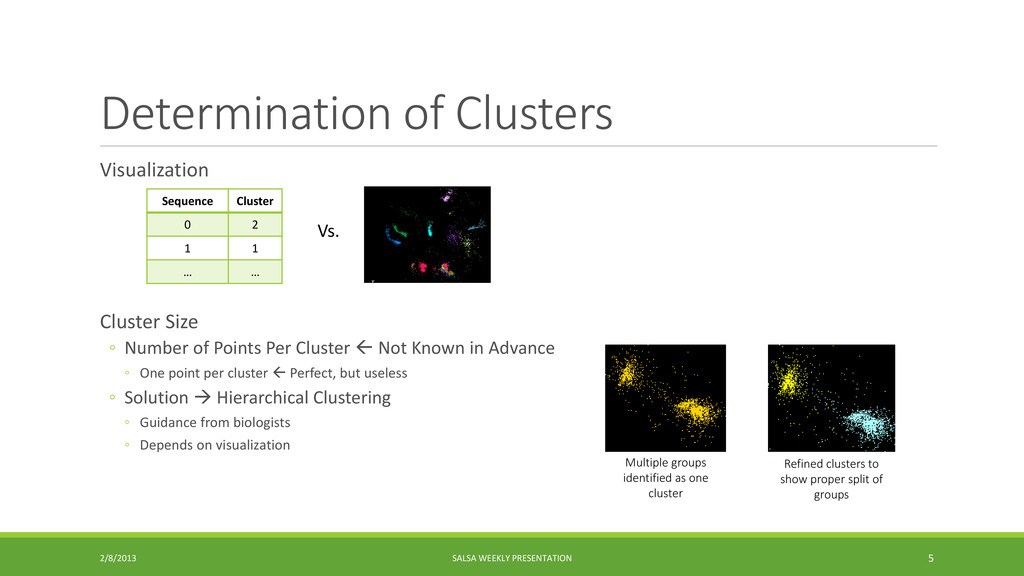
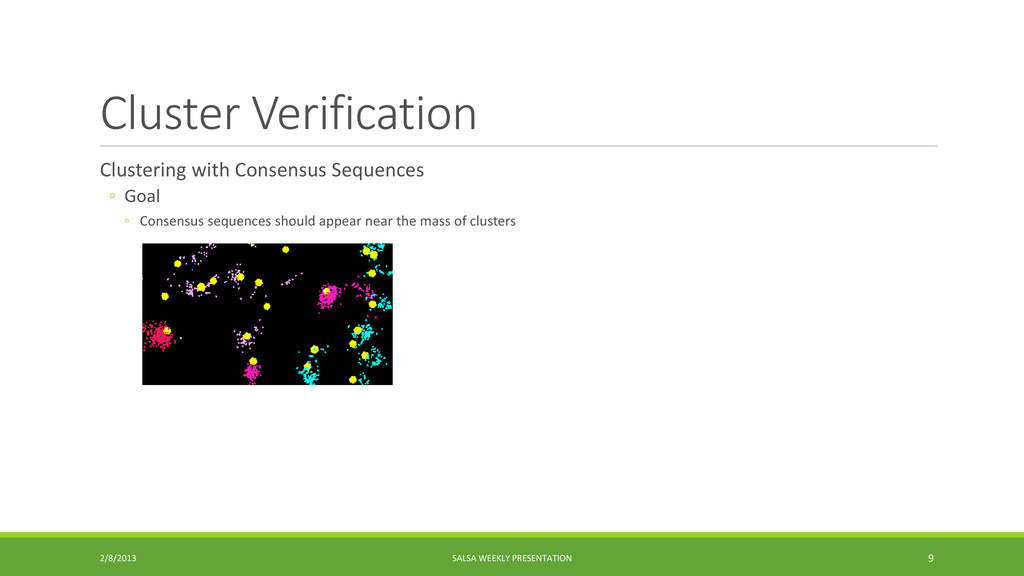
Determination of biologically related clusters of sequences is important bioinformatics analyses. The similarity between sequences is generally assessed based on their alignments with one another. This could be used with a clustering algorithm to determine groups of sequences, yet it is not straightforward how to get reliable results. We present the factors affecting the quality of clusters and how visualization aids in the refinement of results. We also present a way to verify clusters in the presence of consensus sequences, and represent clusters.

Saliya Ekanayake

February 08, 2013
Tweet

More Decks by Saliya Ekanayake

Other Decks in Research

Transcript

  1. Study of Biological Sequence Structure: Clustering and Visualization SALIYA EKANAYAKE

    2/8/2013 SALSA WEEKLY PRESENTATION 1 s e ka n aya @ c s . i n d i a n a . e d u
  2. Outline Research Effort ◦ Simple Architecture ◦ Determination of Clusters

    ◦ Visualization ◦ Cluster Size ◦ Effect of Gap Penalties ◦ Global Vs. Local Sequence Alignment ◦ Distance Types ◦ Cluster Verification ◦ Cluster Representation Sequel 2/8/2013 SALSA WEEKLY PRESENTATION 2
  3. 2/8/2013 SALSA WEEKLY PRESENTATION 3 Research Effort Identify similarities present

    in biological sequences and present them in a comprehensible manner to the biologists
  4. Simple Architecture 2/8/2013 SALSA WEEKLY PRESENTATION 4 D1 P1 D2

    P2 D3 P3 D4 P4 D5 Processes: P1 – Pairwise distance calculation P2 – Multi-dimensional scaling P3 – Pairwise clustering P4 – Visualization Data: D1 – Input sequences D2 – Distance matrix D3 – Three dimensional coordinates D4 – Cluster mapping D5 – Plot file
  5. Determination of Clusters Visualization Cluster Size ◦ Number of Points

    Per Cluster  Not Known in Advance ◦ One point per cluster  Perfect, but useless ◦ Solution  Hierarchical Clustering ◦ Guidance from biologists ◦ Depends on visualization 2/8/2013 SALSA WEEKLY PRESENTATION 5 Sequence Cluster 0 2 1 1 … … Vs. Multiple groups identified as one cluster Refined clusters to show proper split of groups
  6. Determination of Clusters Effect of Gap Penalties  Indistinguishable for

    the Test Data 2/8/2013 SALSA WEEKLY PRESENTATION 6 Data Set Sample of 16S rRNA Number of Sequences 6822 Alignment Type Smith-Waterman Scoring Matrix EDNAFULL Ref. Gap Open -4 -4 -8 -10 -16 -16 -16 -20 -20 -20 -24 -24 -24 -24 Gap Extension -2 -4 -4 -4 -4 -8 -16 -4 -8 -16 -4 -8 -16 -20 Reference -16/-4 -10/-4 -4/-4
  7. Determination of Clusters Global Vs. Local Sequence Alignment 2/8/2013 SALSA

    WEEKLY PRESENTATION 7 Sequence 1 TTGAGTTTTAACCTTGCGGCCGTA Sequence 2 AAGTTTCTTGCCGG Global alignment TTGAGTTTTAACCTTGCGGCCGTA |||||| ||| |||| ---AAGTTT---CTT---GCCG–G Local alignment ttgagttttaacCTTGCGGccgta ||||||| aagtttCTTGCGG 0 100 200 300 400 500 2 3 4 5 6 7 8 9 Count Point Number Total Mismatches Mismatches by Gaps Original Length Long thin line formation with global alignment Reasonable structure with local alignment Global alignment has formed superficial alignments when sequence lengths differ greatly !
  8. Determination of Clusters Distance Types ◦ Example Alignment ◦ Calculation

    of Score ◦ Percent Identity ◦ = 1.0 − ◦ N is number of identical pairs ◦ L is total number of pairs 2/8/2013 SALSA WEEKLY PRESENTATION 8 A T C G A 5 -4 -4 -4 T -4 5 -4 -4 C -4 -4 5 -4 G -4 -4 -4 5 GO = -16 GE = -4 T C A A C C A - T T - - - C T G 5 -4 -16 -4 -4 5 -4 -16 = 5 + −4 + −16 + −4 + −4 + 5 + −4 + −16 = −38 Aligned region ◦ Normalized Scores ◦ = 1.0 − ′′+ ′′ ◦ = 1.0 − ′′+ ′′ ◦ = 1.0 − ′′+ ′′ ◦ = 1.0 − + ◦ = 1.0 − + ◦ is the score for sequences and ◦ ′′ is the score for sub sequences of and in the aligned region Local normalized scores correlate with percent identity, but not global normalized scores !
  9. Cluster Verification Clustering with Consensus Sequences ◦ Goal ◦ Consensus

    sequences should appear near the mass of clusters 2/8/2013 SALSA WEEKLY PRESENTATION 9
  10. Cluster Representation Sequence Mean ◦ Find the sequence that corresponds

    to the minimum mean distance to other sequences in a cluster Euclidean Mean ◦ Find the sequence that corresponds to the minimum mean Euclidean distance to other points in a cluster Centroid of Cluster ◦ Find the sequence nearest to the centroid point in the Euclidean space Sequence/Euclidean Min/Max ◦ Alternatives to first two definitions using minimum or maximum distances instead of mean 2/8/2013 SALSA WEEKLY PRESENTATION 10
  11. Sequel Study of Statistical Significance More Insight on Score as

    a Distance Measure 2/8/2013 SALSA WEEKLY PRESENTATION 11
  12. References Million Sequence Project http://salsahpc.indiana.edu/millionseq/ The Fungi Phylogenetic Project http://salsafungiphy.blogspot.com/

    The COG Project http://salsacog.blogspot.com/ SALSA HPC Group http://salsahpc.Indiana.edu 2/8/2013 SALSA WEEKLY PRESENTATION 12