Upgrade to Pro — share decks privately, control downloads, hide ads and more …

Red Cross LA GIS Brown Bag

Red Cross LA GIS Brown Bag

A brown bag lunch presentation on the work done by the GIS Team for the Red Cross LA.

evanlue

May 10, 2013
Tweet

Other Decks in Business

Transcript

  1. What is GIS? • Geographic Information Systems – Using Location

    – Managing Data – Visualizing with Graphics – More than a Tool • We Make Data Products – Spatial Intelligence and Analytics
  2. Our Mission To support planning and operations by making information

    readily available in a visual and easy-to-understand format.
  3. Who We Are Role Member Which One? GIS Project Lead

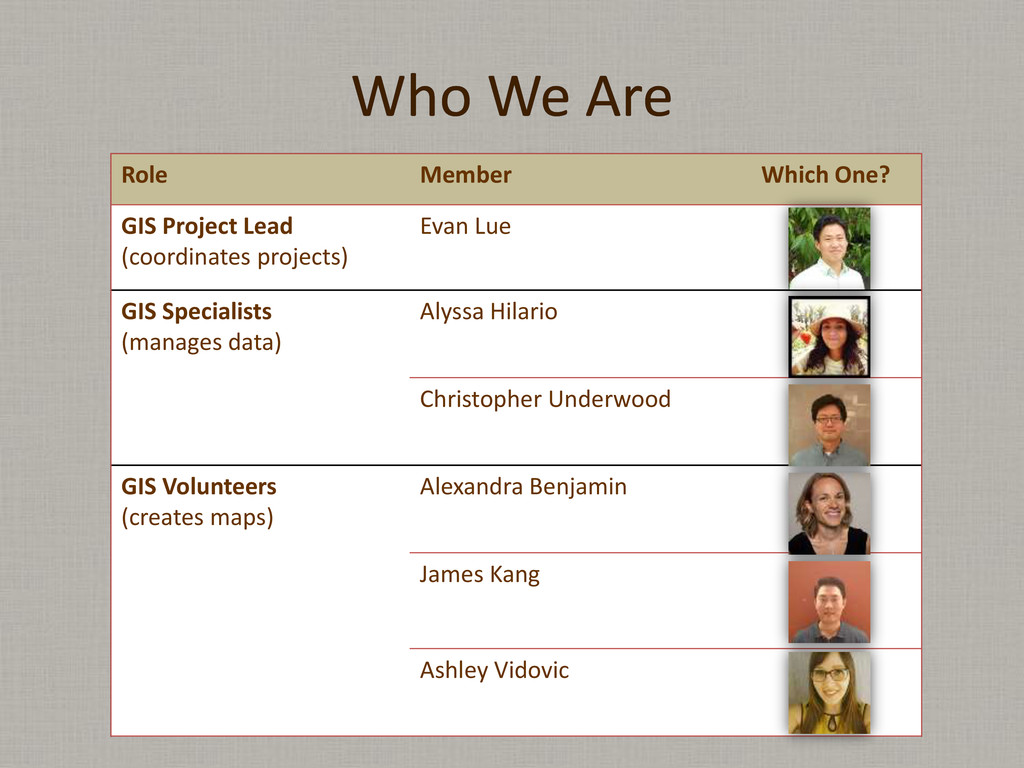
    (coordinates projects) Evan Lue GIS Specialists (manages data) Alyssa Hilario Christopher Underwood GIS Volunteers (creates maps) Alexandra Benjamin James Kang Ashley Vidovic
  4. Making a Map is Really Easy • Google – My

    Maps – Fusion Tables – Maps Engine – Crisis Map • BatchGeo • GeoCommons • ArcGIS.com
  5. What You Need to Make a Map • Table of

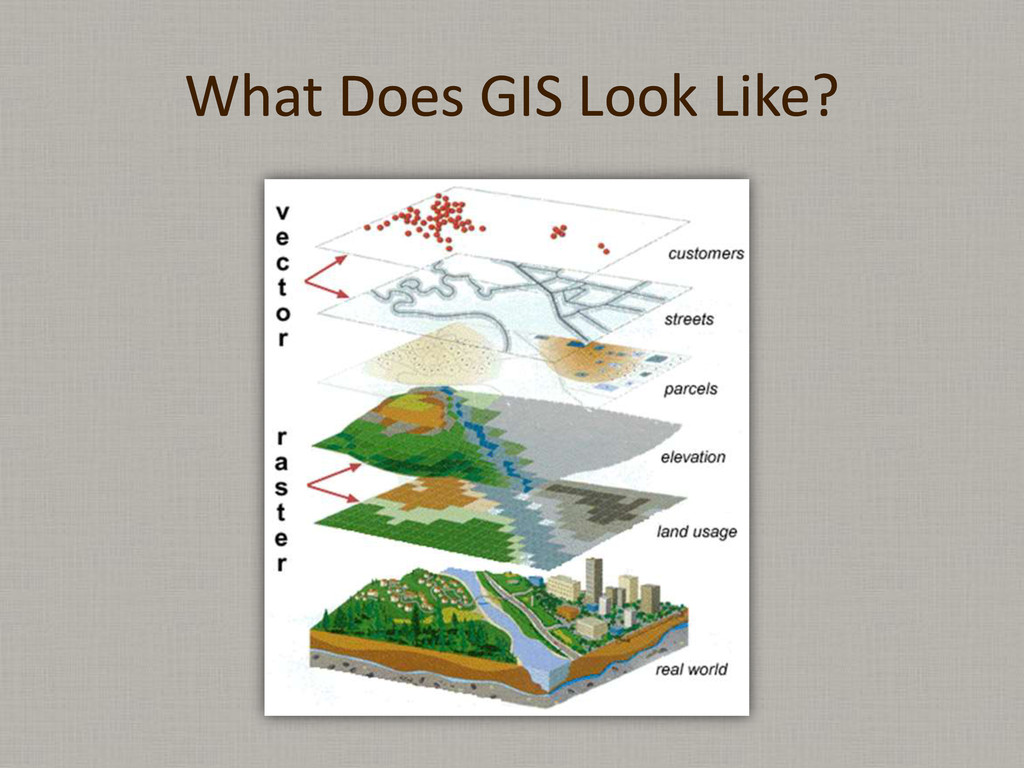
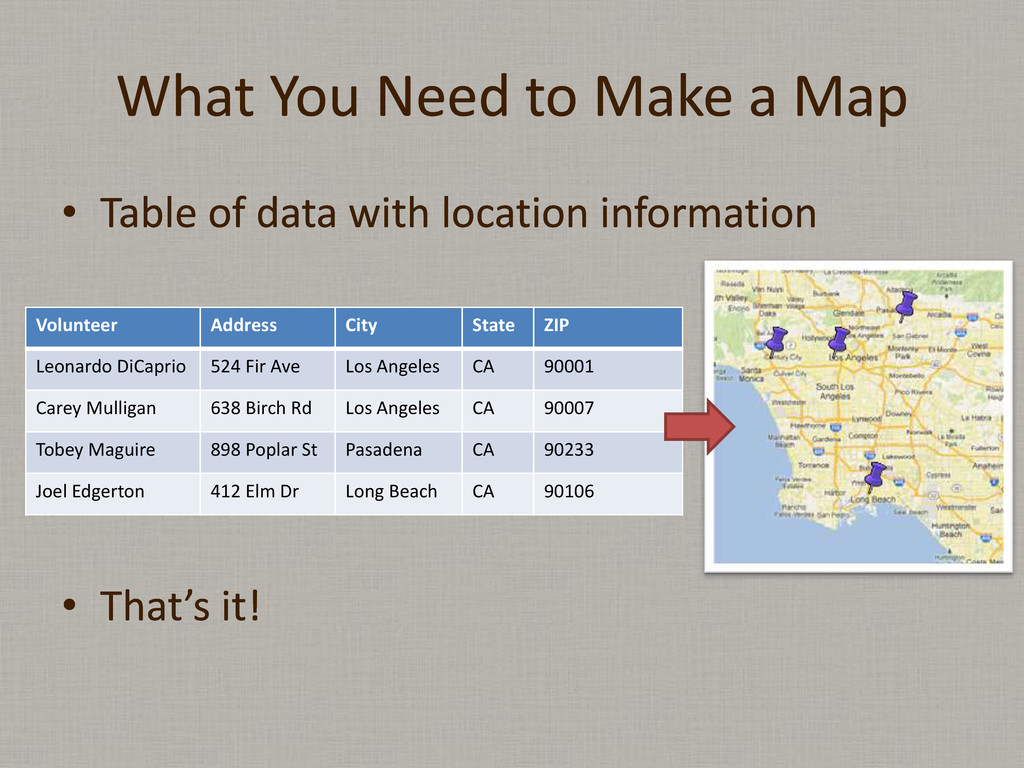
    data with location information • That’s it! Volunteer Address City State ZIP Leonardo DiCaprio 524 Fir Ave Los Angeles CA 90001 Carey Mulligan 638 Birch Rd Los Angeles CA 90007 Tobey Maguire 898 Poplar St Pasadena CA 90233 Joel Edgerton 412 Elm Dr Long Beach CA 90106
  6. So Why Does GIS Seem Hard? • More than points:

    lines and polygons • Lots of data • Versioning • Editing • Horizontal Integration (like IT) • Sharing • Security • Quality
  7. Services We Provide (1 of 3) • https://redcrossmaps.sdsu.edu • Put

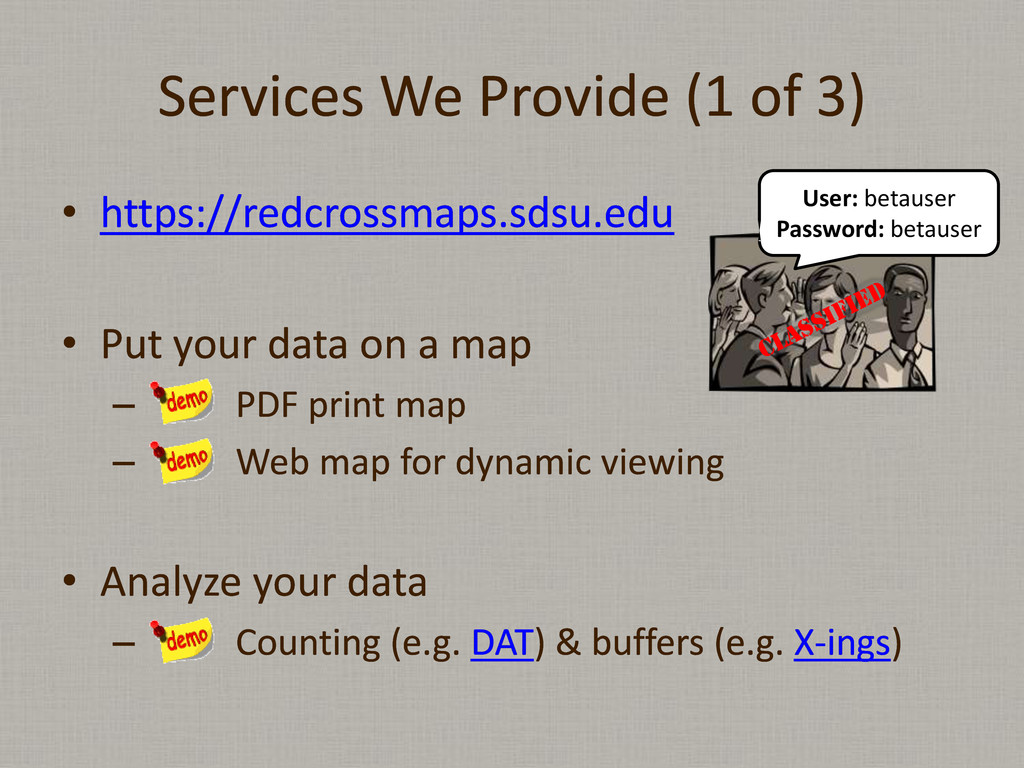
    your data on a map – PDF print map – Web map for dynamic viewing • Analyze your data – Counting (e.g. DAT) & buffers (e.g. X-ings) User: betauser Password: betauser
  8. Services We Provide (2 of 3) • Finding / Creating

    Data – Demographics (e.g. IRPIC) – Non-Traditional Shelters • Data Centralization and Authority – Editors • Printing big things (up to ANSI D, 22x34) – Maps, signs, charts, etc.
  9. Services We Provide (3 of 3) • We share data

    with other agencies and organizations – LA County – SD County – Healthy City
  10. Using ArcGIS.com • Shelters as an Example – Find an

    address – Put on a filter/query (Cap > 100, Showers > 0) – View the table – Configure pop-ups – Multiple layers / change transparency – View the legend – Saving your own map – Fixing errors
  11. Our 2 Biggest Challenges 1. Most Data is not Live

    2. Data Centralization – Departments within chapters – Chapters – Data owners – Geographic scales (districts, areas, etc.)
  12. Where Does Information Live? • Grady’s computer, Liz’s computer, Lauren’s

    computer (unique to people) • M:/ Drive (unique to LA) • Salesforce, NSS, CAS/Webi, Saba, Volunteer Connection (doesn’t feed/interoperate) • Zoho, Google Drive (doesn’t feed/interoperate)
  13. What’s Next • Give other chapters the gift of GIS

    • Come up with more use cases • Update early and often • You tell us GIS
  14. Upcoming Event • Geospatial LA ( group) • Thursday, May

    30 at 5:30pm • EOC Tour and Mock Incident Response • Followed by a mixer