Upgrade to Pro — share decks privately, control downloads, hide ads and more …

Advanced Analytics using QlikView and R

Advanced Analytics using QlikView and R

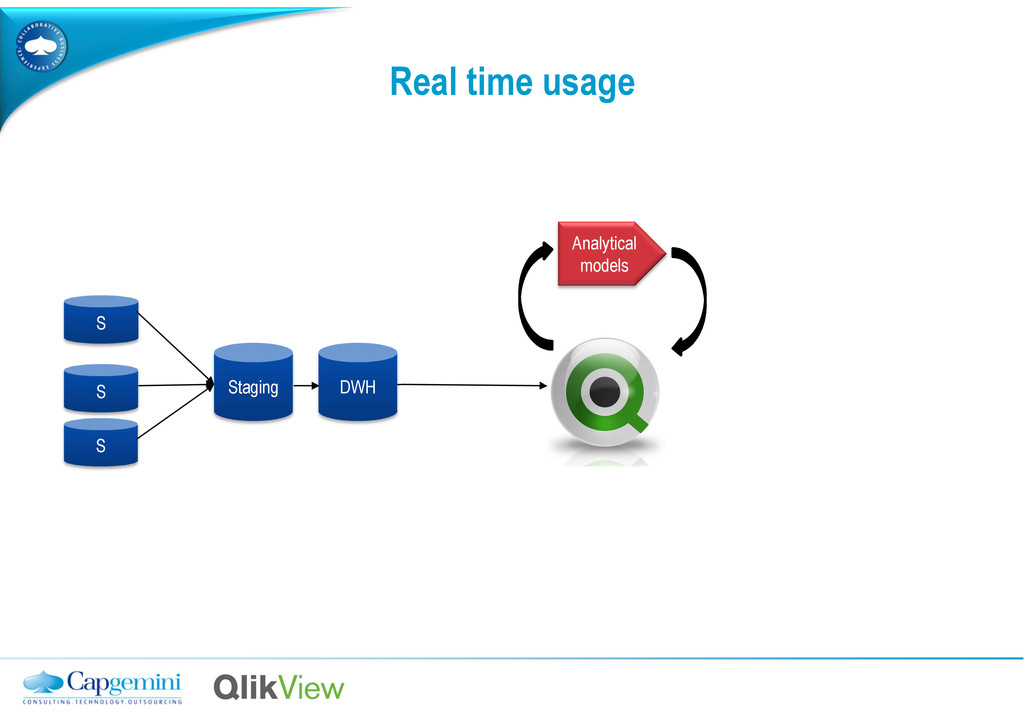
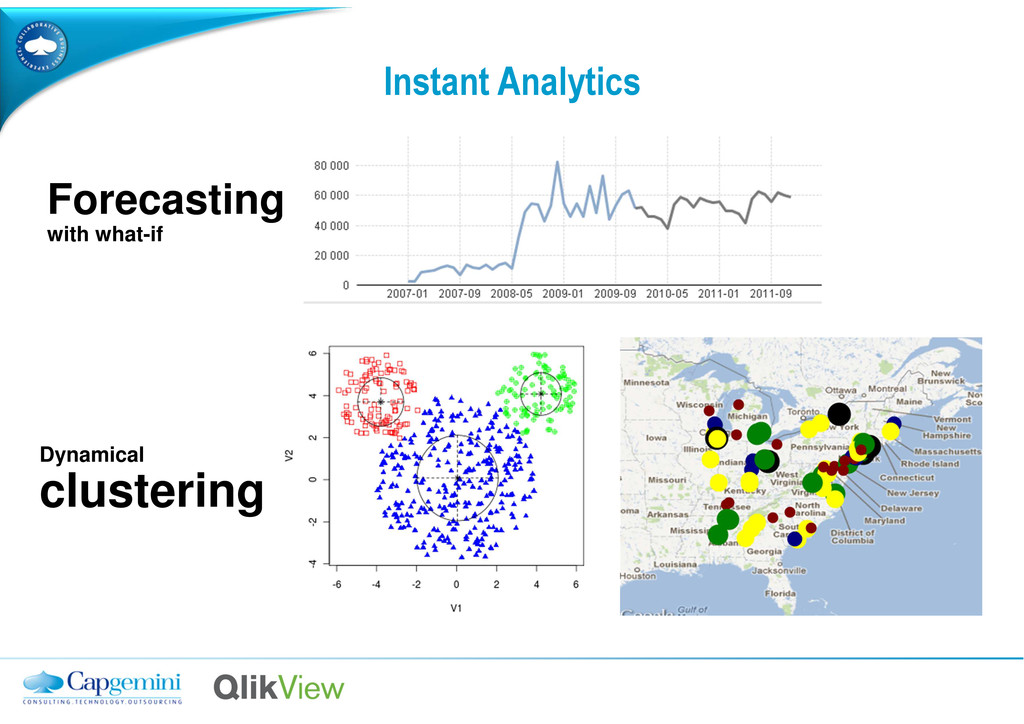
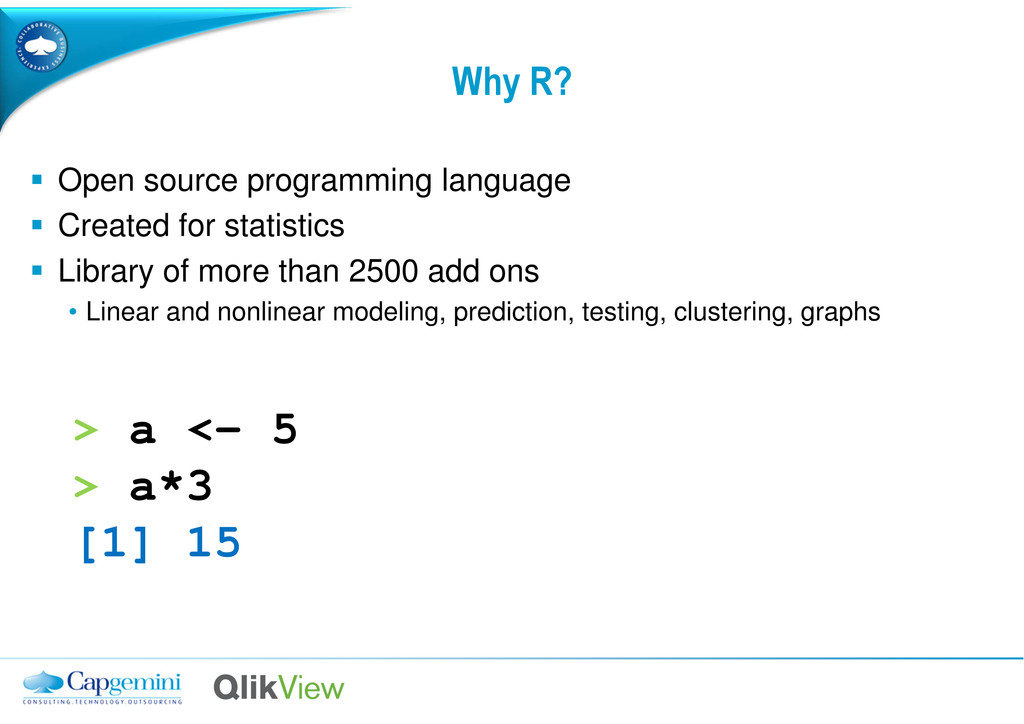
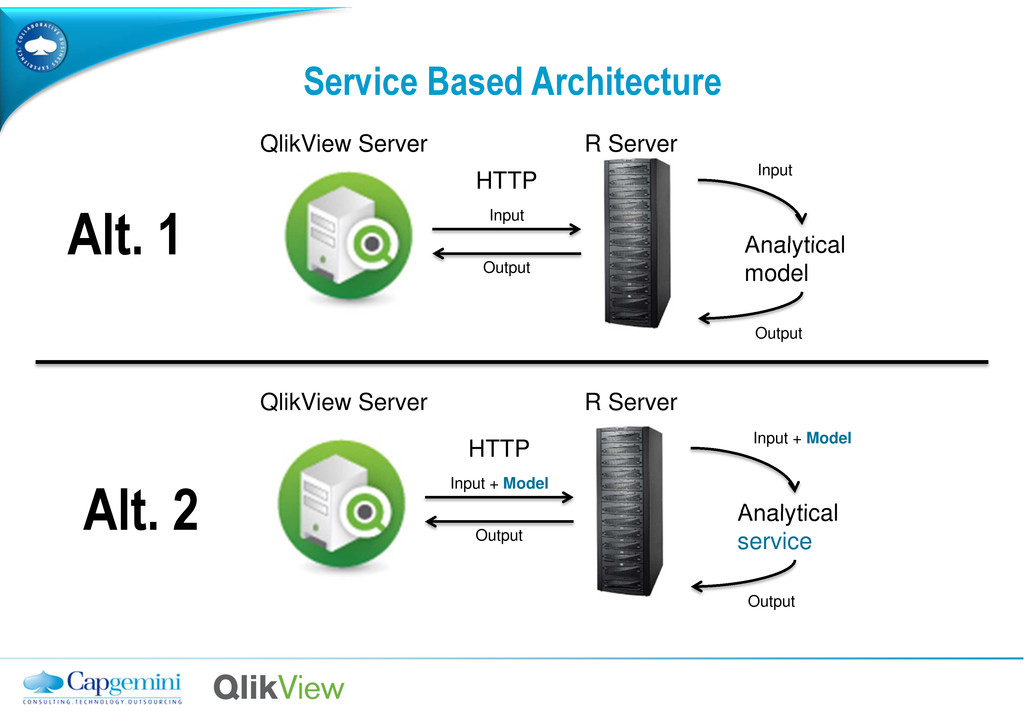
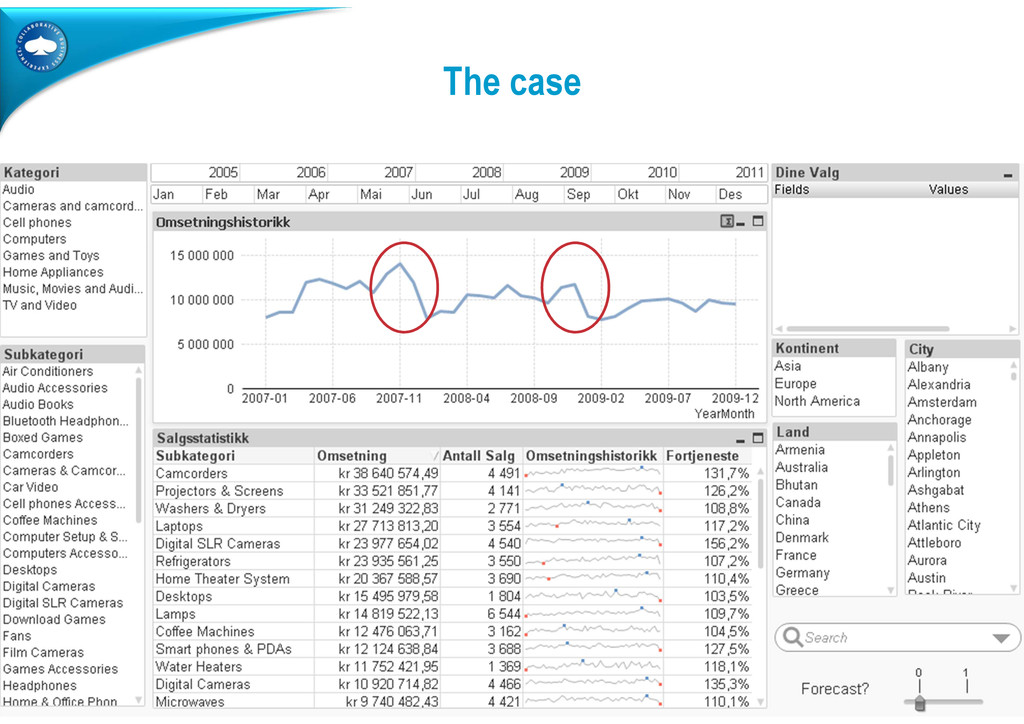
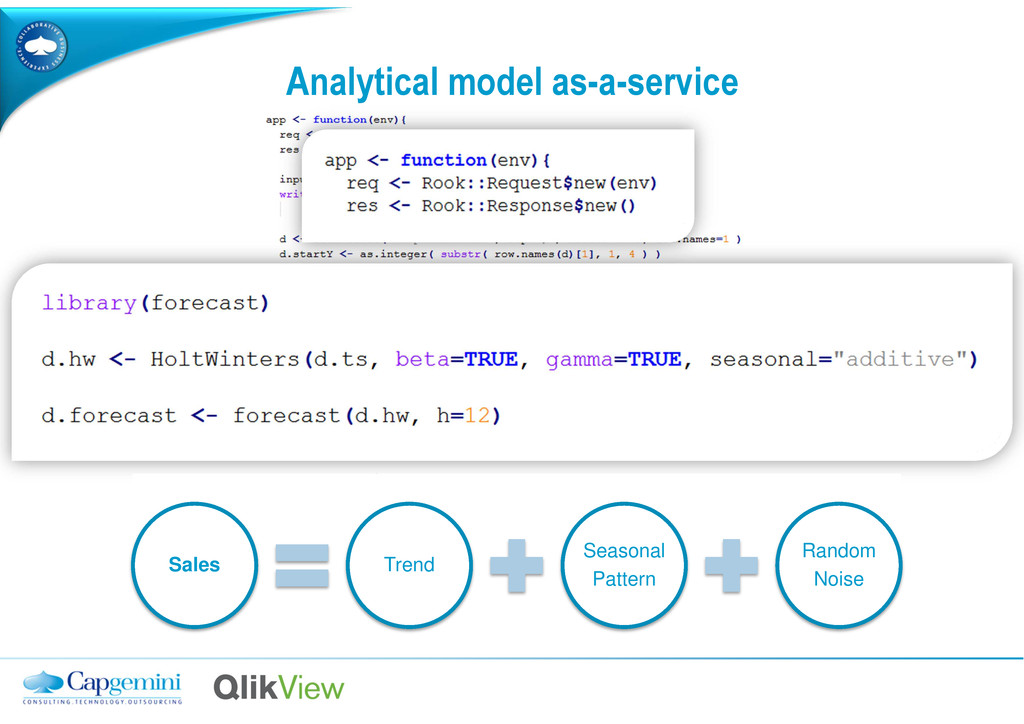
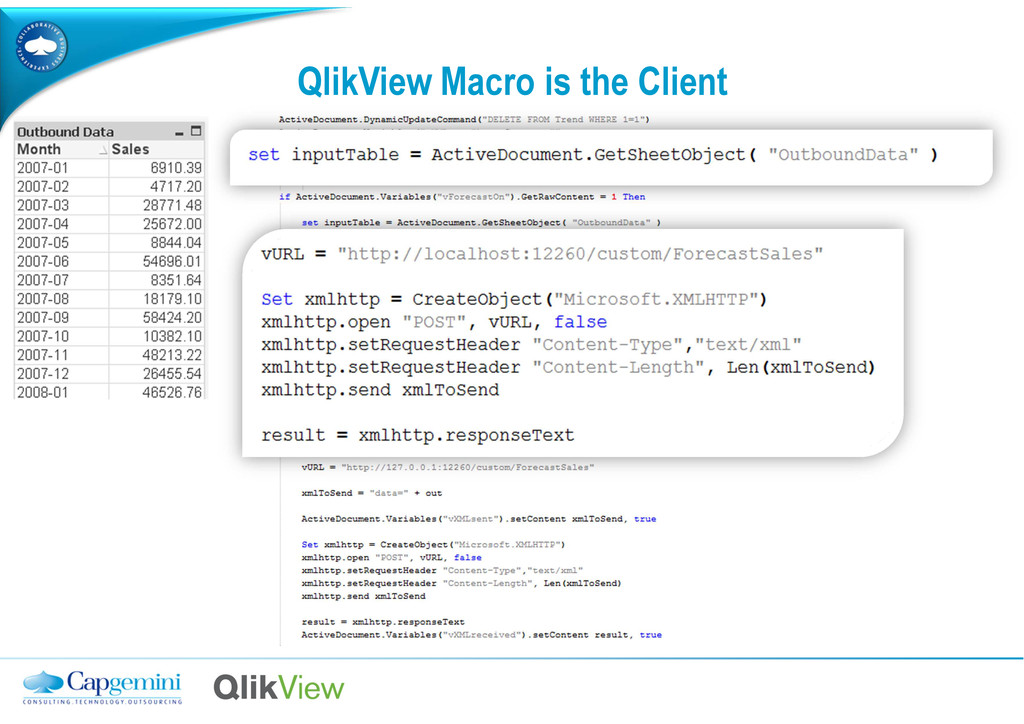
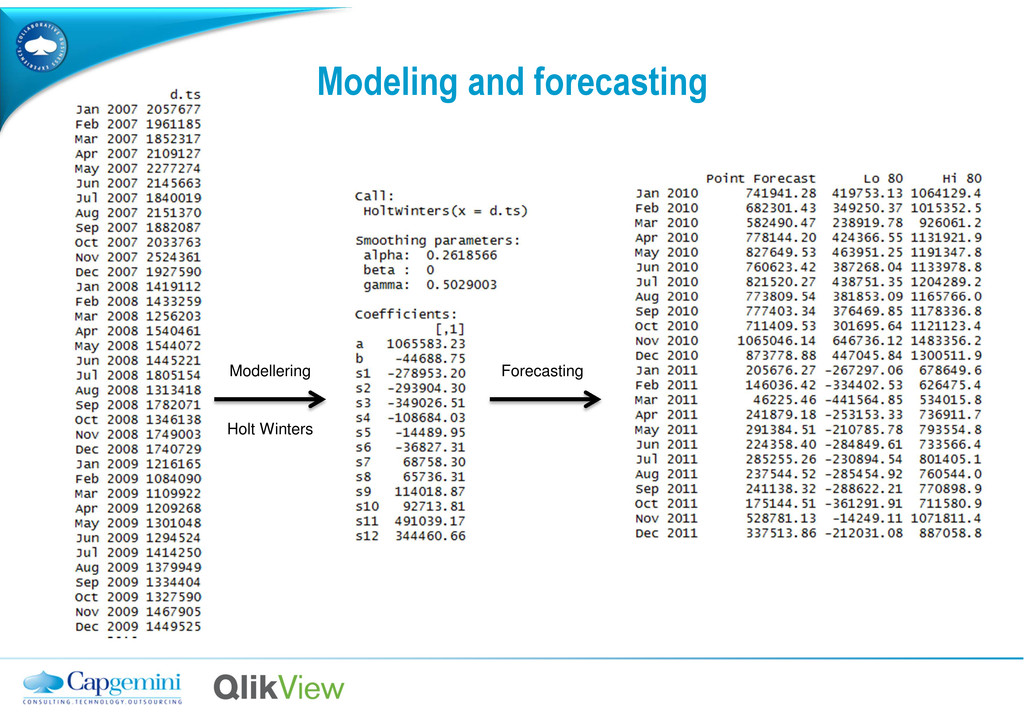
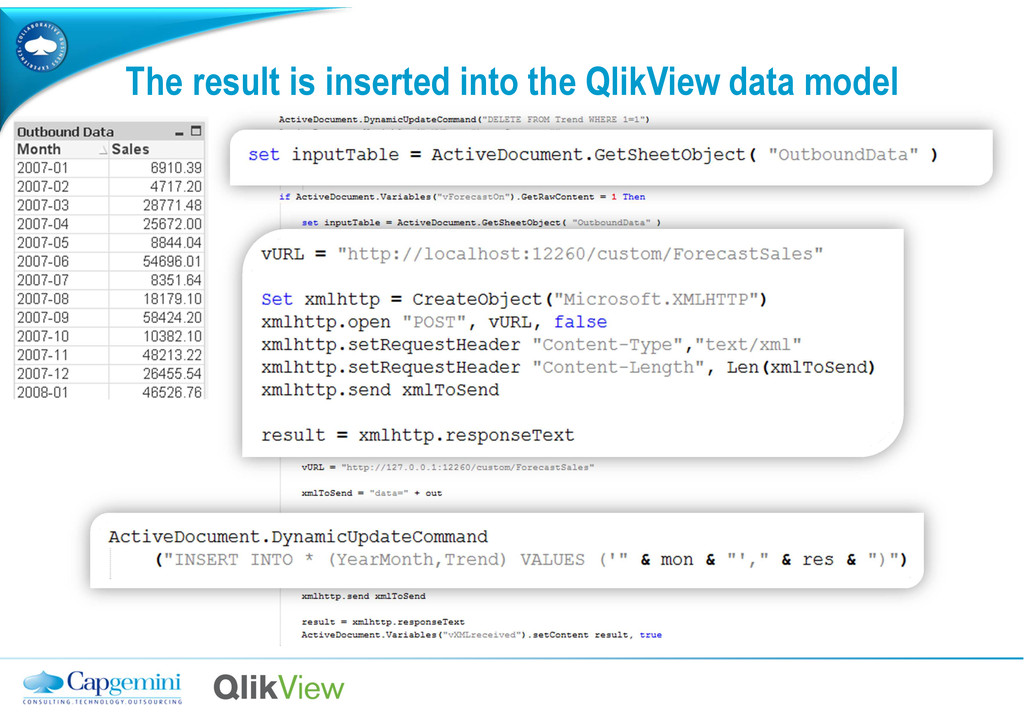
A walkthrough of how to integrate QlikView with R to enable advanced statistical analysis directly in QlikView.

Avatar for Even Vinge

Even Vinge

July 03, 2012
Tweet

More Decks by Even Vinge

Other Decks in Technology

Transcript

  1. What is Analytics? Customer Analytics • Churn Analysis, Upsell, Cross

    Sell • Wallet Size Analysis Market Analytics • Market Segmentation • Social Network Analysis Fraud Management • Credit Card Fraud Detection • Tax and Welfare Fraud Detection Risk Analytics • Scoring • Capital at Risk Enterprise Performance Analytics • Trends and Forecasting • Profitability Analysis Planning & Scheduling • Workforce Optimization • Supply Chain Planning
  2. Why R? Open source programming language Created for statistics Library

    of more than 2500 add ons • Linear and nonlinear modeling, prediction, testing, clustering, graphs > a <- 5 > a*3 [1] 15
  3. Service Based Architecture HTTP Input Output Analytical model QlikView Server

    Input Output R Server HTTP Input + Model Output Analytical service Input + Model Output QlikView Server R Server Alt. 1 Alt. 2
  4. Further Possibilities Permanent storage Manual forecasts, comments Queries against web

    services Updated currency rates, stocks, weather Google Predict Sentiment analysis, machine learning