Upgrade to Pro — share decks privately, control downloads, hide ads and more …

DevOpsATL - Public Radio Analytics

DevOpsATL - Public Radio Analytics

Building an Analytics Pipeline with Elasticsearch (and Logstash and Kibana)

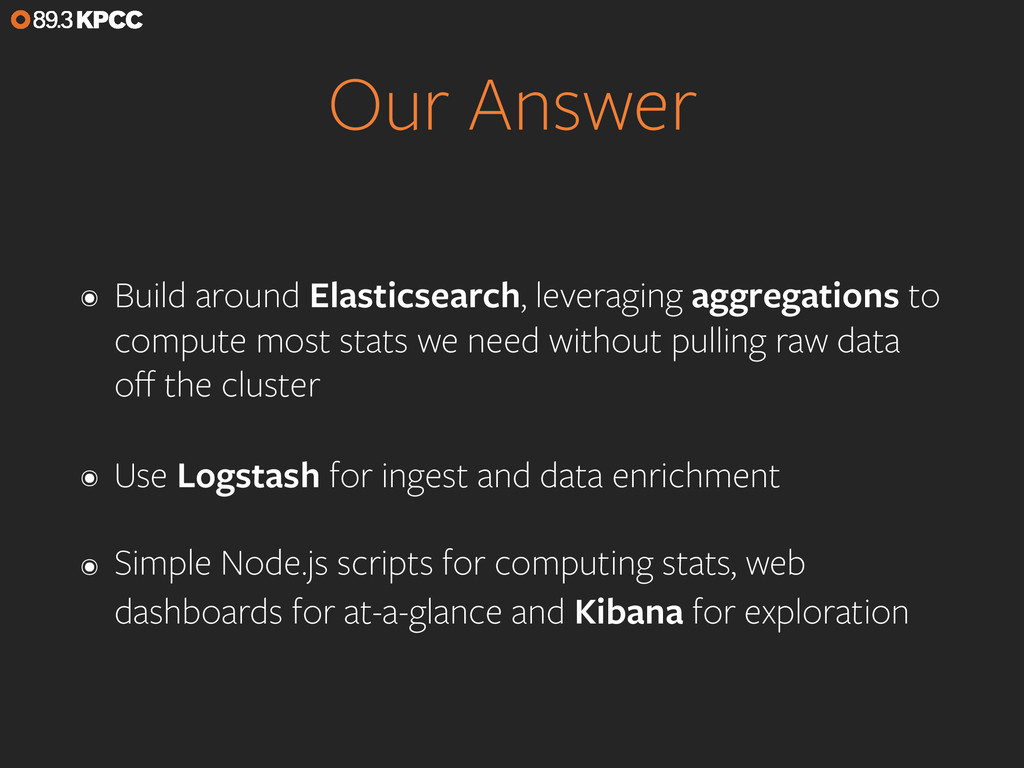
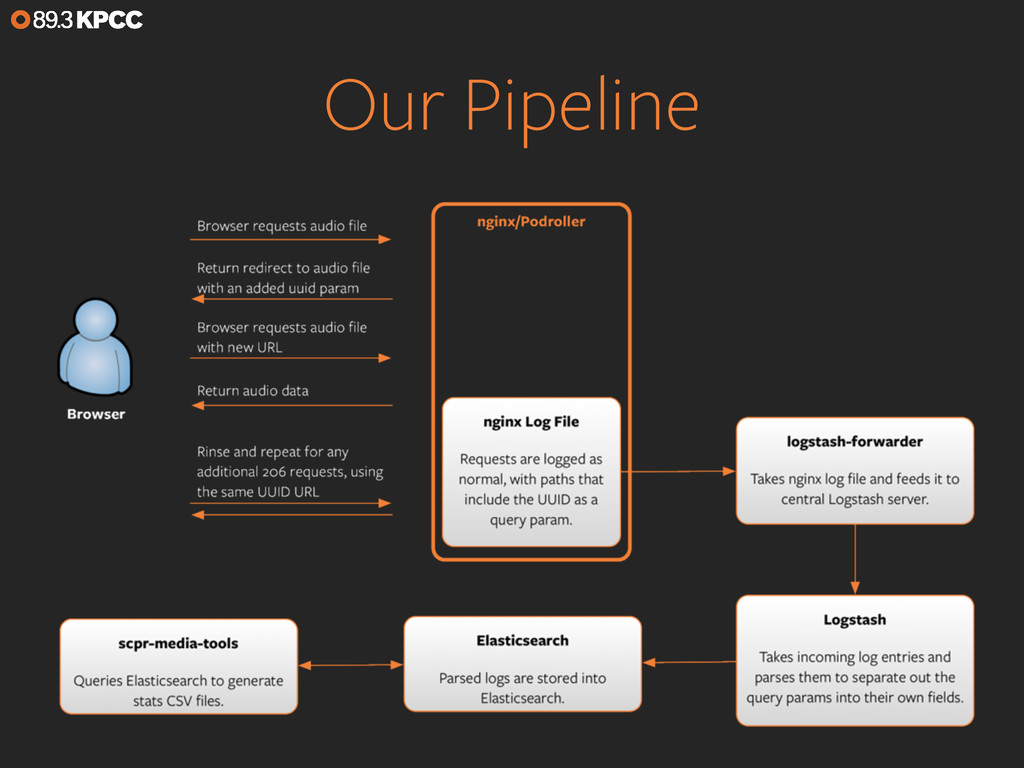
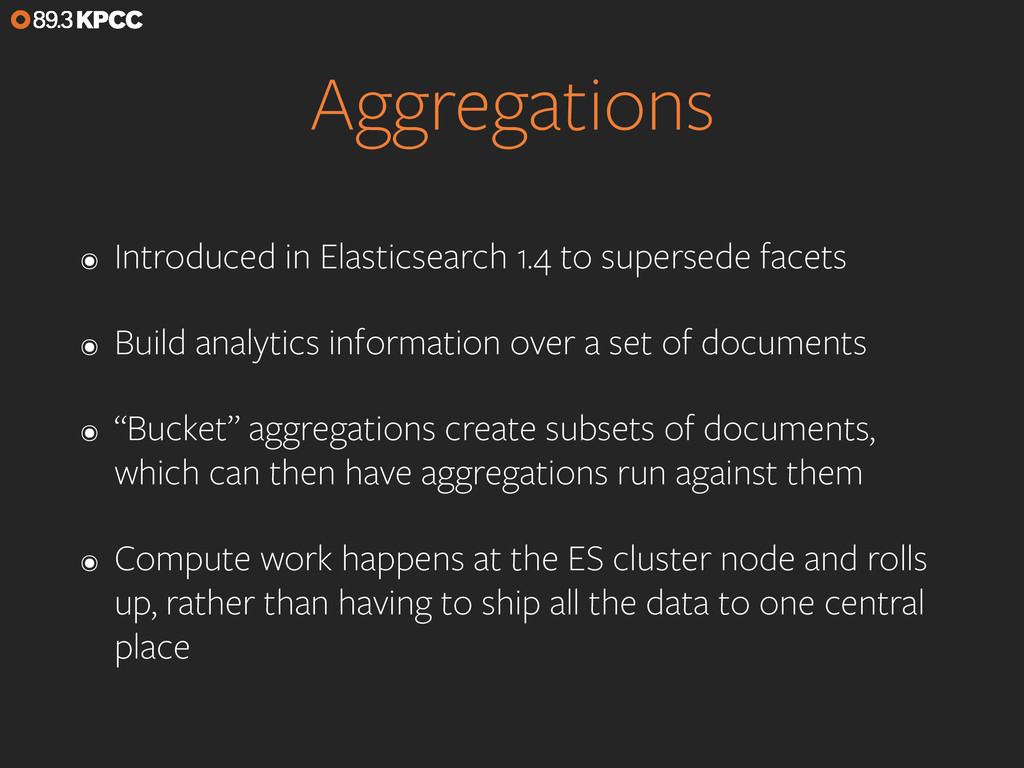
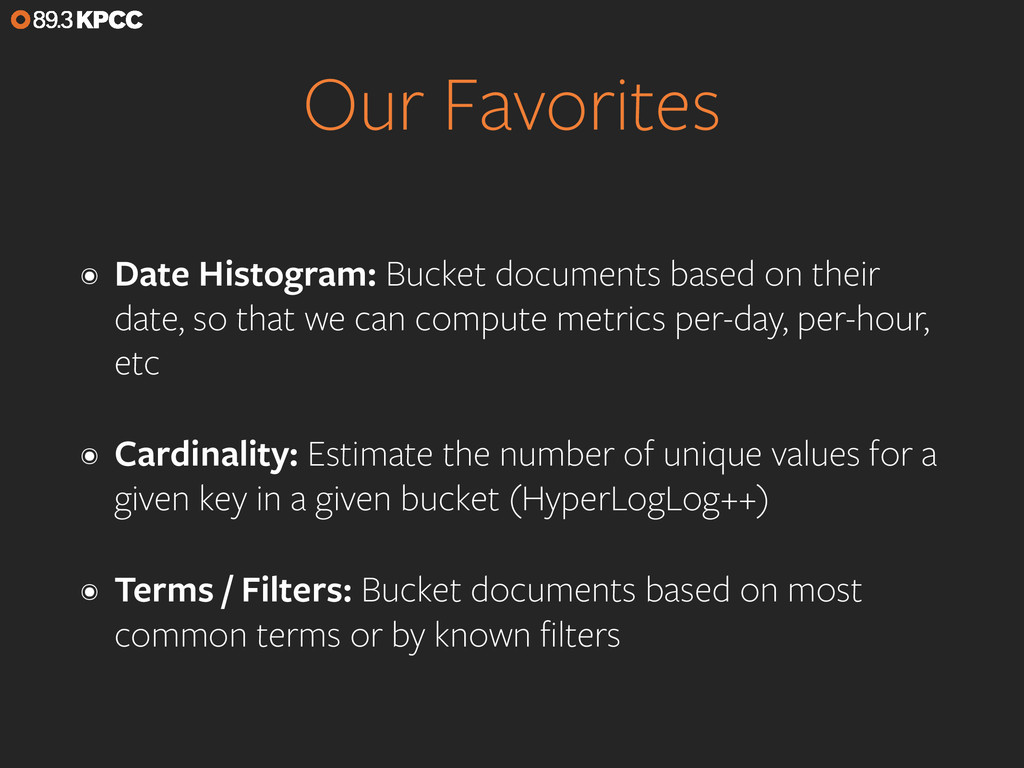
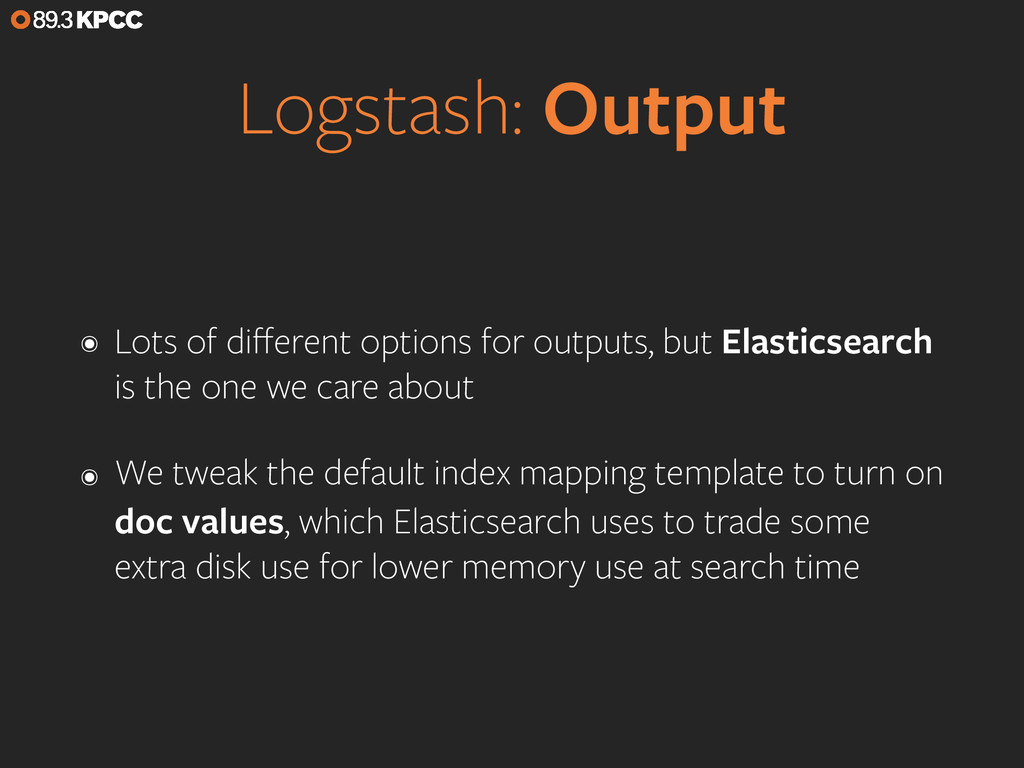
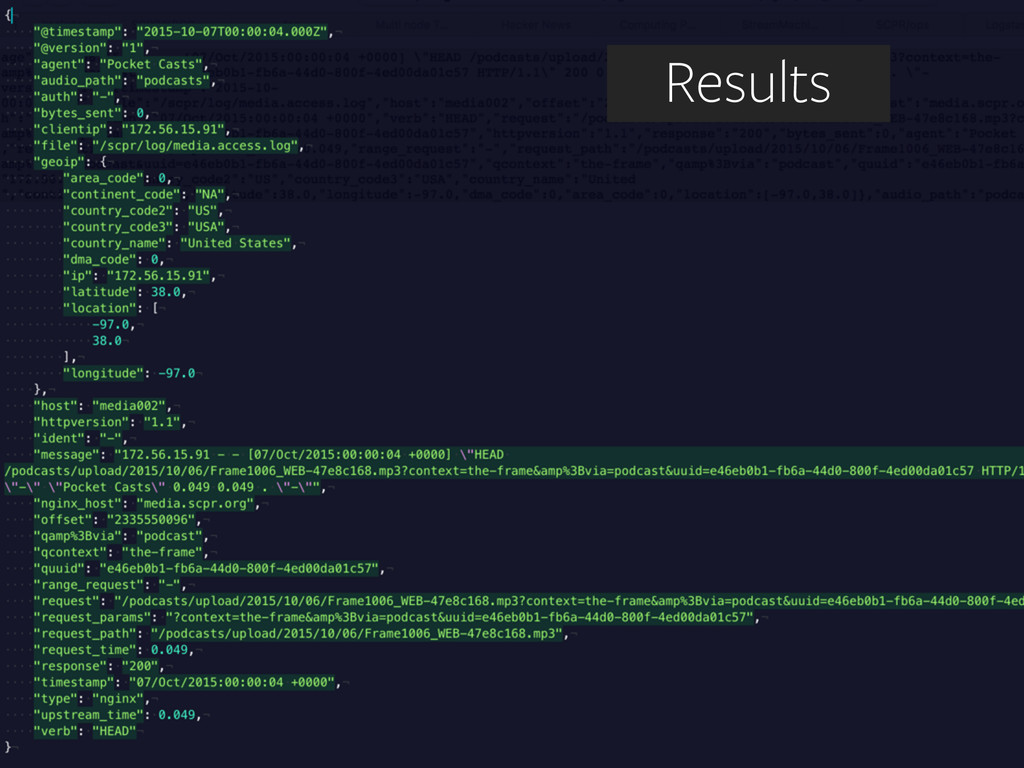
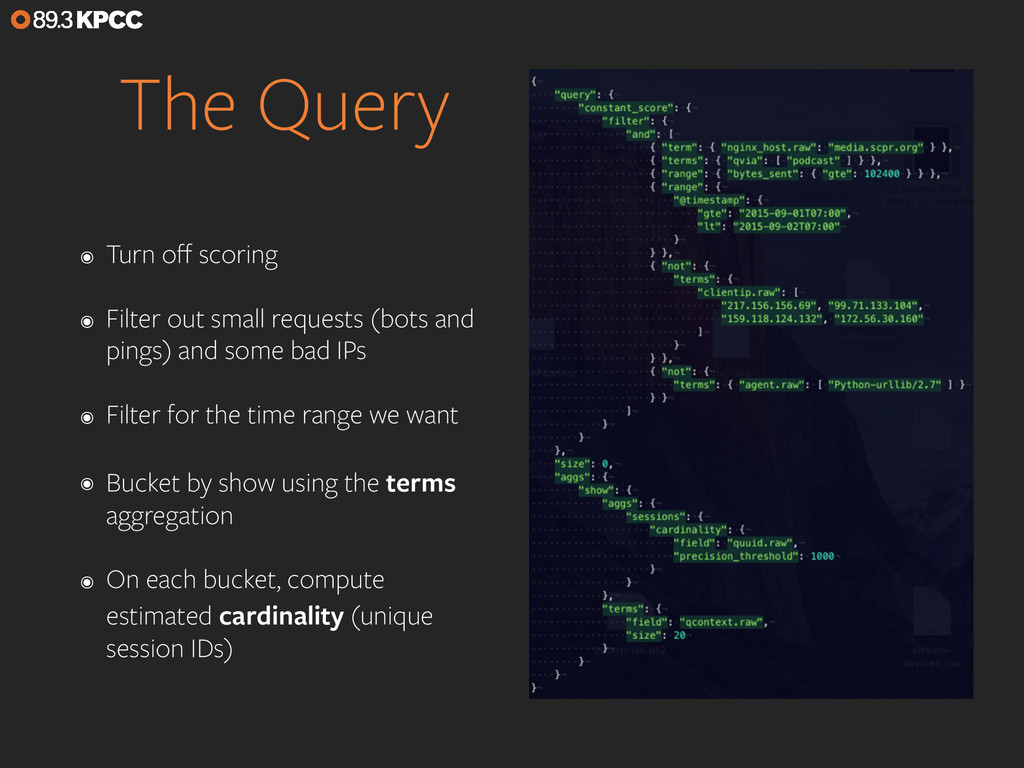
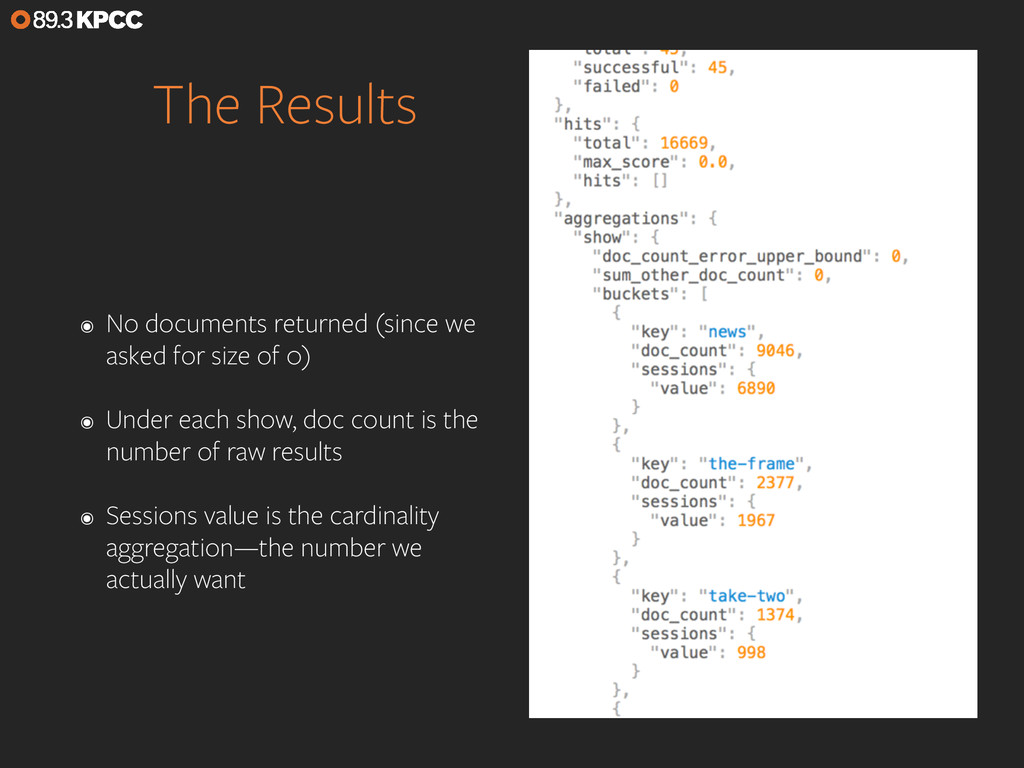
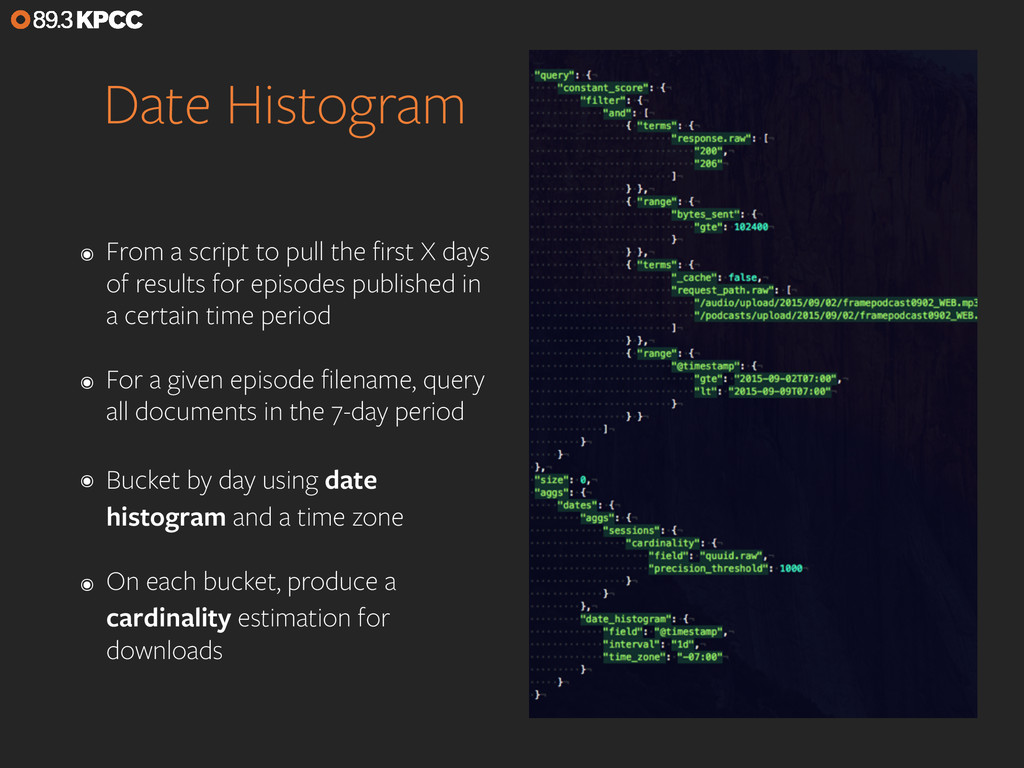
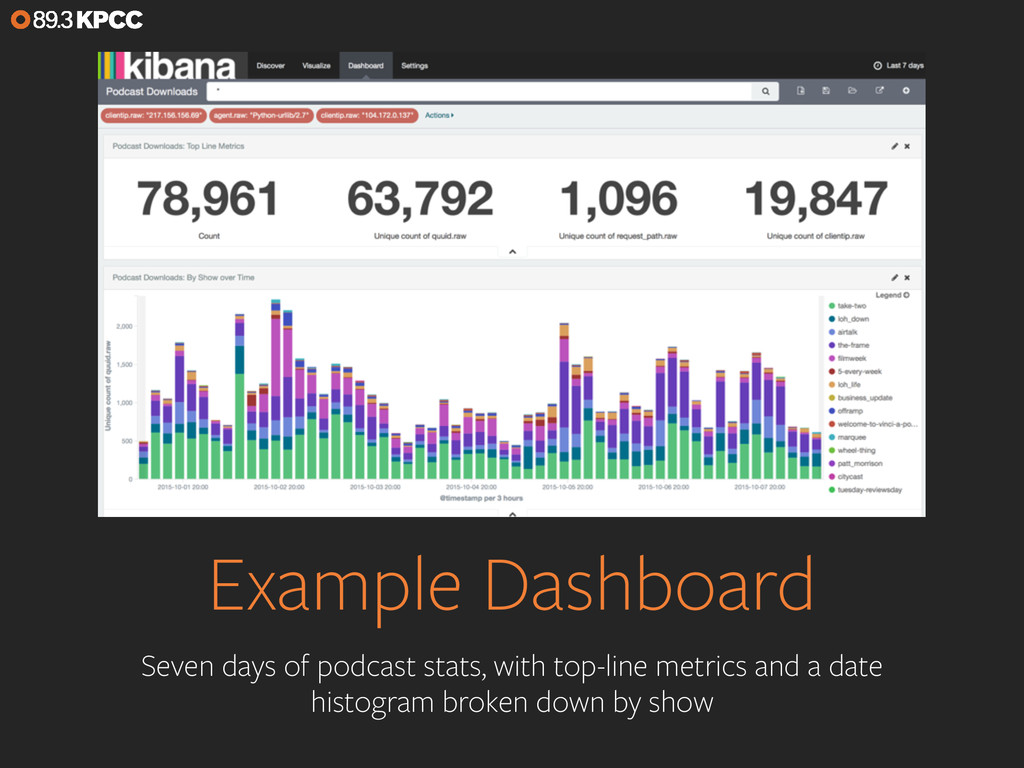
If you want to monitor your web traffic, you just drop in the tracking code for Google Analytics. But what if you want to monitor traffic that’s a little more esoteric, such as podcast downloads and audio stream listening? We’ll look at the analytics pipeline we’ve set up for Southern California Public Radio that leans on Elasticsearch aggregations to do the heavy lifting needed to turn our raw logs into listener data and realtime stats. We’ll also touch on using Logstash for data ingest and Kibana for visualizations and exploration.

Avatar for Eric Richardson

Eric Richardson

October 08, 2015
Tweet

More Decks by Eric Richardson

Other Decks in Technology

Transcript

  1. About KPCC ๏ NPR affiliate in the Los Angeles market

    ๏ Largest NPR news station according to one recent ranker of weekly cume audience ๏ Large newsroom and four locally-produced news and culture programs
  2. About Me ๏ Originally on the dev side—came up through

    Perl and Ruby programming ๏ Have worked at the Jet Propulsion Lab, a custom mapping firm, and started a weekly print newspaper ๏ Lived in LA for ten years and worked at KPCC 2011-2012 before moving to Atlanta ๏ Rejoined the station last fall, working remotely ๏ Responsible for digital infrastructure, with a focus on audio delivery
  3. Build a pipeline for realtime audio analytics on public radio

    manpower and a public radio budget The Challenge:
  4. Our (Tiny) Setup ๏ Three physical hosts in a Los

    Angeles datacenter, running VMware ๏ Three VM nodes in the ES cluster, using local storage on each physical host. One VM running Logstash ๏ ~5GB/day in ES audio analytics indices
  5. Counting Podcasts: Challenges ๏ We understand listeners, but for podcasts

    we can only ever see “downloads” ๏ A download can be one 200 request, or many partial 206 requests ๏ Not all requests that hit the server are legitimate downloads—bots, “pings,” etc
  6. Other Stations? ๏ A number of big stations (plus NPR)

    are using Splunk, pouring raw logs in and then running analysis ๏ External services: Podtrac, Midroll, etc ๏ Some audio-focused CDNs offer stats
  7. Our Answer ๏ Build around Elasticsearch, leveraging aggregations to compute

    most stats we need without pulling raw data off the cluster ๏ Use Logstash for ingest and data enrichment ๏ Simple Node.js scripts for computing stats, web dashboards for at-a-glance and Kibana for exploration
  8. Aggregations ๏ Introduced in Elasticsearch 1.4 to supersede facets ๏

    Build analytics information over a set of documents ๏ “Bucket” aggregations create subsets of documents, which can then have aggregations run against them ๏ Compute work happens at the ES cluster node and rolls up, rather than having to ship all the data to one central place
  9. Our Favorites ๏ Date Histogram: Bucket documents based on their

    date, so that we can compute metrics per-day, per-hour, etc ๏ Cardinality: Estimate the number of unique values for a given key in a given bucket (HyperLogLog++) ๏ Terms / Filters: Bucket documents based on most common terms or by known filters
  10. 2.0: Pipeline Aggregations ๏ Run aggregations on the set of

    aggregations ๏ Plot change between bucket values, moving averages, etc ๏ Elasticsearch 2.0-rc1 released today ๏ Good examples on the Elastic.co blog
  11. Logstash: Input ๏ Variety of options for getting data into

    Logstash ๏ We’re using logstash-shipper to go from frontend server to Logstash ๏ Mainly just a transport, but we also use it to inject a few host-specific tags (such as the nginx hostname)
  12. Logstash: Filters ๏ Use grok filters to break incoming log

    line down into structured data ๏ For us: ๏ Parse the NGINX log ๏ Separate request path from query params, separate query params from each other ๏ New: Synthesize a key based on request path, IP, etc
  13. Logstash: Output ๏ Lots of different options for outputs, but

    Elasticsearch is the one we care about ๏ We tweak the default index mapping template to turn on doc values, which Elasticsearch uses to trade some extra disk use for lower memory use at search time
  14. Generating Podcast Stats ๏ Need to report downloads per day,

    by show ๏ Show is tagged into our request params as `context=<show>` via the CMS. Ends up pulled out as qcontext by Logstash ๏ A UUID for the session is generated via our podroller script, and ends up as quuid
  15. The Query ๏ Turn off scoring ๏ Filter out small

    requests (bots and pings) and some bad IPs ๏ Filter for the time range we want ๏ Bucket by show using the terms aggregation ๏ On each bucket, compute estimated cardinality (unique session IDs)
  16. The Results ๏ No documents returned (since we asked for

    size of 0) ๏ Under each show, doc count is the number of raw results ๏ Sessions value is the cardinality aggregation—the number we actually want
  17. Date Histogram ๏ From a script to pull the first

    X days of results for episodes published in a certain time period ๏ For a given episode filename, query all documents in the 7-day period ๏ Bucket by day using date histogram and a time zone ๏ On each bucket, produce a cardinality estimation for downloads
  18. StreamMachine ๏ Open-source streaming audio server that outputs Shoutcast, HTML5

    and HTTP Live Streaming ๏ In production for us since 2012 ๏ HLS support in 2014 to support iTunes Radio, now powering our iPhone app ๏ Outputs “listen” events (chunks) and “sessions” to ES
  19. Listening Chunks? ๏ Shoutcast/HTML5 Streaming: Long-lived session with a defined

    start and end to the connection ๏ HTTP Live Streaming: Playlist specifying chunks of audio. Short-lived connections to download each segment, with playlist interval refresh ๏ For HLS, we have to aggregate listening for a given session ID in order to create a “session” ๏ Pull fine-grained stats off the listen events, longer-term stats off the sessions
  20. One Bucket ๏ Aggregate using date histogram to get these

    10-minute buckets ๏ On the main bucket, compute total duration (sum aggregation) ๏ Sub-bucket by client type (filters) and output stream (terms) ๏ On each sub-bucket, sum to get duration
  21. API Output ๏ Clean to remove some of the extra

    nested structures, turn array of objects into hash, etc ๏ Listeners: Duration delivered divided by the amount of time in the bucket period
  22. Kibana ๏ Elastic’s client for data viz / exploration ๏

    Originally built around time-series data, so good support for timestamped indices, time selection, etc ๏ Kibana 4 added support for ES aggregations ๏ Useful for poking around, but you’ll still end up wanting to build your own dashboards eventually
  23. Elasticsearch ๏ JVM apps are special—lots of knobs for tuning

    your memory usage, heap, etc ๏ Elasticsearch has gotten better about limits, but you can still shoot yourself in the foot via memory usage ๏ Lots of options for configuration: master nodes, data- only nodes, hot vs warm routing, etc ๏ Default cluster balancing is by shard count, not shard size
  24. Indexing ๏ For aggregations like cardinality and terms, make sure

    you have a non-analyzed version of the field ๏ Logstash gives you this by default as `field.raw` ๏ Turn off the full-text bits you don’t need (`_all`, analyzed text, etc) ๏ Make sure your numeric data is getting indexed into numeric types